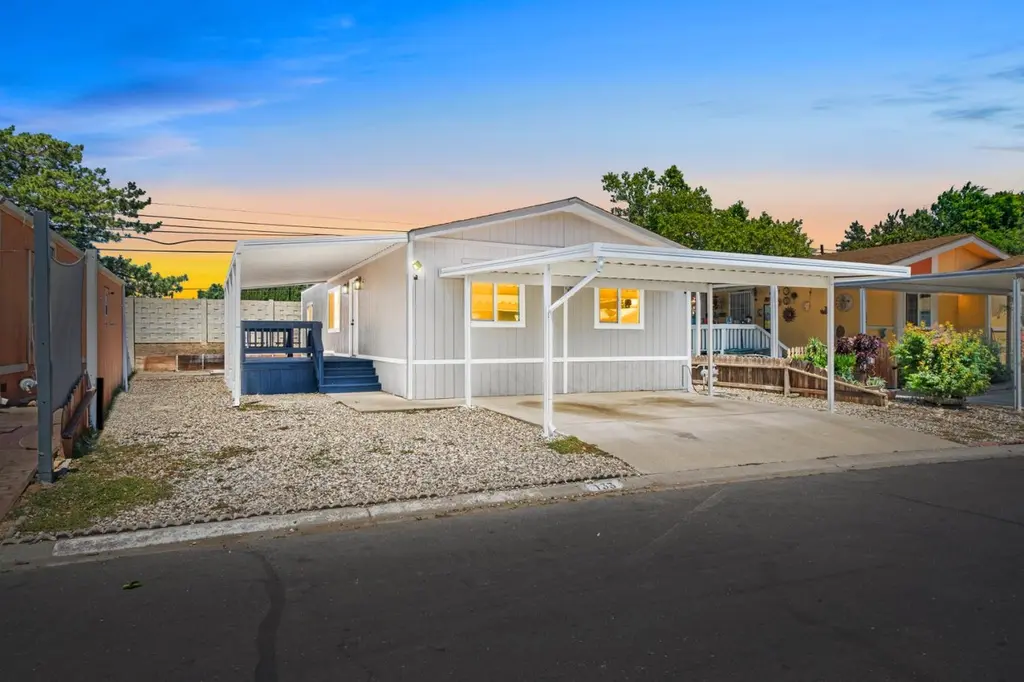
1399 Sacramento Ave #133 · West Sacramento, CA
Flood risk 4/10 · Minor
- FEMA flood zone
- —
- Chance of flooding over 30 yrs
- 0.22%
- Est. flood insurance / yr
- —
Fire risk 1/10 · Minimal
- Est. fire insurance / yr
- $659 – $1,223
Heat risk 7/10 · Major
- Hot days now (above 103°F)
- 7 days/yr
- Hot days in 30 yrs
- 15 days/yr
Wind risk 1/10 · Minimal
- Chance of severe wind over 30 yrs
- —
Air-quality risk 10/10 · Severe
- Unhealthy air days now
- 27 days/yr
- Unhealthy air days in 30 yrs
- 33 days/yr
Risk factors via First Street. Map © Google.
Why this score? — see what drove the B- grade
The composite is a weighted blend of 9 inputs, each scored 0–100. Each bar is that input's sub-score; the figure is the points it added to the 100-point composite (weight × sub-score).
- Cash flow +30.0/30.0
- DSCR +10.0/10.0
- 1% rule +9.2/10.0
- ARV discount +7.5/15.0
- Schools +3.8/10.0
- Livability +3.7/5.0
- Condition / age +2.5/5.0
- Rent growth +1.9/5.0
- Appreciation +0.0/10.0
$189,500
🖨 Deal sheet (PDF) 📄 Offer letter ✓ Due diligence
Listing remarks
Welcome to West Wind Estates, an All-Age community offering a resort lifestyle with incredible amenities and comfort. Unit 133 is truly one of a kind it is a completely remodeled double-wide mobile home showcasing modern luxury upgrades from top to bottom. Not to forget it's premium lot it sits on that can comfortably park 3 cars. This move-in ready home features a brand new roof, new HVAC system, all new siding, and brand new double-pane windows throughout for enhanced energy efficiency and peace of mind. Step inside to discover a stunning modern kitchen highlighted by quartz countertops, sleek finishes, and a grand oversized island perfect for entertaining. The spacious primary suite feat
Key facts
- New siding
- Brand new roof
- Premium lot
Tags
Property features AI
Finance
- Other: Located in Yolo County, Broderick (1399 Sacramento Ave #133, West Sacramento, CA 95605); Cross street: Todhunter Ave
- Financial info: Land lease amount listed (if applicable) $790
- HOA & community: No homeowners association; Not a senior community; No land lease
Exterior
- Parking: Assigned covered parking; Guest parking available
- Utilities: Public water; Public sewer; Cable available; 220V in laundry
- Home design: Manufactured in park (double wide); Made by ODYSEY; Year built 1989
- Construction: Wood skirting
- Exterior features: Backyard; Front yard; Regular lot shape; Composition roof
Interior
- Kitchen: Slab counters; Kitchen island; Free standing gas range; Free standing gas oven; Free standing refrigerator; Dishwasher; Microwave
- Bedrooms: 3 bedrooms
- Bathrooms: 2 full bathrooms; Tub with shower over; Shower stall(s)
- Heating & cooling: Central heating; Central cooling
- Interior features: Open beam ceiling; Covered patio; Caulked/sealed dual-pane windows; Pets allowed
- Laundry & utility: Laundry hookups inside; Gas water heater
Neighborhood map
What this means for you Summary
Snapshot
- This is a 3-bed/2.0-bath manufactured listed at $190k.
Deal economics
- At list price, monthly cash flow is $818 ($10k/yr) — positive.
- The deal already cash-flows at list — no discount required.
- Meets the 1% rule at list price ($3k rent vs $190k).
- Recommended offer: $184k (3.0% below list) — sets the bar for market timing.
Location & tenants
- Location reads 73/100 on livability (#164 in CA) — a middle-class / working-renter tenant base. Strengths: housing A+, commute A, employment A-; Watch: cost of living F.
- Washington Unified (suburban): math 30% / reading 57% proficiency, ranked #197 of 517 in CA (top 38%) — families likely to look elsewhere, expect single-tenant / working-renter base with shorter leases.
- Market conditions: Rents soft (-2.4%/yr); 52 active listings in the ZIP; 7 comparable units currently listed for rent nearby; rentals leasing fast (median 3d on market — plan ~1-2 weeks tenant-placement turnaround); 721 units permitted in Yolo County in 2024 (260 in 5+ unit buildings).
- This rent runs 45% of the median local income ($72k/yr) — at the standard rent-burdened threshold; future hikes will face affordability resistance.
Forward outlook
- Local home prices are declining (-3.0%/yr); year-one equity from $1k of loan paydown is wiped out by about $6k of value loss. Plan a longer hold.
- Yolo County population projected at +31% by 2050 — long-run rental-demand tailwind backs the buy-and-hold thesis.
- At projected returns (-3.0% appreciation + 0.0% rent growth), your $53k cash investment doubles in ~9 years — after that, you're playing with house money.
Negotiation context
- It's been on market 31 days — a 3% lower offer ($184k) is reasonable based on typical stale-listing flexibility.
Risks & watch-outs
- Climate carrying-cost: extreme-heat days projected 7→15/yr by 2055 (HVAC capex compounding) — expect insurance premiums to compound above CPI over the hold.
Questions for the listing agent
- It's been on market 31 days. Have you received any prior offers? Is the seller open to a 3% concession, seller financing, or rate buy-down credit?
- Is there a deadline driving the sale (1031 exchange, divorce, estate, relocation)? That informs how much negotiation room exists.
- What's the average days-on-market for RENTAL listings here right now (not sales)? A rising rental-DOM trend means longer vacancies and softer asking-rent achievability than the comps imply.
- What's the recent tenant-quality profile in this submarket — average credit score on applications, eviction rate, late-payment / NSF rate, and stable-employment percentage? A property-management company in the area should have these aggregated.
- How much new for-sale + rental construction is in the pipeline within 1–3 miles? Heavy new supply typically softens prices + rents 12–24 months out; constrained supply supports both.
Investment metrics
- 1% rule
- 1.42% ✓
- Cap rate
- 11.47%
- Cash-on-cash
- 18.49%
- DSCR
- 1.82
- GRM
- 5.9
CMA / ARV
No comps found within radius.
Projected returns pro-forma
-3.0% appreciation · 0.0% rent growth · sell at horizon
- IRR
- 6.8%
- Equity multiple
- 1.25×
- Total profit
- $13,511
- Equity at exit
- $28,255
- IRR
- 13.3%
- Equity multiple
- 1.91×
- Total profit
- $48,482
- Equity at exit
- $16,384
Cash invested: $53,060 (down + closing). Projections, not guarantees.
Landlord ↔ Tenant lean methodology
- Overall (STATE)
- 18 Strongly Tenant-Friendly
- State California
- 18 Strongly Tenant-Friendly · D+13
- County
- — inherits STATE
- City
- — inherits STATE
ZIP-level market 95605
- Rents YoY
- -2.4%
- Active inventory
- 52
- Price-to-rent
- 5.9×
Monthly cashflow live
- Estimated rent
- $2,693 high interval (Pro) →
- Mortgage (P&I)
- −$994
- Tax est. 1.5%
- −$237 /mo · $2,842/yr
- Insurance
- −$79
- HOA
- −$0
- Vacancy / Maint / Mgmt
- −$565
- Net cashflow
- $818
Break-even live
Sensitivity live
| Price | -10% $948 | -5% $883 | +0% $818 | +5% $752 | +10% $687 |
|---|---|---|---|---|---|
| Rent | -10% $605 | -5% $711 | +0% $818 | +5% $924 | +10% $1,030 |
| Rate | -1.0pp $913 | -0.5pp $866 | base $818 | +0.5pp $768 | +1.0pp $718 |
UW: 25.0% down · 7.5% · 30yr · 1.5% tax · 5.0% vac · 8.0% maint · 8.0% mgmt
Financing live
Cash to close
- Down payment
- $47,375
- Closing costs
- $5,685
- Reserves months
- —
- Total cash needed
- —
Loan-product check · same deal, 3 products live
Conventional
25% down · 7.5% · 30yr
- Down + closing
- —
- Monthly P&I
- —
- Monthly cashflow
- —
- DSCR
- —
- Eligible?
- —
Personal DTI + credit; lowest rate.
DSCR
20% down · 8.5% · 30yr
- Down + closing
- —
- Monthly P&I
- —
- Monthly cashflow
- —
- DSCR
- —
- Eligible?
- —
No personal income docs; deal must DSCR.
Hard money
10% down · 12.0% · 12mo
- Down + closing
- —
- Monthly P&I
- —
- Monthly cashflow
- —
- DSCR
- —
- Eligible?
- —
Short-term bridge; refi at stabilization.
Rent comps 7 comps
| Address | Beds | Baths | Sqft | Rent | $/sqft | DOM | Units | Dist |
|---|---|---|---|---|---|---|---|---|
| 709 Solano St West Sacramento, CA | 4.0 | 3.0 | 1500 | $3,000 | $2.00 | 2d | 1 | 0.53mi |
| 500 Douglas St West Sacramento, CA | 3.0 | 1.0–2.0 | 874 | $2,939 | $3.36 | 4d | 22 | 0.86mi |
| 777 5th St West Sacramento, CA | 2.0 | 1.0–2.0 | 878 | $10,000 | $11.38 | 2d | 15 | 1.21mi |
| 2763 River Plaza Dr Sacramento, CA | 1.0–3.0 | 1.0–2.0 | 848 | $2,400 | $2.83 | 2d | 8 | 1.35mi |
| 120 Soaring Hawk Ln Sacramento, CA | 2.0 | 2.0 | 1026 | $2,195 | $2.14 | 17d | 1 | 1.39mi |
| 4 White Lily Ct Sacramento, CA | 3.0 | 2.0 | 1270 | $2,395 | $1.89 | 44d | 1 | 1.42mi |
| 2227 River Plaza Dr Sacramento, CA | 1.0–2.0 | 1.0–2.0 | 890 | $2,220 | $2.49 | 2d | 19 | 1.46mi |
Listing history 16 events
-
2026-06-19days on market $189,500 Active 31 DOM
-
2026-06-18days on market $189,500 Active 30 DOM
-
2026-06-17days on market $189,500 Active 29 DOM
-
2026-06-16days on market $189,500 Active 28 DOM
-
2026-06-15days on market $189,500 Active 27 DOM
-
2026-06-14days on market $189,500 Active 25 DOM
-
2026-06-12days on market $189,500 Active 24 DOM
-
2026-06-09days on market $189,500 Active 21 DOM
-
2026-06-08days on market $189,500 Active 20 DOM
-
2026-06-07days on market $189,500 Active 19 DOM
-
2026-06-07days on market $189,500 Active 18 DOM
-
2026-06-04days on market $189,500 Active 15 DOM
-
2026-06-02days on market $189,500 Active 14 DOM
-
2026-06-01days on market $189,500 Active 13 DOM
-
2026-05-31remarks 699-char remark
-
2026-05-31$189,500 Active 12 DOM
ⓘ Source: listings_history table (triggers on properties + properties_extension) + one-shot
backfill from property_details.listing_events for pre-trigger history.
Climate risk First Street
- Flood 4/10 Moderate 22% chance over 30 yrs
- Wildfire 1/10 Low
- Heat 7/10 Severe 7 d/yr ≥103°F today · 15 d/yr by 30 yrs out
- Wind 1/10 Low
- Air quality 10/10 Extreme 27 unhealthy d/yr today · 33 by 30 yrs out
Nearby sold comps map
Loading sold comps map…
Walkable amenities ~0.75 mi
Loading nearby amenities…
Taxation est. · year 1
- Rental income
- $32,311
- − Mortgage interest
- −$10,615
- − Property taxes
- −$2,842
- − Insurance
- −$948
- − Repairs & maintenance
- −$2,585
- − Management
- −$2,585
- − Depreciation
- −$5,513
- Taxable income
- $7,223
- Est. tax owed @ 24.0%
- −$1,734
- After-tax cash flow
- $8,077/yr
For passive investors: Depreciation is non-cash, so a rental often shows a tax loss while cash-flowing — sheltering income. Rental losses are passive: they offset passive income freely, and up to $25,000/yr can offset ordinary (W-2) income if you actively participate and your MAGI is under $100k (phasing out to $0 by $150k); unused losses carry forward. On sale, claimed depreciation is recaptured at up to 25%, and gains may owe capital-gains tax (a 1031 exchange can defer both). Figures are a year-1 estimate at your 24.0% rate — not tax advice; consult a CPA.
Schools (NCES district)
- District
- Washington Unified
- NCES district ID
- 0641580
- Math proficiency
- 30% ▼ -2.00%
- Reading proficiency
- 57% ▲ 12.00%
- Median HH income
- $55,207
- Composite
- 37.79/100
- National rank
- #4339
- State rank
- #197 of 517 in CA
Livability — West Sacramento
- Score
- 73/100
- State rank
- #164
- US rank
- #5389
Category grades
Schools grade is shown separately in the Schools card above.
Census & demographics
- Census place
- West Sacramento, CA
- County
- Yolo County · 212,115 people
- City population
- 55,039
- Metro
- Sacramento-Roseville-Folsom, CA
- Population (ZIP)
- 14,896
- Household income
- $71,924
- Rent vs Own
- Severe rent burden
- 554.0
Population outlook (Yolo County) Hauer SSP2
- Today (2025)
- 242,183 people
- By 2030
- 257,662 · +6.4%
- By 2040
- 288,050 · +18.9%
- By 2050
- 318,202 · +31.4%
- By 2075
- 392,736 · +62.2%
- By 2100
- 438,150 · +80.9%
Race, ethnicity, and origin ACS 2023
- Neighborhood character
- Diverse neighborhood (Simpson 0.67)
- Race & ethnicity
- Hispanic / Latino 47% White 31% Two or more races 21% Asian 9% Black 5%
- Hispanic origin (detail)
- Mexican 45%
- Common ancestry
- Scotch-Irish 7% Subsaharan African 4% Serbian 1%
- Foreign-born
- 35% · Canada, Vietnam, China
- Languages at home
- 42% English-only · Spanish 35% Russian/Polish/Slavic 14% Other Asian/Pacific 4%
Political lean MEDSL · Yolo
- 2024 margin
- Solid D (+36.2) · D 66.3% · R 30.1% · Other 3.6%
- 2008→2024 swing
- 0.0pp no change · 2008: 36.2pp · 2024: 36.2pp
- All cycles
- 2024: D+36.2 2020: D+41.4 2016: D+42.0 2012: D+33.2 2008: D+36.2
Not yet ingested
- Civics
- —
Market trends
- HPI YoY
- ▼ -214.35%
- Current HPI
- 397.7177
- Rent YoY
- ▼ -2.42%
- Metro
- Sacramento-Roseville-Folsom, CA
- State GDP YoY
- ▲ 3.21%
- F500 in state
- 116
Industry mix (Fortune 500 HQ in CA)
| Industry | F500 HQs | Revenue |
|---|---|---|
| Technology | 27 | $1,492B |
|
||
| Financial Services | 3 | $174B |
|
||
| Retail | 3 | $44B |
|
||
| Insurance | 3 | $26B |
|
||
| Media / Entertainment | 2 | $115B |
|
||
| Pharmaceuticals / Biotech | 2 | $62B |
|
||
Cash-flow waterfall
monthlySold comps — $/sqft
last 12 mo · ≤1 miLoading sold comps…