3763 Adelia Dr · Appling, GA
Flood risk 1/10 · Minimal
- FEMA flood zone
- X (unshaded)
- Chance of flooding over 30 yrs
- 0.0%
- Est. flood insurance / yr
- $507 – $1,088
Fire risk 4/10 · Minor
- Est. fire insurance / yr
- $963 – $1,789
Heat risk 6/10 · Moderate
- Hot days now (above 106°F)
- 7 days/yr
- Hot days in 30 yrs
- 17 days/yr
Wind risk 6/10 · Moderate
- Chance of severe wind over 30 yrs
- 47.0%
Air-quality risk 2/10 · Minimal
- Unhealthy air days now
- 1 days/yr
- Unhealthy air days in 30 yrs
- 1 days/yr
Risk factors via First Street. Map © Google.
Why this score? — see what drove the C- grade
The composite is a weighted blend of 9 inputs, each scored 0–100. Each bar is that input's sub-score; the figure is the points it added to the 100-point composite (weight × sub-score).
- Cash flow +15.5/30.0
- Appreciation +10.0/10.0
- ARV discount +7.5/15.0
- DSCR +4.8/10.0
- Schools +4.5/10.0
- 1% rule +3.3/10.0
- Livability +2.9/5.0
- Rent growth +2.5/5.0
- Condition / age +2.5/5.0
$225,000
🖨 Deal sheet (PDF) 📄 Offer letter ✓ Due diligence
Listing remarks
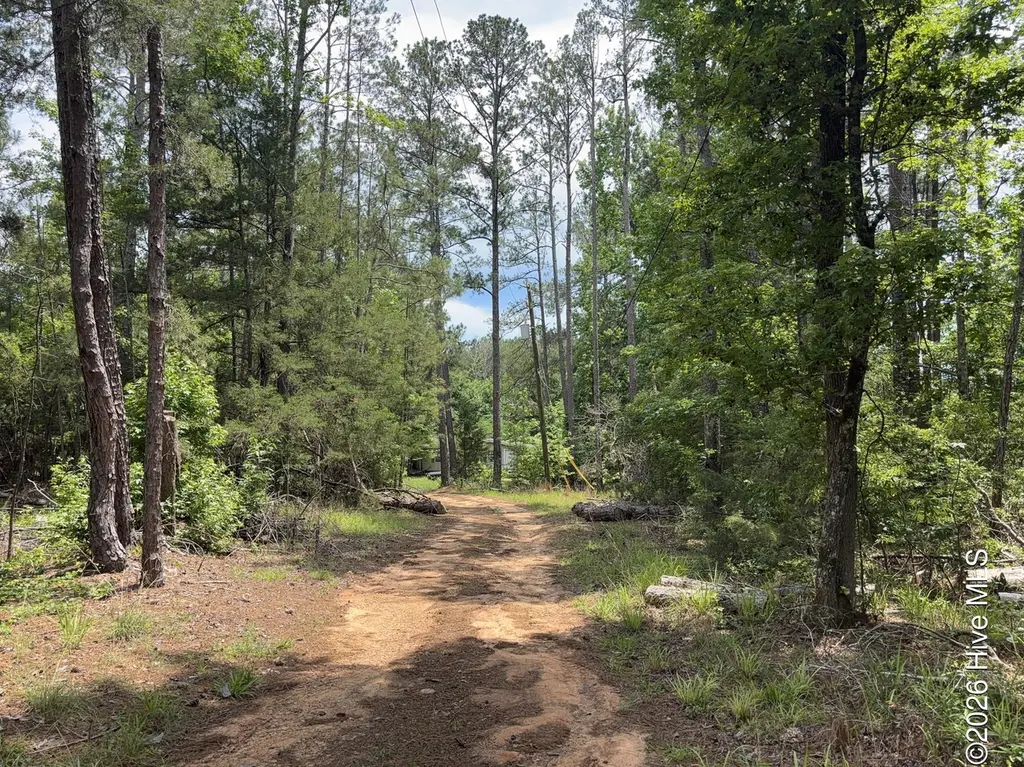
Peaceful country living awaits on 6.9 acres in Appling! Nestled on a quiet cul-de-sac with no HOA, this versatile property offers the perfect opportunity for a private weekend retreat, investment property, or future dream home site. Being sold as-is, the property includes an existing mobile home that could be renovated, or you can start fresh and build new. With plenty of space to spread out, enjoy the privacy and freedom of rural living while still being conveniently located near Wildwood Park and Clarks Hill/Lake Thurmond for boating, fishing, camping, and outdoor recreation. If you've been looking for acreage, privacy, and potential, this property is a must-see!
Key facts
- Acreage
- Privacy
- Mobile home
Tags
Property features AI
Exterior
- Parking: Unpaved parking
- Utilities: Well water; Septic tank; Water and sewer available; Private, unimproved road frontage
- Home design: Manufactured home (residential); One story; Entry level: 1
- Construction: Vinyl siding and frame construction; Composition roof; Brick/mortar permanent foundation; Built as a manufactured home
- Exterior features: Front porch; Property on a cul-de-sac; Has a view
Interior
- Bedrooms: Total of 7 rooms (bedroom count not specified separately)
- Bathrooms: 2 full bathrooms
- Heating & cooling: Space heater; No central cooling
- Interior features: Walk-in closet(s); Accessible full bath
Neighborhood map
What this means for you Summary
Snapshot
- This is a 3-bed/2.0-bath other listed at $225k.
Deal economics
- At list price, monthly cash flow is $89 ($1k/yr) — positive.
- The deal already cash-flows at list — no discount required.
- To meet the 1% rule (rent ≥ 1% of price), the offer needs to be $186k (17.3% below list).
- Recommended offer: $186k (17.3% below list) — sets the bar for 1% rule.
- Cap rate 6.8% vs local median 1.1% in Appling — top-decile yield for the area; either an underpriced asset or a hidden risk that comps aren't pricing in. Stress-test before assuming the spread holds.
Location & tenants
- Location reads 57/100 on livability (#457 in GA) — a working-class tenant base; expect higher turnover. Strengths: cost of living A; Watch: housing D+, amenities F, commute F.
- Columbia County (suburban): math 49% / reading 52% proficiency, ranked #13 of 174 in GA (top 8%) — acceptable for families but not a draw, mixed tenant base, ~2y average lease.
- Zoned schools: North Columbia Elementary School (math 67% / reading 67%, grade B+, #79 of 1,228 statewide, top 7%, 459 students, 22% FRL); Harlem Middle School (math 36% / reading 42%, grade F, #155 of 470 statewide, top 33%, 981 students, 39% FRL); Harlem High School (math 8% / reading 22%, grade F, #297 of 424 statewide, top 74%, 1,223 students, 33% FRL).
- Market conditions: 154 active listings in the ZIP; 1,213 units permitted in Columbia County in 2024 (0 in 5+ unit buildings).
Forward outlook
- In year one you build about $24k of equity ($2k loan paydown + $22k appreciation (10.0% local appreciation)).
- Columbia County population projected at +62% by 2050 — long-run rental-demand tailwind backs the buy-and-hold thesis.
- At projected returns (10.0% appreciation + 3.0% rent growth), your $63k cash investment doubles in ~3 years — after that, you're playing with house money.
- By year 2, paydown + projected appreciation supports a ~$39k cash-out refi (75% LTV) — recoverable capital for the next deal without selling this one.
Negotiation context
- It's been on market 15 days — a 2% lower offer ($222k) is reasonable based on typical stale-listing flexibility.
- 5 sale attempts with the ask held roughly flat each time — persistent listings suggest the price (not the market) is what's stuck; bring a comps-based counter.
- Current owner paid $28k; list at $225k implies a 705% gain — meaningful room to come down on a strong offer.
Risks & watch-outs
- Climate carrying-cost: major wind risk, 47% chance of damaging wind over 30y; extreme-heat days projected 7→17/yr by 2055 (HVAC capex compounding) — expect insurance premiums to compound above CPI over the hold.
Questions for the listing agent
- Is there a deadline driving the sale (1031 exchange, divorce, estate, relocation)? That informs how much negotiation room exists.
- What's the average days-on-market for RENTAL listings here right now (not sales)? A rising rental-DOM trend means longer vacancies and softer asking-rent achievability than the comps imply.
- What's the recent tenant-quality profile in this submarket — average credit score on applications, eviction rate, late-payment / NSF rate, and stable-employment percentage? A property-management company in the area should have these aggregated.
- How much new for-sale + rental construction is in the pipeline within 1–3 miles? Heavy new supply typically softens prices + rents 12–24 months out; constrained supply supports both.
Investment metrics
- 1% rule
- 0.83% ✗
- Cap rate
- 6.77%
- Cash-on-cash
- 1.69%
- DSCR
- 1.08
- GRM
- 10.1
CMA / ARV
No comps found within radius.
Projected returns pro-forma
10.0% appreciation · 3.0% rent growth · sell at horizon
- IRR
- 25.5%
- Equity multiple
- 3.03×
- Total profit
- $128,110
- Equity at exit
- $202,698
- IRR
- 22.4%
- Equity multiple
- 6.92×
- Total profit
- $372,666
- Equity at exit
- $437,126
Cash invested: $63,000 (down + closing). Projections, not guarantees.
Landlord ↔ Tenant lean methodology
- Overall (STATE)
- 90 Strongly Landlord-Friendly
- State Georgia
- 90 Strongly Landlord-Friendly · R+3
- County
- — inherits STATE
- City
- — inherits STATE
ZIP-level market 30802
- Home prices YoY
- 4.8%
- Active inventory
- 154
- Price-to-rent
- 10.1×
Monthly cashflow live
- Estimated rent
- $1,861 medium interval (Pro) →
- Mortgage (P&I)
- −$1,180
- Tax from tax record
- −$108 /mo · $1,296/yr
- Insurance
- −$94
- HOA
- −$0
- Vacancy / Maint / Mgmt
- −$391
- Net cashflow
- $89
Break-even live
Sensitivity live
| Price | -10% $216 | -5% $152 | +0% $89 | +5% $25 | +10% $-39 |
|---|---|---|---|---|---|
| Rent | -10% $-58 | -5% $15 | +0% $89 | +5% $162 | +10% $236 |
| Rate | -1.0pp $202 | -0.5pp $146 | base $89 | +0.5pp $30 | +1.0pp $-29 |
UW: 25.0% down · 7.5% · 30yr · 1.5% tax · 5.0% vac · 8.0% maint · 8.0% mgmt
Financing live
Cash to close
- Down payment
- $56,250
- Closing costs
- $6,750
- Reserves months
- —
- Total cash needed
- —
Loan-product check · same deal, 3 products live
Conventional
25% down · 7.5% · 30yr
- Down + closing
- —
- Monthly P&I
- —
- Monthly cashflow
- —
- DSCR
- —
- Eligible?
- —
Personal DTI + credit; lowest rate.
DSCR
20% down · 8.5% · 30yr
- Down + closing
- —
- Monthly P&I
- —
- Monthly cashflow
- —
- DSCR
- —
- Eligible?
- —
No personal income docs; deal must DSCR.
Hard money
10% down · 12.0% · 12mo
- Down + closing
- —
- Monthly P&I
- —
- Monthly cashflow
- —
- DSCR
- —
- Eligible?
- —
Short-term bridge; refi at stabilization.
Listing history 12 events
-
2026-06-18days on market $225,000 Active 15 DOM
-
2026-06-17days on market $225,000 Active 14 DOM
-
2026-06-16days on market $225,000 Active 13 DOM
-
2026-06-15days on market $225,000 Active 12 DOM
-
2026-06-14days on market $225,000 Active 10 DOM
-
2026-06-13days on market $225,000 Active 9 DOM
-
2026-06-10days on market $225,000 Active 7 DOM
-
2026-06-09days on market $225,000 Active 6 DOM
-
2026-06-08days on market $225,000 Active 5 DOM
-
2026-06-07days on market $225,000 Active 4 DOM
-
2026-06-03remarks 673-char remark
-
2026-06-03$225,000 Active 1 DOM
ⓘ Source: listings_history table (triggers on properties + properties_extension) + one-shot
backfill from property_details.listing_events for pre-trigger history.
Tax reassessment forecast GA · Resets to sale price
- Current annual tax
- $1,296 · $108/mo
- Projected year-2 tax
- $2,070 · $172/mo
- Expected delta
- +$774/yr (+$65/mo · 59.8%)
ⓘ Screening estimate from a state-policy table — verify with the county assessor before closing.
Climate risk First Street
- Flood 1/10 Low FEMA zone X (unshaded) · 0% chance over 30 yrs
- Wildfire 4/10 Moderate
- Heat 6/10 Major 7 d/yr ≥106°F today · 17 d/yr by 30 yrs out
- Wind 6/10 Major 47% chance of damaging wind over 30 yrs
- Air quality 2/10 Low 1 unhealthy d/yr today · 1 by 30 yrs out
Nearby sold comps map
Loading sold comps map…
Walkable amenities ~0.75 mi
Loading nearby amenities…
Taxation est. · year 1
- Rental income
- $22,334
- − Mortgage interest
- −$12,603
- − Property taxes
- −$1,296
- − Insurance
- −$1,125
- − Repairs & maintenance
- −$1,787
- − Management
- −$1,787
- − Depreciation
- −$6,545
- Taxable loss
- −$2,809
- Est. tax savings @ 24.0%
- +$674
- After-tax cash flow
- $1,738/yr
For passive investors: Depreciation is non-cash, so a rental often shows a tax loss while cash-flowing — sheltering income. Rental losses are passive: they offset passive income freely, and up to $25,000/yr can offset ordinary (W-2) income if you actively participate and your MAGI is under $100k (phasing out to $0 by $150k); unused losses carry forward. On sale, claimed depreciation is recaptured at up to 25%, and gains may owe capital-gains tax (a 1031 exchange can defer both). Figures are a year-1 estimate at your 24.0% rate — not tax advice; consult a CPA.
Schools (NCES district)
- District
- Columbia County
- NCES district ID
- 1301410
- Math proficiency
- 49% ▼ -6.00%
- Reading proficiency
- 52% ▼ -4.00%
- Median HH income
- $69,358
- Composite
- 45.04/100
- National rank
- #2695
- State rank
- #13 of 174 in GA
Livability — Appling
- Score
- 57/100
- State rank
- #457
- US rank
- #21719
Category grades
Schools grade is shown separately in the Schools card above.
Census & demographics
- Population (ZIP)
- 6,375
Population outlook (Columbia County) Hauer SSP2
- Today (2025)
- 189,073 people
- By 2030
- 212,277 · +12.3%
- By 2040
- 259,480 · +37.2%
- By 2050
- 306,991 · +62.4%
- By 2075
- 421,213 · +122.8%
- By 2100
- 496,722 · +162.7%
Race, ethnicity, and origin ACS 2023
- Neighborhood character
- Predominantly White (74%)
- Race & ethnicity
- White 74% Black 17% Two or more races 7% Hispanic / Latino 3%
- Common ancestry
- Serbian 3% Slovak 1% Italian 1%
- Foreign-born
- 1% · Canada
- Languages at home
- 97% English-only · Spanish 2%
Political lean MEDSL · Columbia
- 2024 margin
- Strong R (+25.6) · D 36.8% · R 62.5%
- 2008→2024 swing
- +17.0pp toward D · 2008: -42.7pp · 2024: -25.6pp
- All cycles
- 2024: R+25.6 2020: R+25.8 2016: R+37.7 2012: R+43.0 2008: R+42.7
Not yet ingested
- Civics
- —
Market trends
- HPI YoY
- ▲ 15.67%
- Current HPI
- 339.0061
- Rent YoY
- —
- Metro
- —
- State GDP YoY
- ▲ 2.66%
- F500 in state
- 28
Industry mix (Fortune 500 HQ in GA)
| Industry | F500 HQs | Revenue |
|---|---|---|
| Paper / Packaging | 2 | $29B |
|
||
| Retail | 1 | $160B |
|
||
| Transportation / Logistics | 1 | $91B |
|
||
| Airlines | 1 | $62B |
|
||
| Consumer Goods | 1 | $47B |
|
||
| Utilities | 1 | $25B |
|
||
Price history
+800.0% since first listed11 events — show timeline
- 2026-06-03 Listed $225,000 Hive MLS
- 2025-11-17 Listing Removed — Hive MLS
- 2025-11-17 Listing Removed — Hive MLS
- 2025-10-21 Listed $229,900 Hive MLS
- 2025-10-21 Listed $229,900 Hive MLS
- 2025-08-14 Listing Removed — Hive MLS
- 2025-08-14 Listing Removed — Hive MLS
- 2025-04-06 Listed $229,900 Hive MLS
- 2025-04-06 Listed $229,900 Hive MLS
- 1992-03-27 Sold (Public Records) $27,934 Public Records
- 1990-08-01 Sold (Public Records) $25,000 Public Records
Property tax history
+41.3%/yrLatest (2025): $1,296 · +52.1% YoY. Source: county tax records.
Cash-flow waterfall
monthlySold comps — $/sqft
last 12 mo · ≤1 miLoading sold comps…