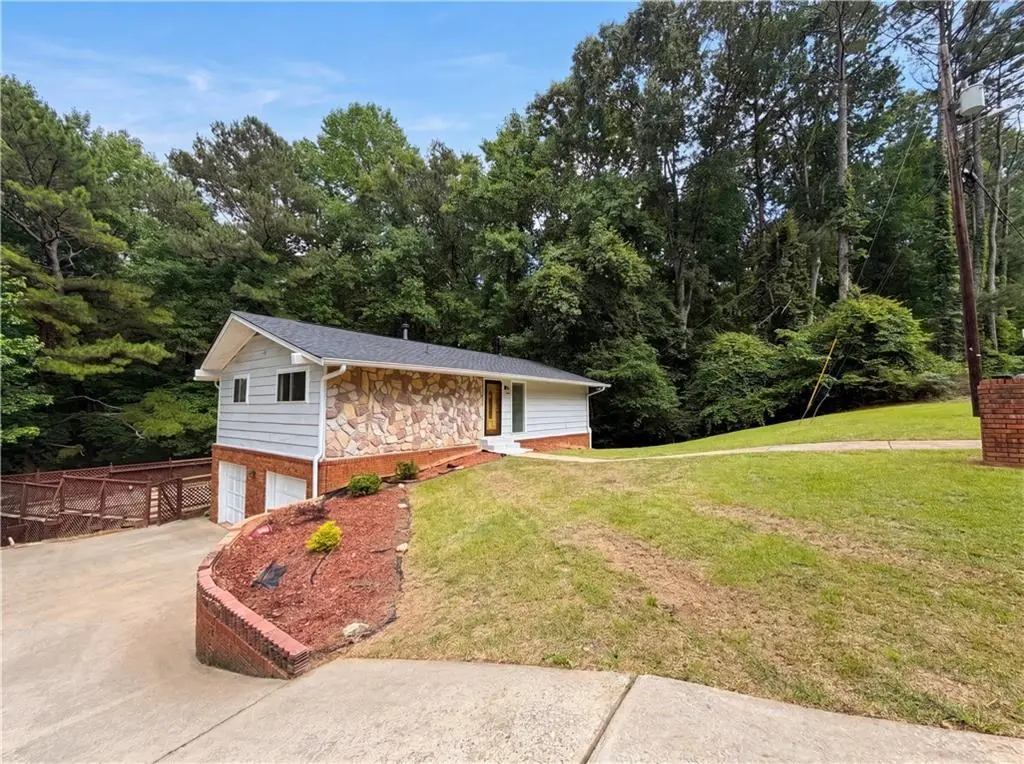
3630 Creekview Cir · South Fulton, GA
Flood risk 1/10 · Minimal
- FEMA flood zone
- X (unshaded)
- Chance of flooding over 30 yrs
- 0.0%
- Est. flood insurance / yr
- $473 – $860
Fire risk 3/10 · Minor
- Est. fire insurance / yr
- $963 – $1,789
Heat risk 5/10 · Moderate
- Hot days now (above 105°F)
- 7 days/yr
- Hot days in 30 yrs
- 18 days/yr
Wind risk 6/10 · Moderate
- Chance of severe wind over 30 yrs
- 27.0%
Air-quality risk 4/10 · Minor
- Unhealthy air days now
- 4 days/yr
- Unhealthy air days in 30 yrs
- 6 days/yr
Risk factors via First Street. Map © Google.
Why this score? — see what drove the D grade
The composite is a weighted blend of 9 inputs, each scored 0–100. Each bar is that input's sub-score; the figure is the points it added to the 100-point composite (weight × sub-score).
- Appreciation +10.0/10.0
- ARV discount +7.7/15.0
- Cash flow +7.5/30.0
- Schools +4.5/10.0
- Rent growth +2.7/5.0
- Livability +2.5/5.0
- Condition / age +2.5/5.0
- 1% rule +2.2/10.0
- DSCR +1.6/10.0
$250,000
🖨 Deal sheet 📄 Offer letter ✓ Due diligence
Listing remarks MLS
Check out 3630 Creekview Cir, recently updated with fresh interior paint and partial flooring replacement for a modern feel. The kitchen features stainless steel appliances, complementing the recent interior refreshes. Outside, a functional deck provides dedicated exterior space for practical use and enjoyment. This home features modern updates and comfortable outdoor living, ready for your enjoyment.. Included 100-Day Home Warranty with buyer activation
Key facts
- Functional deck
- 0.45 acre lot
- 2 garage spots
Tags
Property features AI
Finance
- Other: Lot approximately 0.45 acre; Public records used for area measurements; Listing accepts Cash, Conventional, and VA loan
- HOA & community: No HOA
Exterior
- Parking: Attached garage with space for 2 vehicles
- Utilities: Public water; Public sewer; Electricity available
- Home design: Single family residence; House structure; One and one-half level layout; Resale condition
- Construction: Built in 1970; Brick and other construction materials; Composition roof; Finished and unfinished below-grade areas
- Exterior features: No notable lot features listed
Interior
- Kitchen: Dishwasher
- Bedrooms: 3 bedrooms (2 on main level, 1 on lower level)
- Flooring: Vinyl flooring
- Bathrooms: 2 full bathrooms and 1 half bathroom
- Heating & cooling: Central heating; Ceiling fan(s) for cooling
- Interior features: Finished basement; Foyer
- Laundry & utility: Laundry in basement
Neighborhood map
What this means for you Summary
Snapshot
- This is a 3-bed/2.5-bath single-family listed at $250k.
Deal economics
- At list price, monthly cash flow is $-311 ($-4k/yr) — negative.
- To cash-flow at today's rent, offer at most $205k (18.0% below list).
- To meet the 1% rule (rent ≥ 1% of price), the offer needs to be $179k (28.3% below list).
- Recommended offer: $179k (28.3% below list) — sets the bar for 1% rule.
Location & tenants
- Location reads: area grade D — affects rentability + tenant quality, not the cash-flow math above.
- Fulton County (suburban): math 49% / reading 53% proficiency, ranked #12 of 174 in GA (top 7%) — acceptable for families but not a draw, mixed tenant base, ~2y average lease.
- Zoned schools: Feldwood Elementary School (math 15% / reading 34%, grade F, #751 of 1,228 statewide, top 61%, 688 students, 100% FRL); Woodland Middle School (math 14% / reading 17%, grade F, #392 of 470 statewide, top 84%, 799 students, 100% FRL); Banneker High School (math 24% / reading 75%, grade D+, #28 of 424 statewide, top 7%, 1,610 students, 100% FRL) — zoned schools average 100% FRL vs 41% district-wide (59 pts higher); higher-poverty schools than district average — tighter screening recommended.
- Zoned-school proficiency averages 30% at this address vs 51% district-wide (-21 pts) — the specific schools serving this property underperform the Fulton County average; the district grade overstates school quality for this exact location.
- Market conditions: Rents flat; 651 active listings in the ZIP; 18 comparable units currently listed for rent nearby; rentals lingering (median 44d on market — plan ~5-8 weeks vacancy on turnover, expect pricing pressure); 50% of comp listings sitting > 30 days — soft ceiling on asking rent; 11,565 units permitted in Fulton County in 2024 (8,159 in 5+ unit buildings).
- This rent runs 32% of the median local income ($67k/yr) — at the standard rent-burdened threshold; future hikes will face affordability resistance.
Forward outlook
- In year one you build about $27k of equity ($2k loan paydown + $25k appreciation (10.0% local appreciation)).
- Fulton County population projected at +38% by 2050 — long-run rental-demand tailwind backs the buy-and-hold thesis.
- By year 2, paydown + projected appreciation supports a ~$43k cash-out refi (75% LTV) — recoverable capital for the next deal without selling this one.
Negotiation context
- Only 14 days on market — expect competitive offers; lowballing is unlikely to land.
- 4 sale attempts since 14y ago with the ask held roughly flat each time — persistent listings suggest the price (not the market) is what's stuck; bring a comps-based counter.
- Current owner paid $29k; list at $250k implies a 761% gain — meaningful room to come down on a strong offer.
Risks & watch-outs
- Climate carrying-cost: major wind risk, 27% chance of damaging wind over 30y; extreme-heat days projected 7→18/yr by 2055 (HVAC capex compounding) — expect insurance premiums to compound above CPI over the hold.
Questions for the listing agent
- What do current leases actually rent for vs. the listed asking? Can we see a recent rent roll and the last 12 months of T-12 income?
- Built in 1970 — when were the roof, HVAC, electrical panel, plumbing, and water heater last replaced?
- Is there a deadline driving the sale (1031 exchange, divorce, estate, relocation)? That informs how much negotiation room exists.
- The area grade is low — what's the realistic commute time and amenity access for the typical tenant pool here? Any planned neighborhood developments (good or bad) we should know about?
- What's the average days-on-market for RENTAL listings here right now (not sales)? A rising rental-DOM trend means longer vacancies and softer asking-rent achievability than the comps imply.
- What's the recent tenant-quality profile in this submarket — average credit score on applications, eviction rate, late-payment / NSF rate, and stable-employment percentage? A property-management company in the area should have these aggregated.
- How much new for-sale + rental construction is in the pipeline within 1–3 miles? Heavy new supply typically softens prices + rents 12–24 months out; constrained supply supports both.
Investment metrics
- 1% rule
- 0.72% ✗
- Cap rate
- 4.80%
- Cash-on-cash
- -5.34%
- DSCR
- 0.76
- GRM
- 11.6
CMA / ARV
- ARV (on-the-fly)
- $251,125
- Comps found
- 2
Show comp detail 2 sales within ~0.75 mi
| Address | Dist | Beds/Ba | Sqft | Sold | Price | $/sf | Match |
|---|---|---|---|---|---|---|---|
| 3885 Morning Creek Dr | 0.45mi | 3/1.5 | 1,200 (-2%) | 8mo | $212,500 | $177 | 65 |
| 3895 Benchmark Dr | 0.48mi | 3/2.0 | 1,256 (+2%) | 24mo | $258,000 | $205 | 51 |
Match score weights: distance 35% · size 25% · config 20% · recency 20%. Top-matched comps best support the ARV.
Projected returns pro-forma
10.0% appreciation · 0.95% rent growth · sell at horizon
- IRR
- 19.9%
- Equity multiple
- 2.61×
- Total profit
- $112,727
- Equity at exit
- $225,220
- IRR
- 17.9%
- Equity multiple
- 5.87×
- Total profit
- $340,858
- Equity at exit
- $485,695
Cash invested: $70,000 (down + closing). Projections, not guarantees.
Landlord ↔ Tenant lean methodology
- Overall (STATE)
- 90 Strongly Landlord-Friendly
- State Georgia
- 90 Strongly Landlord-Friendly · R+3
- County
- — inherits STATE
- City
- — inherits STATE
ZIP-level market 30349
- Home prices YoY
- 4.6%
- Rents YoY
- 0.9%
- Active inventory
- 651
- Price-to-rent
- 11.6×
Monthly cashflow live
- Estimated rent
- $1,793 high interval (Pro) →
- Mortgage (P&I)
- −$1,311
- Tax est. 1.5%
- −$312 /mo · $3,750/yr
- Insurance
- −$104
- HOA
- −$0
- Vacancy / Maint / Mgmt
- −$376
- Net cashflow
- $-311
Break-even live
UW: 25.0% down · 7.5% · 30yr · 1.5% tax · 5.0% vac · 8.0% maint · 8.0% mgmt
Financing live
Cash to close
- Down payment
- $62,500
- Closing costs
- $7,500
- Reserves months
- —
- Total cash needed
- —
Loan-product check · same deal, 3 products live
Conventional
25% down · 7.5% · 30yr
- Down + closing
- —
- Monthly P&I
- —
- Monthly cashflow
- —
- DSCR
- —
- Eligible?
- —
Personal DTI + credit; lowest rate.
DSCR
20% down · 8.5% · 30yr
- Down + closing
- —
- Monthly P&I
- —
- Monthly cashflow
- —
- DSCR
- —
- Eligible?
- —
No personal income docs; deal must DSCR.
Hard money
10% down · 12.0% · 12mo
- Down + closing
- —
- Monthly P&I
- —
- Monthly cashflow
- —
- DSCR
- —
- Eligible?
- —
Short-term bridge; refi at stabilization.
Rent comps 18 comps
| Address | Beds | Baths | Sqft | Rent | $/sqft | DOM | Units | Dist |
|---|---|---|---|---|---|---|---|---|
| 3650 Creekview Cir Atlanta, GA | 3.0 | 3.5 | 1225 | $1,689 | $1.38 | 12d | 1 | 0.06mi |
| 3715 Clearwater Dr Atlanta, GA | 4.0 | 2.0 | 1482 | $4,400 | $2.97 | 43d | 1 | 0.11mi |
| 3695 Morning Creek Dr Atlanta, GA | 3.0 | 2.0 | 1491 | $2,100 | $1.41 | 43d | 1 | 0.24mi |
| 5825 Vernier Dr Atlanta, GA | 3.0 | 2.0 | 1346 | $1,615 | $1.20 | 24d | 1 | 0.30mi |
| 5825 Vernier Dr Atlanta, GA | 3.0 | 2.0 | 1346 | $1,615 | $1.20 | 43d | 1 | 0.30mi |
| 5825 Vernier Dr Atlanta, GA | 3.0 | 2.0 | 1346 | $1,615 | $1.20 | 5d | 1 | 0.30mi |
| 5825 Vernier Dr Atlanta, GA | 3.0 | 2.0 | 1346 | $1,615 | $1.20 | 20d | 1 | 0.30mi |
| 3550 Morning Creek Dr Atlanta, GA | 4.0 | 2.0 | 1400 | $1,730 | $1.24 | 12d | 1 | 0.34mi |
| 3865 Morning Creek Dr Atlanta, GA | 3.0 | 2.0 | 1134 | $1,675 | $1.48 | 43d | 1 | 0.40mi |
| 5740 Buffington Rd Atlanta, GA | 1.0–3.0 | 1.0–2.5 | 964 | $2,149 | $2.23 | 3d | 16 | 0.64mi |
| 5750 Buffington Rd Atlanta, GA | 1.0–3.0 | 1.0–2.0 | 1142 | $1,702 | $1.49 | 1d | 19 | 0.76mi |
| 5850 Old Bill Cook Rd Atlanta, GA | 2.0 | 1.0 | 768 | $1,450 | $1.89 | 43d | 1 | 1.08mi |
| 5100 Welcome All Rd SW Atlanta, GA | 1.0–3.0 | 1.0–2.5 | 1057 | $1,600 | $1.51 | 5d | 5 | 1.26mi |
| 4900 Delano Rd Atlanta, GA | 1.0–3.0 | 1.0 | 915 | $1,590 | $1.74 | 43d | 7 | 1.37mi |
| 4128 Flat Trl Union City, GA | 3.0 | 2.5 | 1450 | $1,700 | $1.17 | 43d | 1 | 1.38mi |
| 2890 Jerome Rd Atlanta, GA | 3.0 | 1.5 | 1229 | $1,761 | $1.43 | 43d | 1 | 1.44mi |
| 6230 Cedar Wood Dr Atlanta, GA | 3.0 | 2.0 | 1238 | $1,694 | $1.37 | 43d | 1 | 1.47mi |
| 5712 Westhill Cir Atlanta, GA | 4.0 | 2.0 | 1441 | $1,710 | $1.19 | 3d | 1 | 1.48mi |
Listing history 11 events
-
2026-06-18days on market $250,000 Active 14 DOM
-
2026-06-17days on market $250,000 Active 13 DOM
-
2026-06-16days on market $250,000 Active 12 DOM
-
2026-06-15days on market $250,000 Active 11 DOM
-
2026-06-13days on market $250,000 Active 9 DOM
-
2026-06-10remarks 494-char remark
-
2026-06-09days on market $250,000 Active 5 DOM
-
2026-06-08days on market $250,000 Active 4 DOM
-
2026-06-07statusdays on market $250,000 Active 3 DOM
-
2026-06-04remarks 459-char remark
Show marketing remark (458 chars)
Check out 3630 Creekview Cir, recently updated with fresh interior paint and partial flooring replacement for a modern feel. The kitchen features stainless steel appliances, complementing the recent interior refreshes. Outside, a functional deck provides dedicated exterior space for practical use and enjoyment. This home features modern updates and comfortable outdoor living, ready for your enjoyment.. Included 100-Day Home Warranty with buyer activation
-
2026-06-04$250,000 New 1 DOM
Show marketing remark (458 chars)
Check out 3630 Creekview Cir, recently updated with fresh interior paint and partial flooring replacement for a modern feel. The kitchen features stainless steel appliances, complementing the recent interior refreshes. Outside, a functional deck provides dedicated exterior space for practical use and enjoyment. This home features modern updates and comfortable outdoor living, ready for your enjoyment.. Included 100-Day Home Warranty with buyer activation
ⓘ Source: listings_history table (triggers on properties + properties_extension) + one-shot
backfill from property_details.listing_events for pre-trigger history.
Climate risk First Street
- Flood 1/10 Low FEMA zone X (unshaded) · 0% chance over 30 yrs
- Wildfire 3/10 Moderate
- Heat 5/10 Major 7 d/yr ≥105°F today · 18 d/yr by 30 yrs out
- Wind 6/10 Major 27% chance of damaging wind over 30 yrs
- Air quality 4/10 Moderate 4 unhealthy d/yr today · 6 by 30 yrs out
Nearby sold comps map
Loading sold comps map…
Walkable amenities ~0.75 mi
Loading nearby amenities…
Taxation est. · year 1
- Rental income
- $21,513
- − Mortgage interest
- −$14,004
- − Property taxes
- −$3,750
- − Insurance
- −$1,250
- − Repairs & maintenance
- −$1,721
- − Management
- −$1,721
- − Depreciation
- −$7,273
- Taxable loss
- −$8,205
- Est. tax savings @ 24.0%
- +$1,969
- After-tax cash flow
- $-1,767/yr
For passive investors: Depreciation is non-cash, so a rental often shows a tax loss while cash-flowing — sheltering income. Rental losses are passive: they offset passive income freely, and up to $25,000/yr can offset ordinary (W-2) income if you actively participate and your MAGI is under $100k (phasing out to $0 by $150k); unused losses carry forward. On sale, claimed depreciation is recaptured at up to 25%, and gains may owe capital-gains tax (a 1031 exchange can defer both). Figures are a year-1 estimate at your 24.0% rate — not tax advice; consult a CPA.
Schools (NCES district)
- District
- Fulton County
- NCES district ID
- 1302280
- Math proficiency
- 49% ▼ -2.00%
- Reading proficiency
- 53% ▬ 0.00%
- Median HH income
- $68,035
- Composite
- 45.33/100
- National rank
- #2640
- State rank
- #12 of 174 in GA
Livability — South Fulton
No livability data for this city. (Only ~50 U.S. cities are tracked.)
Census & demographics
- Census place
- South Fulton, GA
- County
- Fulton County · 1,094,430 people
- City population
- 127,674
- Metro
- Atlanta-Sandy Springs-Alpharetta, GA
- Population (ZIP)
- 79,872
- Household income
- $67,023
- Rent vs Own
- Severe rent burden
- 4258.0
Population outlook (Fulton County) Hauer SSP2
- Today (2025)
- 1,203,707 people
- By 2030
- 1,299,706 · +8.0%
- By 2040
- 1,488,256 · +23.6%
- By 2050
- 1,664,580 · +38.3%
- By 2075
- 2,036,072 · +69.2%
- By 2100
- 2,222,402 · +84.6%
Race, ethnicity, and origin ACS 2023
- Neighborhood character
- Predominantly Black (89%)
- Race & ethnicity
- Black 89% Hispanic / Latino 5% Two or more races 4% White 3%
- Foreign-born
- 9% · Canada
- Languages at home
- 88% English-only · Spanish 6% French/Haitian/Cajun 1%
Political lean MEDSL · Fulton
- 2024 margin
- Solid D (+44.9) · D 71.9% · R 27.0% · Other 1.1%
- 2008→2024 swing
- +9.8pp toward D · 2008: 35.0pp · 2024: 44.9pp
- All cycles
- 2024: D+44.9 2020: D+46.4 2016: D+42.1 2012: D+29.6 2008: D+35.0
Not yet ingested
- Civics
- —
Market trends
- HPI YoY
- ▲ 18.01%
- Current HPI
- 407.99
- Rent YoY
- ▲ 0.95%
- Metro
- Atlanta-Sandy Springs-Alpharetta, GA
- State GDP YoY
- ▲ 2.66%
- F500 in state
- 28
Industry mix (Fortune 500 HQ in GA)
| Industry | F500 HQs | Revenue |
|---|---|---|
| Paper / Packaging | 2 | $29B |
|
||
| Retail | 1 | $160B |
|
||
| Transportation / Logistics | 1 | $91B |
|
||
| Airlines | 1 | $62B |
|
||
| Consumer Goods | 1 | $47B |
|
||
| Utilities | 1 | $25B |
|
||
Price history
+598.9% since first listed13 events — show timeline
- 2026-06-04 Listed $250,000 FMLS
- 2026-06-03 Listed $250,000 GAMLS
- 2026-04-13 Listing Removed — GAMLS
- 2025-11-18 Listed $300,000 GAMLS
- 2014-10-30 Price Changed $29,050 GAMLS
- 2012-08-31 Sold (MLS) $29,050 GAMLS
- 2012-08-23 Listing Removed — GAMLS
- 2012-08-23 Price Changed $29,900 GAMLS
- 2012-08-21 Contingent — GAMLS
- 2012-08-03 Listed $29,900 GAMLS
- 2003-11-04 Sold (Public Records) $119,000 Public Records
- 1977-06-13 Sold (Public Records) $35,772 Public Records
- 1977-05-01 Sold (Public Records) $35,773 Public Records
Property tax history
-26.6%/yrLatest (2014): $156 · -18.0% YoY. Source: county tax records.
Cash-flow waterfall
monthlySold comps — $/sqft
last 12 mo · ≤1 miLoading sold comps…