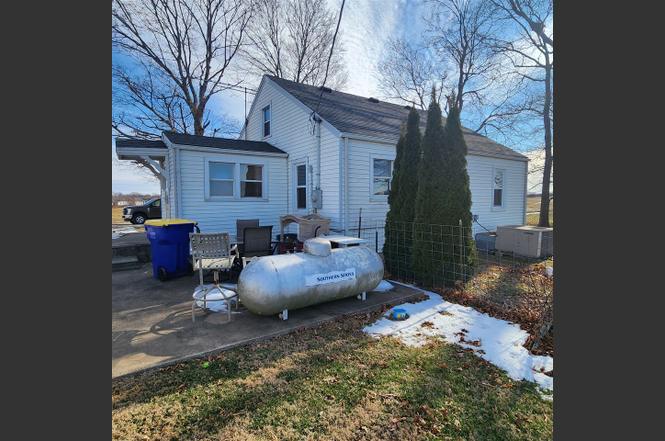
1714 Witt Rd · Franklin, KY
Flood risk 1/10 · Minimal
- FEMA flood zone
- X (unshaded)
- Chance of flooding over 30 yrs
- 0.0%
- Est. flood insurance / yr
- $507 – $1,088
Fire risk 1/10 · Minimal
- Est. fire insurance / yr
- $839 – $1,559
Heat risk 5/10 · Moderate
- Hot days now (above 106°F)
- 7 days/yr
- Hot days in 30 yrs
- 19 days/yr
Wind risk 4/10 · Minor
- Chance of severe wind over 30 yrs
- 10.0%
Air-quality risk 2/10 · Minimal
- Unhealthy air days now
- 0 days/yr
- Unhealthy air days in 30 yrs
- 1 days/yr
Risk factors via First Street. Map © Google.
Why this score? — see what drove the B grade
The composite is a weighted blend of 9 inputs, each scored 0–100. Each bar is that input's sub-score; the figure is the points it added to the 100-point composite (weight × sub-score).
- Cash flow +30.0/30.0
- ARV discount +15.0/15.0
- DSCR +10.0/10.0
- 1% rule +7.3/10.0
- Livability +3.2/5.0
- Schools +2.9/10.0
- Rent growth +2.5/5.0
- Condition / age +2.5/5.0
- Appreciation +0.0/10.0
$145,000
🖨 Deal sheet (PDF) 📄 Offer letter ✓ Due diligence
Listing remarks
Country feel close to town, shopping & medical facilities. 2 bedroom house one bath with a nice one acre lot. would make a great starter home or rental property. It won't last long at this price.
Key facts
- One acre lot
- 1.04 acre lot
- Garage
Tags
Neighborhood map
What this means for you Summary
Snapshot
- This is a 3-bed/1.0-bath single-family listed at $145k.
Deal economics
- At list price, monthly cash flow is $551 ($7k/yr) — positive.
- The deal already cash-flows at list — no discount required.
- Meets the 1% rule at list price ($2k rent vs $145k).
- Recommended offer: $141k (3.0% below list) — sets the bar for market timing.
- Cap rate 10.9% vs local median 3.9% in Franklin — top-decile yield for the area; either an underpriced asset or a hidden risk that comps aren't pricing in. Stress-test before assuming the spread holds.
Location & tenants
- Location reads 65/100 on livability (#266 in KY) — a middle-class / working-renter tenant base. Strengths: cost of living A+, housing A+, crime A; Watch: amenities F, commute F, employment F.
- Simpson County (town): math 29% / reading 39% proficiency, ranked #72 of 165 in KY (top 44%) — families likely to look elsewhere, expect single-tenant / working-renter base with shorter leases.
- Zoned schools: Simpson Elementary School (math 26% / reading 27%, grade F, #469 of 676 statewide, top 70%, 726 students, 69% FRL); Franklin-Simpson Middle School (math 29% / reading 39%, grade F, #103 of 217 statewide, top 48%, 687 students, 69% FRL); Franklin-Simpson High School (math 27% / reading 42%, grade F, #76 of 254 statewide, top 34%, 817 students, 63% FRL) — zoned schools average 67% FRL vs 52% district-wide (15 pts higher); higher-poverty schools than district average — tighter screening recommended.
- Market conditions: 282 active listings in the ZIP; 5 comparable units currently listed for rent nearby; rentals at typical pace (median 24d on market — plan ~3-4 weeks tenant-placement turnaround); 40% of comp listings sitting > 30 days — soft ceiling on asking rent; 204 units permitted in Simpson County in 2024 (31 in 5+ unit buildings).
Forward outlook
- Local home prices are declining (-3.0%/yr); year-one equity from $1k of loan paydown is wiped out by about $4k of value loss. Plan a longer hold.
- Simpson County population projected at +12% by 2050 — modest demand growth; plan on rents tracking national, not racing it.
- At projected returns (-3.0% appreciation + 3.0% rent growth), your $41k cash investment doubles in ~8 years — after that, you're playing with house money.
Negotiation context
- It's been on market 55 days — a 3% lower offer ($141k) is reasonable based on typical stale-listing flexibility.
- 2 sale attempts; this cycle's ask has dropped $25k (15%) from the opening price — seller is motivated, your offer sets the floor, not the list.
- Current owner paid $32k; list at $145k implies a 356% gain — meaningful room to come down on a strong offer.
Risks & watch-outs
- Watch-outs: built in 1950 — expect roof / HVAC / electrical / plumbing capex.
- Climate carrying-cost: extreme-heat days projected 7→19/yr by 2055 (HVAC capex compounding) — expect insurance premiums to compound above CPI over the hold.
Questions for the listing agent
- It's been on market 55 days. Have you received any prior offers? Is the seller open to a 3% concession, seller financing, or rate buy-down credit?
- Built in 1950 — when were the roof, HVAC, electrical panel, plumbing, and water heater last replaced?
- Is there a deadline driving the sale (1031 exchange, divorce, estate, relocation)? That informs how much negotiation room exists.
- Schools are F-rated, which usually means shorter tenancies and higher turnover. Who's the typical renter profile here, and what's been the actual vacancy rate?
- What's the average days-on-market for RENTAL listings here right now (not sales)? A rising rental-DOM trend means longer vacancies and softer asking-rent achievability than the comps imply.
- What's the recent tenant-quality profile in this submarket — average credit score on applications, eviction rate, late-payment / NSF rate, and stable-employment percentage? A property-management company in the area should have these aggregated.
- How much new for-sale + rental construction is in the pipeline within 1–3 miles? Heavy new supply typically softens prices + rents 12–24 months out; constrained supply supports both.
Investment metrics
- 1% rule
- 1.23% ✓
- Cap rate
- 10.85%
- Cash-on-cash
- 16.29%
- DSCR
- 1.72
- GRM
- 6.8
CMA / ARV
- ARV (median comp)
- $236,327
- List price
- $145,000
- Delta
- -38.64%
- Verdict
- UNDERPRICED
- Comps
- 4 within 1.0 mi
Projected returns pro-forma
-3.0% appreciation · 3.0% rent growth · sell at horizon
- IRR
- 7.3%
- Equity multiple
- 1.28×
- Total profit
- $11,551
- Equity at exit
- $21,620
- IRR
- 16.6%
- Equity multiple
- 2.36×
- Total profit
- $55,017
- Equity at exit
- $12,537
Cash invested: $40,600 (down + closing). Projections, not guarantees.
Landlord ↔ Tenant lean methodology
- Overall (STATE)
- 83 Strongly Landlord-Friendly
- State Kentucky
- 83 Strongly Landlord-Friendly · R+16
- County
- — inherits STATE
- City
- — inherits STATE
ZIP-level market 42134
- Home prices YoY
- -27.7%
- Active inventory
- 282
- Price-to-rent
- 6.8×
Monthly cashflow live
- Estimated rent
- $1,785 high interval (Pro) →
- Mortgage (P&I)
- −$760
- Tax from tax record
- −$38 /mo · $456/yr
- Insurance
- −$60
- HOA
- −$0
- Lot rent
- −$0
- Vacancy / Maint / Mgmt
- −$375
- Net cashflow
- $551
Break-even live
Sensitivity live
| Price | -10% $633 | -5% $592 | +0% $551 | +5% $510 | +10% $469 |
|---|---|---|---|---|---|
| Rent | -10% $410 | -5% $481 | +0% $551 | +5% $622 | +10% $692 |
| Rate | -1.0pp $624 | -0.5pp $588 | base $551 | +0.5pp $514 | +1.0pp $475 |
UW: 25.0% down · 7.5% · 30yr · 1.5% tax · 5.0% vac · 8.0% maint · 8.0% mgmt
Financing live
Cash to close
- Down payment
- $36,250
- Closing costs
- $4,350
- Reserves months
- —
- Total cash needed
- —
Loan-product check · same deal, 3 products live
Conventional
25% down · 7.5% · 30yr
- Down + closing
- —
- Monthly P&I
- —
- Monthly cashflow
- —
- DSCR
- —
- Eligible?
- —
Personal DTI + credit; lowest rate.
DSCR
20% down · 8.5% · 30yr
- Down + closing
- —
- Monthly P&I
- —
- Monthly cashflow
- —
- DSCR
- —
- Eligible?
- —
No personal income docs; deal must DSCR.
Hard money
10% down · 12.0% · 12mo
- Down + closing
- —
- Monthly P&I
- —
- Monthly cashflow
- —
- DSCR
- —
- Eligible?
- —
Short-term bridge; refi at stabilization.
Rent comps 5 comps
| Address | Beds | Baths | Sqft | Rent | $/sqft | DOM | Units | Dist |
|---|---|---|---|---|---|---|---|---|
| 716 Calumet Cir Franklin, KY | 3.0 | 2.0 | 1400 | $1,900 | $1.36 | 13d | 1 | 0.20mi |
| 714 Calumet Cir Franklin, KY | 3.0 | 2.0 | 1400 | $1,900 | $1.36 | 46d | 1 | 0.22mi |
| 1030 Brookview Dr Unit 21C Franklin, KY | 2.0 | 1.0 | 976 | $950 | $0.97 | 46d | 1 | 0.73mi |
| 1248 Derek Dr Franklin, KY | 3.0 | 2.0 | 1200 | $1,650 | $1.38 | 15d | 1 | 1.40mi |
| 1248 Derek Dr Franklin, KY | 3.0 | 2.0 | 1200 | $1,650 | $1.38 | 23d | 1 | 1.40mi |
Listing history 17 events
-
2026-06-23days on market $145,000 Active Under Contract 55 DOM
-
2026-06-21statusdays on market $145,000 Active Under Contract 54 DOM
-
2026-06-19days on market $145,000 Active 52 DOM
-
2026-06-18days on market $145,000 Active 51 DOM
-
2026-06-17days on market $145,000 Active 50 DOM
-
2026-06-16days on market $145,000 Active 49 DOM
-
2026-06-15days on market $145,000 Active 48 DOM
-
2026-06-14days on market $145,000 Active 46 DOM
-
2026-06-13days on market $145,000 Active 45 DOM
-
2026-06-10days on market $145,000 Active 43 DOM
-
2026-06-09days on market $145,000 Active 42 DOM
-
2026-06-09pricestatusdays on market $145,000 Active 41 DOM
-
2026-04-20status Active
-
2026-03-23historical Active Under Contract
-
2026-02-09$170,000 Active
-
2010-02-17soldstatus $31,800
-
2006-11-22soldstatus $63,000
ⓘ Source: listings_history table (triggers on properties + properties_extension) + one-shot
backfill from property_details.listing_events for pre-trigger history.
Tax reassessment forecast KY · Resets to sale price
- Current annual tax
- $456 · $38/mo
- Projected year-2 tax
- $1,247 · $104/mo
- Expected delta
- +$791/yr (+$66/mo · 173.3%)
ⓘ Screening estimate from a state-policy table — verify with the county assessor before closing.
Climate risk First Street
- Flood 1/10 Low FEMA zone X (unshaded) · 0% chance over 30 yrs
- Wildfire 1/10 Low
- Heat 5/10 Major 7 d/yr ≥106°F today · 19 d/yr by 30 yrs out
- Wind 4/10 Moderate 10% chance of damaging wind over 30 yrs
- Air quality 2/10 Low 0 unhealthy d/yr today · 1 by 30 yrs out
Nearby sold comps map
Loading sold comps map…
Walkable amenities ~0.75 mi
Loading nearby amenities…
Taxation est. · year 1
- Rental income
- $21,419
- − Mortgage interest
- −$8,122
- − Property taxes
- −$456
- − Insurance
- −$725
- − Repairs & maintenance
- −$1,713
- − Management
- −$1,713
- − Depreciation
- −$4,218
- Taxable income
- $4,470
- Est. tax owed @ 24.0%
- −$1,073
- After-tax cash flow
- $5,542/yr
For passive investors: Depreciation is non-cash, so a rental often shows a tax loss while cash-flowing — sheltering income. Rental losses are passive: they offset passive income freely, and up to $25,000/yr can offset ordinary (W-2) income if you actively participate and your MAGI is under $100k (phasing out to $0 by $150k); unused losses carry forward. On sale, claimed depreciation is recaptured at up to 25%, and gains may owe capital-gains tax (a 1031 exchange can defer both). Figures are a year-1 estimate at your 24.0% rate — not tax advice; consult a CPA.
Schools (NCES district)
- District
- Simpson County
- NCES district ID
- 2105400
- Math proficiency
- 29% ▼ -18.00%
- Reading proficiency
- 39% ▼ -16.00%
- Median HH income
- $41,691
- Composite
- 28.69/100
- National rank
- #6692
- State rank
- #72 of 165 in KY
Livability — Franklin
- Score
- 65/100
- State rank
- #266
- US rank
- #13010
Category grades
Schools grade is shown separately in the Schools card above.
Census & demographics
- County
- Simpson County · 19,380 people
- City population
- 19,380
- Metro
- nan
- Population (ZIP)
- 19,380
- Household income
- $59,113
- Rent vs Own
- Severe rent burden
- 576.0
Population outlook (Simpson County) Hauer SSP2
- Today (2025)
- 19,331 people
- By 2030
- 19,921 · +3.1%
- By 2040
- 20,975 · +8.5%
- By 2050
- 21,736 · +12.4%
- By 2075
- 23,536 · +21.8%
- By 2100
- 23,054 · +19.3%
Race, ethnicity, and origin ACS 2023
- Neighborhood character
- Predominantly White (85%)
- Race & ethnicity
- White 85% Black 7% Two or more races 6% Hispanic / Latino 3%
- Common ancestry
- Slovak 4% Italian 1% Lithuanian 1%
- Foreign-born
- 1% · Canada
- Languages at home
- 98% English-only · Spanish 1%
Political lean MEDSL · Simpson
- 2024 margin
- Solid R (+43.9) · D 27.4% · R 71.2% · Other 1.4%
- 2008→2024 swing
- -21.1pp toward R · 2008: -22.7pp · 2024: -43.9pp
- All cycles
- 2024: R+43.9 2020: R+36.7 2016: R+39.0 2012: R+24.1 2008: R+22.7
Not yet ingested
- Civics
- —
Market trends
- HPI YoY
- ▼ -84.92%
- Current HPI
- 221.6725
- Rent YoY
- —
- Metro
- nan
- State GDP YoY
- ▲ 1.81%
- F500 in state
- 4
Industry mix (Fortune 500 HQ in KY)
| Industry | F500 HQs | Revenue |
|---|---|---|
| Healthcare | 1 | $118B |
|
||
| Food / Beverage | 1 | $7B |
|
||
Price history
+169.8% since first listed5 events — show timeline
- 2026-04-20 Relisted — RASKMLS
- 2026-03-23 Contingent — RASKMLS
- 2026-02-09 Listed $170,000 RASKMLS
- 2010-02-17 Sold (Public Records) $31,800 Public Records
- 2006-11-22 Sold (Public Records) $63,000 Public Records
Property tax history
+2.7%/yrLatest (2025): $456 · -0.8% YoY. Source: county tax records.
Cash-flow waterfall
monthlySold comps — $/sqft
last 12 mo · ≤1 miLoading sold comps…