 🌊 Lakefront
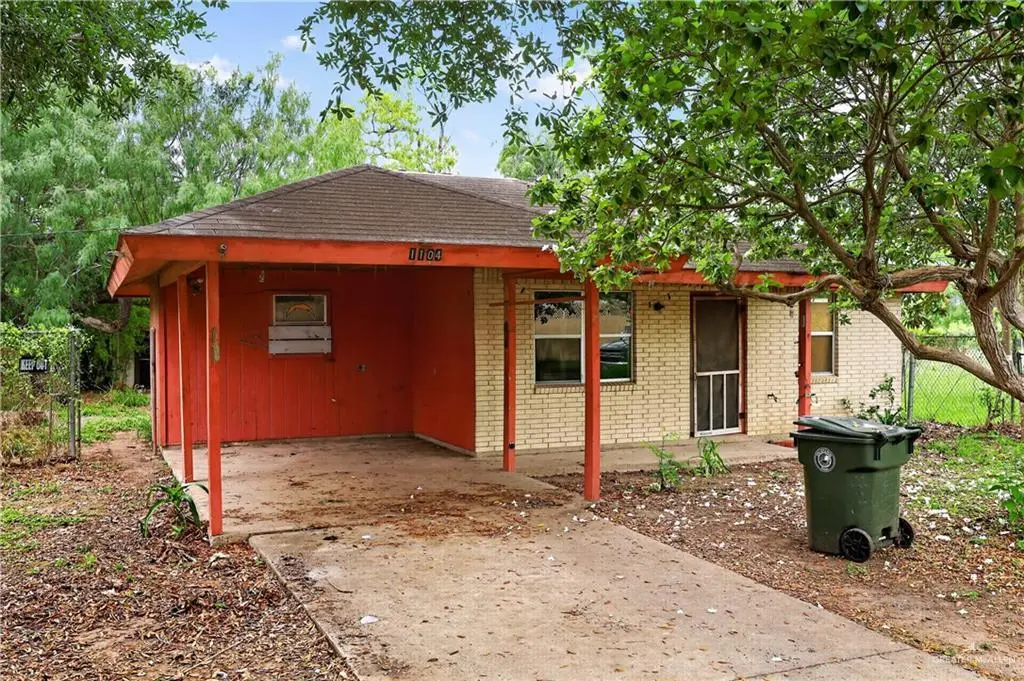
1104 S Chelo Dr · La Feria, TX
Flood risk 6/10 · Moderate
- FEMA flood zone
- X (unshaded)
- Chance of flooding over 30 yrs
- 0.74%
- Est. flood insurance / yr
- $507 – $1,088
Fire risk 2/10 · Minimal
- Est. fire insurance / yr
- $1,222 – $2,270
Heat risk 9/10 · Severe
- Hot days now (above 111°F)
- 7 days/yr
- Hot days in 30 yrs
- 22 days/yr
Wind risk 8/10 · Major
- Chance of severe wind over 30 yrs
- 99.0%
Air-quality risk 1/10 · Minimal
- Unhealthy air days now
- 0 days/yr
- Unhealthy air days in 30 yrs
- 0 days/yr
Risk factors via First Street. Map © Google.
Why this score? — see what drove the D+ grade
The composite is a weighted blend of 9 inputs, each scored 0–100. Each bar is that input's sub-score; the figure is the points it added to the 100-point composite (weight × sub-score).
- Cash flow +17.1/30.0
- ARV discount +7.5/15.0
- 1% rule +7.1/10.0
- DSCR +5.3/10.0
- Livability +3.2/5.0
- Rent growth +2.5/5.0
- Schools +2.5/10.0
- Condition / age +2.5/5.0
- Appreciation +0.0/10.0
$84,000
🖨 Deal sheet (PDF) 📄 Offer letter ✓ Due diligence
Listing remarks
Fixer-upper opportunity with great potential! This home offers 936 sq ft of living space and sits on a spacious 12,800 sq ft irregular cul-de-sac corner lot. Built in 1987, the property is conveniently located near Noemi Dominguez Elementary School and just minutes from West Expressway 83, providing easy access to nearby amenities and commuting routes. Property is being sold AS-IS. Cash or conventional financing only.
Key facts
- 0.29 acre lot
- Garage
- Built 1987
Property features AI
Finance
- Other: Living area reported by Cameron CAD
- HOA & community: No homeowners association
Exterior
- Parking: 1 total parking space; 1 covered space; 1 carport space; Attached parking with garage facing front
- Utilities: Public water; City sewer; Electric service
- Home design: Brick construction; Slab foundation; Not new construction
- Construction: Brick exterior; Slab foundation; Composition shingle roof
- Exterior features: Mature trees; Chain link fencing; Composition shingle roof; Paved road access; Irregular lot
Interior
- Kitchen: Electric water heater; No conveying appliances
- Flooring: Laminate; Other
- Bathrooms: 1 full bathroom
- Heating & cooling: Central heating (electric); Central air conditioning (electric)
- Interior features: Laminate and other flooring; Laminate countertops; Ceiling fan(s); Window coverings (other)
- Laundry & utility: Laundry area with washer/dryer connections
Neighborhood map
What this means for you Summary
Snapshot
- This is a 3-bed/1.0-bath single-family listed at $84k.
Deal economics
- At list price, monthly cash flow is $59 ($707/yr) — positive.
- The deal already cash-flows at list — no discount required.
- Meets the 1% rule at list price ($1k rent vs $84k).
- Recommended offer: $83k (1.5% below list) — sets the bar for market timing.
- Cap rate 7.1% vs local median 4.4% in La Feria — top-decile yield for the area; either an underpriced asset or a hidden risk that comps aren't pricing in. Stress-test before assuming the spread holds.
Location & tenants
- Location reads 65/100 on livability (#667 in TX) — a middle-class / working-renter tenant base. Strengths: cost of living A+, housing A+; Watch: crime D+, amenities F, commute F.
- La Feria ISD (suburban): math 27% / reading 35% proficiency, ranked #630 of 826 in TX (top 76%) — families likely to look elsewhere, expect single-tenant / working-renter base with shorter leases.
- Zoned schools: C E Vail El (math 12% / reading 22%, grade F, #3,836 of 4,322 statewide, top 91%, 366 students, 95% FRL); W B Green J H (math 24% / reading 35%, grade F, #1,077 of 1,662 statewide, top 66%, 454 students, 85% FRL); La Feria H S (math 32% / reading 52%, grade F, #730 of 1,632 statewide, top 47%, 909 students, 85% FRL) — zoned schools average 88% FRL vs 50% district-wide (39 pts higher); higher-poverty schools than district average — tighter screening recommended.
- Market conditions: 260 active listings in the ZIP; 4 comparable units currently listed for rent nearby; rentals at typical pace (median 23d on market — plan ~3-4 weeks tenant-placement turnaround); 2,326 units permitted in Cameron County in 2024 (503 in 5+ unit buildings).
Forward outlook
- Local home prices are declining (-3.0%/yr); year-one equity from $581 of loan paydown is wiped out by about $3k of value loss. Plan a longer hold.
- Cameron County population projected at +3% by 2050 — modest demand growth; plan on rents tracking national, not racing it.
Negotiation context
- It's been on market 19 days — a 2% lower offer ($83k) is reasonable based on typical stale-listing flexibility.
Risks & watch-outs
- Watch-outs: property tax is 3.8% of price.
- Climate carrying-cost: major flood risk; severe wind risk, 99% chance of damaging wind over 30y; extreme-heat days projected 7→22/yr by 2055 (HVAC capex compounding) — expect insurance premiums to compound above CPI over the hold.
Questions for the listing agent
- Property tax is high relative to price — has the assessment been appealed recently, and will the sale trigger a re-assessment?
- Is there a deadline driving the sale (1031 exchange, divorce, estate, relocation)? That informs how much negotiation room exists.
- Crime grade is D in this area — have there been break-ins, vandalism, or insurance claims at this property in the last 3 years? What carrier currently insures it and at what premium?
- The area grade is low — what's the realistic commute time and amenity access for the typical tenant pool here? Any planned neighborhood developments (good or bad) we should know about?
- This sits on a lake — are riparian / water-frontage rights deeded with the parcel? Any dock permits, shoreline easements, or HOA water-use restrictions?
- What's the documented flood / surge / shoreline-erosion history here (FEMA AND non-FEMA — e.g., storm surge, creek backup, septic-field saturation)?
- Any water-quality or seasonal algae-bloom issues that affect tenant satisfaction or short-term-rental demand?
- What's the average days-on-market for RENTAL listings here right now (not sales)? A rising rental-DOM trend means longer vacancies and softer asking-rent achievability than the comps imply.
- What's the recent tenant-quality profile in this submarket — average credit score on applications, eviction rate, late-payment / NSF rate, and stable-employment percentage? A property-management company in the area should have these aggregated.
- How much new for-sale + rental construction is in the pipeline within 1–3 miles? Heavy new supply typically softens prices + rents 12–24 months out; constrained supply supports both.
Investment metrics
- 1% rule
- 1.21% ✓
- Cap rate
- 7.13%
- Cash-on-cash
- 3.01%
- DSCR
- 1.13
- GRM
- 6.9
CMA / ARV
- ARV (median comp)
- $201,711
- List price
- $84,000
- Delta
- -58.36%
- Verdict
- UNDERPRICED
- Comps
- 20 within 1.0 mi
Show comp detail 3 sales within ~0.75 mi
| Address | Dist | Beds/Ba | Sqft | Sold | Price | $/sf | Match |
|---|---|---|---|---|---|---|---|
| 1104 S Chelo Dr | 0.00mi | 3/1.0 | 936 (0%) | 1mo | $84,000 | $90 | 99 |
| 309 W Chelo Dr | 0.08mi | 3/2.0 | 1,040 (+11%) | 2mo | $145,000 | $139 | 72 |
| 606 Avenue B | 0.71mi | 3/1.0 | 960 (+3%) | 18mo | $129,500 | $135 | 48 |
Match score weights: distance 35% · size 25% · config 20% · recency 20%. Top-matched comps best support the ARV.
Projected returns pro-forma
-3.0% appreciation · 3.0% rent growth · sell at horizon
- IRR
- -11.4%
- Equity multiple
- 0.59×
- Total profit
- $-9,744
- Equity at exit
- $12,525
- IRR
- -2.0%
- Equity multiple
- 0.86×
- Total profit
- $-3,185
- Equity at exit
- $7,263
Cash invested: $23,520 (down + closing). Projections, not guarantees.
Landlord ↔ Tenant lean methodology
- Overall (STATE)
- 87 Strongly Landlord-Friendly
- State Texas
- 87 Strongly Landlord-Friendly · R+5
- County
- — inherits STATE
- City
- — inherits STATE
ZIP-level market 78559
- Home prices YoY
- -6.1%
- Active inventory
- 260
- Price-to-rent
- 6.9×
Monthly cashflow live
- Estimated rent
- $1,016 medium interval (Pro) →
- Mortgage (P&I)
- −$441
- Tax from tax record
- −$268 /mo · $3,216/yr
- Insurance
- −$35
- HOA
- −$0
- Vacancy / Maint / Mgmt
- −$213
- Net cashflow
- $59
Break-even live
Sensitivity live
| Price | -10% $106 | -5% $83 | +0% $59 | +5% $35 | +10% $11 |
|---|---|---|---|---|---|
| Rent | -10% $-21 | -5% $19 | +0% $59 | +5% $99 | +10% $139 |
| Rate | -1.0pp $101 | -0.5pp $80 | base $59 | +0.5pp $37 | +1.0pp $15 |
UW: 25.0% down · 7.5% · 30yr · 1.5% tax · 5.0% vac · 8.0% maint · 8.0% mgmt
Financing live
Cash to close
- Down payment
- $21,000
- Closing costs
- $2,520
- Reserves months
- —
- Total cash needed
- —
Loan-product check · same deal, 3 products live
Conventional
25% down · 7.5% · 30yr
- Down + closing
- —
- Monthly P&I
- —
- Monthly cashflow
- —
- DSCR
- —
- Eligible?
- —
Personal DTI + credit; lowest rate.
DSCR
20% down · 8.5% · 30yr
- Down + closing
- —
- Monthly P&I
- —
- Monthly cashflow
- —
- DSCR
- —
- Eligible?
- —
No personal income docs; deal must DSCR.
Hard money
10% down · 12.0% · 12mo
- Down + closing
- —
- Monthly P&I
- —
- Monthly cashflow
- —
- DSCR
- —
- Eligible?
- —
Short-term bridge; refi at stabilization.
Rent comps 4 comps
| Address | Beds | Baths | Sqft | Rent | $/sqft | DOM | Units | Dist |
|---|---|---|---|---|---|---|---|---|
| 508 6th St Unit A La Feria, TX | 2.0 | 2.0 | 926 | $1,000 | $1.08 | 22d | 1 | 0.93mi |
| 405 Lion's Villa Ave Unit 15 La Feria, TX | 2.0 | 1.5 | 992 | $999 | $1.01 | 15d | 1 | 1.34mi |
| 200 Cub Cir La Feria, TX | 2.0 | 1.5 | 966 | $1,024 | $1.06 | 15d | 1 | 1.46mi |
| 300 Cub Cir Unit 2 La Feria, TX | 2.0 | 1.5 | 966 | $1,050 | $1.09 | 45d | 1 | 1.47mi |
Listing history 2 events
-
2026-05-12price $84,000 421-char remark
-
2026-05-01$89,000 Active 421-char remark
ⓘ Source: listings_history table (triggers on properties + properties_extension) + one-shot
backfill from property_details.listing_events for pre-trigger history.
Tax reassessment forecast TX · Resets to sale price
- Current annual tax
- $3,216 · $268/mo
- Projected year-2 tax
- $3,216 · $268/mo
- Expected delta
- $0/yr ($0/mo · 0.0%)
ⓘ Screening estimate from a state-policy table — verify with the county assessor before closing.
Climate risk First Street
- Flood 6/10 Major FEMA zone X (unshaded) · 74% chance over 30 yrs
- Wildfire 2/10 Low
- Heat 9/10 Extreme 7 d/yr ≥111°F today · 22 d/yr by 30 yrs out
- Wind 8/10 Severe 99% chance of damaging wind over 30 yrs
- Air quality 1/10 Low 0 unhealthy d/yr today · 0 by 30 yrs out
Nearby sold comps map
Loading sold comps map…
Walkable amenities ~0.75 mi
Loading nearby amenities…
Taxation est. · year 1
- Rental income
- $12,189
- − Mortgage interest
- −$4,705
- − Property taxes
- −$3,216
- − Insurance
- −$420
- − Repairs & maintenance
- −$975
- − Management
- −$975
- − Depreciation
- −$2,444
- Taxable loss
- −$547
- Est. tax savings @ 24.0%
- +$131
- After-tax cash flow
- $838/yr
For passive investors: Depreciation is non-cash, so a rental often shows a tax loss while cash-flowing — sheltering income. Rental losses are passive: they offset passive income freely, and up to $25,000/yr can offset ordinary (W-2) income if you actively participate and your MAGI is under $100k (phasing out to $0 by $150k); unused losses carry forward. On sale, claimed depreciation is recaptured at up to 25%, and gains may owe capital-gains tax (a 1031 exchange can defer both). Figures are a year-1 estimate at your 24.0% rate — not tax advice; consult a CPA.
Schools (NCES district)
- District
- La Feria ISD
- NCES district ID
- 4826040
- Math proficiency
- 27% ▼ -25.00%
- Reading proficiency
- 35% ▼ -4.00%
- Median HH income
- $33,306
- Composite
- 25.41/100
- National rank
- #7460
- State rank
- #630 of 826 in TX
Livability — La Feria
- Score
- 65/100
- State rank
- #667
- US rank
- #12330
Category grades
Schools grade is shown separately in the Schools card above.
Census & demographics
- Census place
- La Feria, TX
- Population (ZIP)
- 12,752
Population outlook (Cameron County) Hauer SSP2
- Today (2025)
- 441,603 people
- By 2030
- 448,113 · +1.5%
- By 2040
- 456,385 · +3.3%
- By 2050
- 456,294 · +3.3%
- By 2075
- 423,851 · -4.0%
- By 2100
- 342,787 · -22.4%
Race, ethnicity, and origin ACS 2023
- Neighborhood character
- Predominantly Hispanic (91%)
- Race & ethnicity
- Hispanic / Latino 91% Two or more races 35% White 8%
- Hispanic origin (detail)
- Mexican 87%
- Common ancestry
- Slovak 1% Lithuanian 1%
- Foreign-born
- 17% · Canada
- Languages at home
- 40% English-only · Spanish 60%
Political lean MEDSL · Cameron
- 2024 margin
- Lean R (+5.8) · D 46.7% · R 52.5%
- 2008→2024 swing
- -34.6pp toward R · 2008: 28.8pp · 2024: -5.8pp
- All cycles
- 2024: R+5.8 2020: D+13.2 2016: D+32.5 2012: D+32.4 2008: D+28.8
Not yet ingested
- Civics
- —
Market trends
- HPI YoY
- ▼ -12.21%
- Current HPI
- 187.8512
- Rent YoY
- —
- Metro
- —
- State GDP YoY
- ▲ 3.95%
- F500 in state
- 110
Industry mix (Fortune 500 HQ in TX)
| Industry | F500 HQs | Revenue |
|---|---|---|
| Energy | 16 | $1,198B |
|
||
| Technology | 5 | $198B |
|
||
| Engineering / Construction | 4 | $72B |
|
||
| Energy Services | 3 | $60B |
|
||
| Utilities | 3 | $41B |
|
||
| Healthcare | 2 | $330B |
|
||
Price history
-5.6% since first listed4 events — show timeline
- 2026-06-01 Sold (MLS) — MCALLENMLS
- 2026-05-20 Pending — MCALLENMLS
- 2026-05-12 Price Changed $84,000 MCALLENMLS
- 2026-05-01 Listed $89,000 MCALLENMLS
Property tax history
+6.6%/yrLatest (2025): $3,216 · +4.1% YoY. Source: county tax records.
Cash-flow waterfall
monthlySold comps — $/sqft
last 12 mo · ≤1 miLoading sold comps…