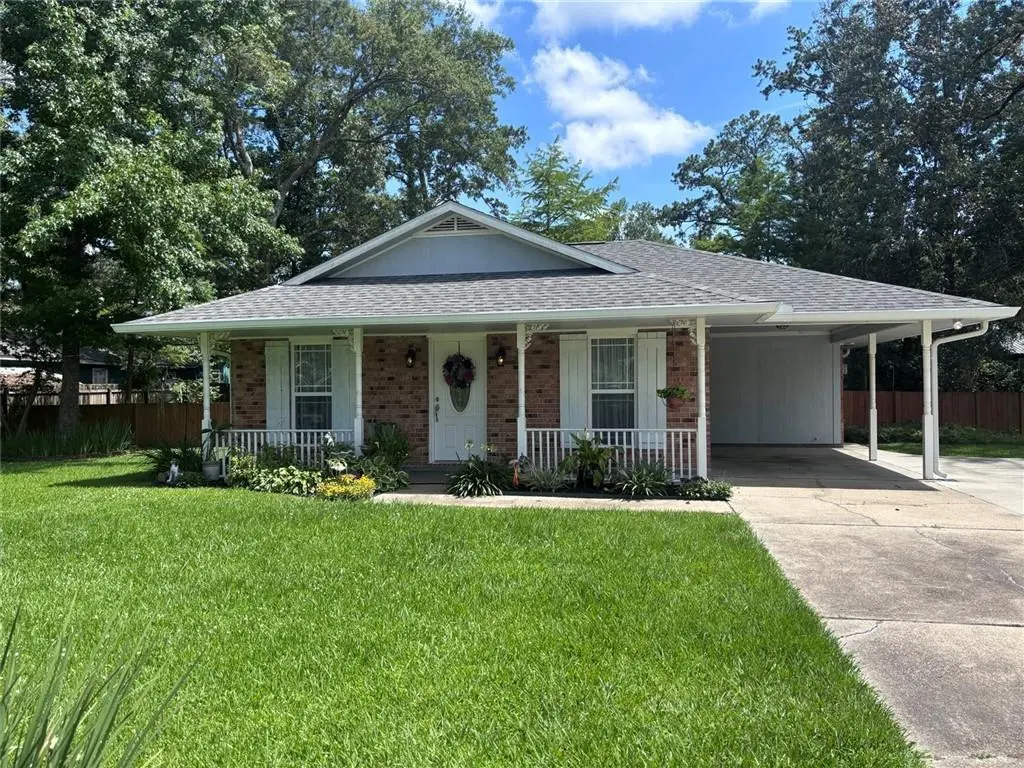
297 South St · Ponchatoula, LA
Flood risk 4/10 · Minor
- FEMA flood zone
- X (unshaded)
- Chance of flooding over 30 yrs
- 0.24%
- Est. flood insurance / yr
- $507 – $1,088
Fire risk 3/10 · Minor
- Est. fire insurance / yr
- $1,269 – $2,357
Heat risk 8/10 · Major
- Hot days now (above 109°F)
- 7 days/yr
- Hot days in 30 yrs
- 21 days/yr
Wind risk 9/10 · Severe
- Chance of severe wind over 30 yrs
- 99.0%
Air-quality risk 2/10 · Minimal
- Unhealthy air days now
- 0 days/yr
- Unhealthy air days in 30 yrs
- 1 days/yr
Risk factors via First Street. Map © Google.
Why this score? — see what drove the F grade
The composite is a weighted blend of 9 inputs, each scored 0–100. Each bar is that input's sub-score; the figure is the points it added to the 100-point composite (weight × sub-score).
- Cash flow +16.1/30.0
- DSCR +5.0/10.0
- Livability +3.4/5.0
- 1% rule +3.0/10.0
- Rent growth +2.7/5.0
- Condition / age +2.5/5.0
- Schools +2.0/10.0
- ARV discount +0.0/15.0
- Appreciation +0.0/10.0
$204,900
🖨 Deal sheet (PDF) 📄 Offer letter ✓ Due diligence
Listing remarks MLS
Don't miss this newly updated 3-bedroom home located in the heart of Ponchatoula, Louisiana--America's Strawberry Capital! This move-in-ready property offers comfort, convenience, and valuable extras that make settling in easy. The home comes complete with a refrigerator, washer, dryer, and a whole-home water filtration system, providing added value and peace of mind from day one. Located in the highly desirable Flood Zone X, this property offers an added level of confidence for homeowners. Located just blocks away from local shopping, dining, schools, and all that Ponchatoula has to offer, this home could be for first-time buyers or anyone looking for a turnkey property. Updated, well-equipped, and ideally located--this home is ready for its new owners! Schedule your private showing today!
Key facts
- Flood zone x
- 0.37 acre lot
- Parking
Tags
Property features AI
Exterior
- Parking: Carport (1 space)
- Utilities: Public water; Sewer not available
- Home design: Single-story; Brick construction; Shingle roof; Slab foundation; Rectangular city lot; Lot dimensions approximately 136 x 149 x 88 x 156; Lot about 0.37 acres
- Construction: Built with brick; Shingle roof; Slab foundation
- Exterior features: Courtyard; Fence; Porch; Pavers; Shed(s)
Interior
- Kitchen: Oven; Range; Refrigerator
- Bathrooms: 1 full bathroom
- Heating & cooling: Central heating; Central air conditioning
- Interior features: Attic; Ceiling fan(s); Carbon monoxide detector; Pull-down attic stairs
- Laundry & utility: Washer; Dryer; Washer hookup; Dryer hookup
Neighborhood map
What this means for you Summary
Snapshot
- This is a 3-bed/1.0-bath single-family listed at $205k.
Deal economics
- At list price, monthly cash flow is $103 ($1k/yr) — positive.
- The deal already cash-flows at list — no discount required.
- To meet the 1% rule (rent ≥ 1% of price), the offer needs to be $164k (19.9% below list).
- Recommended offer: $164k (19.9% below list) — sets the bar for 1% rule.
- Cap rate 6.9% vs local median 5.2% in Ponchatoula — top-decile yield for the area; either an underpriced asset or a hidden risk that comps aren't pricing in. Stress-test before assuming the spread holds.
Location & tenants
- Location reads 68/100 on livability (#91 in LA) — a middle-class / working-renter tenant base. Strengths: cost of living A+, health & safety A+, housing A-; Watch: employment D, crime D-, amenities F.
- Tangipahoa Parish (rural): math 18% / reading 29% proficiency, ranked #63 of 98 in LA (top 64%) — low school quality limits family demand, transient renter base, plan for 1-2y turnover; 73% free/reduced lunch — lower-income household profile, screen leases tightly.
- Zoned schools: Tucker Memorial Elementary School (709 students, 67% FRL); Ponchatoula Junior High School (math 18% / reading 37%, grade F, #127 of 218 statewide, top 60%, 770 students, 60% FRL); Ponchatoula High School (math 29% / reading 40%, grade F, #106 of 265 statewide, top 43%, 2,262 students, 51% FRL).
- Market conditions: Rents flat; 527 active listings in the ZIP; 3 comparable units currently listed for rent nearby; rentals lingering (median 46d on market — plan ~5-8 weeks vacancy on turnover, expect pricing pressure); 67% of comp listings sitting > 30 days — soft ceiling on asking rent; 1,085 units permitted in Tangipahoa Parish in 2024 (378 in 5+ unit buildings).
Forward outlook
- Local home prices are declining (-3.0%/yr); year-one equity from $1k of loan paydown is wiped out by about $6k of value loss. Plan a longer hold.
- Tangipahoa County population projected at +22% by 2050 — long-run rental-demand tailwind backs the buy-and-hold thesis.
Negotiation context
- Only 9 days on market — expect competitive offers; lowballing is unlikely to land.
- 2 sale attempts with the ask held roughly flat each time — persistent listings suggest the price (not the market) is what's stuck; bring a comps-based counter.
- Current owner paid $72k; list at $205k implies a 185% gain — meaningful room to come down on a strong offer.
Risks & watch-outs
- Climate carrying-cost: severe wind risk, 99% chance of damaging wind over 30y; extreme-heat days projected 7→21/yr by 2055 (HVAC capex compounding) — expect insurance premiums to compound above CPI over the hold.
Questions for the listing agent
- Is there a deadline driving the sale (1031 exchange, divorce, estate, relocation)? That informs how much negotiation room exists.
- Schools are B-rated — typically a magnet for longer-tenancy family renters. What's the average tenant stay here, and is there a school-zone premium baked into asking?
- Crime grade is D in this area — have there been break-ins, vandalism, or insurance claims at this property in the last 3 years? What carrier currently insures it and at what premium?
- The area grade is low — what's the realistic commute time and amenity access for the typical tenant pool here? Any planned neighborhood developments (good or bad) we should know about?
- What's the average days-on-market for RENTAL listings here right now (not sales)? A rising rental-DOM trend means longer vacancies and softer asking-rent achievability than the comps imply.
- What's the recent tenant-quality profile in this submarket — average credit score on applications, eviction rate, late-payment / NSF rate, and stable-employment percentage? A property-management company in the area should have these aggregated.
- How much new for-sale + rental construction is in the pipeline within 1–3 miles? Heavy new supply typically softens prices + rents 12–24 months out; constrained supply supports both.
Investment metrics
- 1% rule
- 0.80% ✗
- Cap rate
- 6.90%
- Cash-on-cash
- 2.16%
- DSCR
- 1.10
- GRM
- 10.4
CMA / ARV
- ARV (on-the-fly)
- $151,248
- Comps found
- 3
Show comp detail 3 sales within ~0.75 mi
| Address | Dist | Beds/Ba | Sqft | Sold | Price | $/sf | Match |
|---|---|---|---|---|---|---|---|
| 105 Drude Dr | 0.24mi | 3/1.0 | 1,175 (+6%) | 18mo | $198,000 | $169 | 63 |
| 241 Cedar Ln | 0.14mi | 2/1.0 (-1) | 1,203 (+9%) | 17mo | $165,000 | $137 | 60 |
| 205 E Pecan St | 0.62mi | 3/1.0 | 1,217 (+10%) | 2mo | $140,000 | $115 | 52 |
Match score weights: distance 35% · size 25% · config 20% · recency 20%. Top-matched comps best support the ARV.
Projected returns pro-forma
-3.0% appreciation · 0.66% rent growth · sell at horizon
- IRR
- -15.2%
- Equity multiple
- 0.47×
- Total profit
- $-30,522
- Equity at exit
- $30,551
- IRR
- -10.6%
- Equity multiple
- 0.42×
- Total profit
- $-33,364
- Equity at exit
- $17,716
Cash invested: $57,372 (down + closing). Projections, not guarantees.
Landlord ↔ Tenant lean methodology
- Overall (STATE)
- 90 Strongly Landlord-Friendly
- State Louisiana
- 90 Strongly Landlord-Friendly · R+12
- County
- — inherits STATE
- City
- — inherits STATE
ZIP-level market 70454
- Rents YoY
- 0.7%
- Active inventory
- 527
- Price-to-rent
- 10.4×
Monthly cashflow live
- Estimated rent
- $1,642 medium interval (Pro) →
- Mortgage (P&I)
- −$1,075
- Tax from tax record
- −$34 /mo · $412/yr
- Insurance
- −$85
- HOA
- −$0
- Vacancy / Maint / Mgmt
- −$345
- Net cashflow
- $103
Break-even live
Sensitivity live
| Price | -10% $219 | -5% $161 | +0% $103 | +5% $-189 | +10% $-260 |
|---|---|---|---|---|---|
| Rent | -10% $-27 | -5% $38 | +0% $103 | +5% $168 | +10% $233 |
| Rate | -1.0pp $206 | -0.5pp $155 | base $103 | +0.5pp $50 | +1.0pp $-4 |
UW: 25.0% down · 7.5% · 30yr · 1.5% tax · 5.0% vac · 8.0% maint · 8.0% mgmt
Financing live
Cash to close
- Down payment
- $51,225
- Closing costs
- $6,147
- Reserves months
- —
- Total cash needed
- —
Loan-product check · same deal, 3 products live
Conventional
25% down · 7.5% · 30yr
- Down + closing
- —
- Monthly P&I
- —
- Monthly cashflow
- —
- DSCR
- —
- Eligible?
- —
Personal DTI + credit; lowest rate.
DSCR
20% down · 8.5% · 30yr
- Down + closing
- —
- Monthly P&I
- —
- Monthly cashflow
- —
- DSCR
- —
- Eligible?
- —
No personal income docs; deal must DSCR.
Hard money
10% down · 12.0% · 12mo
- Down + closing
- —
- Monthly P&I
- —
- Monthly cashflow
- —
- DSCR
- —
- Eligible?
- —
Short-term bridge; refi at stabilization.
Rent comps 3 comps
| Address | Beds | Baths | Sqft | Rent | $/sqft | DOM | Units | Dist |
|---|---|---|---|---|---|---|---|---|
| 523 W Magnolia St Ponchatoula, LA | 2.0 | 2.0 | 1114 | $1,700 | $1.53 | 25d | 1 | 0.37mi |
| 408 E Beech St Ponchatoula, LA | 2.0 | 2.0 | 1001 | $1,170 | $1.17 | 45d | 1 | 1.12mi |
| 412 E Beech St Ponchatoula, LA | 2.0 | 2.0 | 1001 | $1,170 | $1.17 | 45d | 1 | 1.13mi |
Listing history 8 events
-
2026-06-21days on market $204,900 Active 9 DOM
-
2026-06-19days on market $204,900 Active 7 DOM
-
2026-06-18days on market $204,900 Active 6 DOM
-
2026-06-17days on market $204,900 Active 5 DOM
-
2026-06-16days on market $204,900 Active 4 DOM
-
2026-06-15days on market $204,900 Active 3 DOM
-
2026-06-13remarks 693-char remark
-
2026-06-13$204,900 Active 1 DOM
ⓘ Source: listings_history table (triggers on properties + properties_extension) + one-shot
backfill from property_details.listing_events for pre-trigger history.
Tax reassessment forecast LA · Resets to sale price
- Current annual tax
- $412 · $34/mo
- Projected year-2 tax
- $1,127 · $94/mo
- Expected delta
- +$715/yr (+$60/mo · 173.7%)
ⓘ Screening estimate from a state-policy table — verify with the county assessor before closing.
Climate risk First Street
- Flood 4/10 Moderate FEMA zone X (unshaded) · 24% chance over 30 yrs
- Wildfire 3/10 Moderate
- Heat 8/10 Severe 7 d/yr ≥109°F today · 21 d/yr by 30 yrs out
- Wind 9/10 Extreme 99% chance of damaging wind over 30 yrs
- Air quality 2/10 Low 0 unhealthy d/yr today · 1 by 30 yrs out
Nearby sold comps map
Loading sold comps map…
Walkable amenities ~0.75 mi
Loading nearby amenities…
Taxation est. · year 1
- Rental income
- $19,707
- − Mortgage interest
- −$11,478
- − Property taxes
- −$412
- − Insurance
- −$1,024
- − Repairs & maintenance
- −$1,577
- − Management
- −$1,577
- − Depreciation
- −$5,961
- Taxable loss
- −$2,321
- Est. tax savings @ 24.0%
- +$557
- After-tax cash flow
- $1,795/yr
For passive investors: Depreciation is non-cash, so a rental often shows a tax loss while cash-flowing — sheltering income. Rental losses are passive: they offset passive income freely, and up to $25,000/yr can offset ordinary (W-2) income if you actively participate and your MAGI is under $100k (phasing out to $0 by $150k); unused losses carry forward. On sale, claimed depreciation is recaptured at up to 25%, and gains may owe capital-gains tax (a 1031 exchange can defer both). Figures are a year-1 estimate at your 24.0% rate — not tax advice; consult a CPA.
Schools (NCES district)
- District
- Tangipahoa Parish
- NCES district ID
- 2201680
- Math proficiency
- 18% ▼ -32.00%
- Reading proficiency
- 29% ▼ -31.00%
- Median HH income
- $41,283
- Composite
- 19.94/100
- National rank
- #8676
- State rank
- #63 of 98 in LA
Livability — Ponchatoula
- Score
- 68/100
- State rank
- #91
- US rank
- #9755
Category grades
Schools grade is shown separately in the Schools card above.
Census & demographics
- Census place
- Ponchatoula, LA
- County
- Tangipahoa Parish · 85,958 people
- City population
- 34,564
- Metro
- Hammond, LA
- Population (ZIP)
- 34,564
- Household income
- $71,611
- Rent vs Own
- Severe rent burden
- 479.0
Population outlook (Tangipahoa County) Hauer SSP2
- Today (2025)
- 144,204 people
- By 2030
- 151,413 · +5.0%
- By 2040
- 164,374 · +14.0%
- By 2050
- 175,427 · +21.7%
- By 2075
- 195,165 · +35.3%
- By 2100
- 201,641 · +39.8%
Race, ethnicity, and origin ACS 2023
- Neighborhood character
- Predominantly White (73%)
- Race & ethnicity
- White 73% Black 16% Two or more races 8% Hispanic / Latino 8%
- Hispanic origin (detail)
- Mexican 2%
- Common ancestry
- Lithuanian 15% Slovak 1% Portuguese 1%
- Foreign-born
- 3% · Canada
- Languages at home
- 94% English-only · Spanish 5%
Political lean MEDSL · Tangipahoa
- 2024 margin
- Solid R (+37.4) · D 30.6% · R 68.0% · Other 1.3%
- 2008→2024 swing
- -6.5pp toward R · 2008: -30.9pp · 2024: -37.4pp
- All cycles
- 2024: R+37.4 2020: R+32.8 2016: R+32.6 2012: R+27.7 2008: R+30.9
Not yet ingested
- Civics
- —
Market trends
- HPI YoY
- ▼ -83.55%
- Current HPI
- 129.6069
- Rent YoY
- ▲ 0.66%
- Metro
- Hammond, LA
- State GDP YoY
- ▲ 3.29%
- F500 in state
- 10
Industry mix (Fortune 500 HQ in LA)
| Industry | F500 HQs | Revenue |
|---|---|---|
| Telecommunications | 2 | $23B |
|
||
| Utilities | 1 | $12B |
|
||
| Wholesale / Distribution | 1 | $5B |
|
||
| Advertising | 1 | $2B |
|
||
Price history
+352.8% since first listed5 events — show timeline
- 2026-06-12 Listed $204,900 GSREIN
- 2026-06-12 Listed $204,900 AcadianaMLS
- 2023-05-17 Sold (Public Records) $72,000 Public Records
- 2014-04-21 Sold (Public Records) $65,000 Public Records
- 1988-06-30 Sold (Public Records) $45,250 Public Records
Property tax history
-2.0%/yrLatest (2025): $412 · +1.5% YoY. Source: county tax records.
Cash-flow waterfall
monthlySold comps — $/sqft
last 12 mo · ≤1 miLoading sold comps…