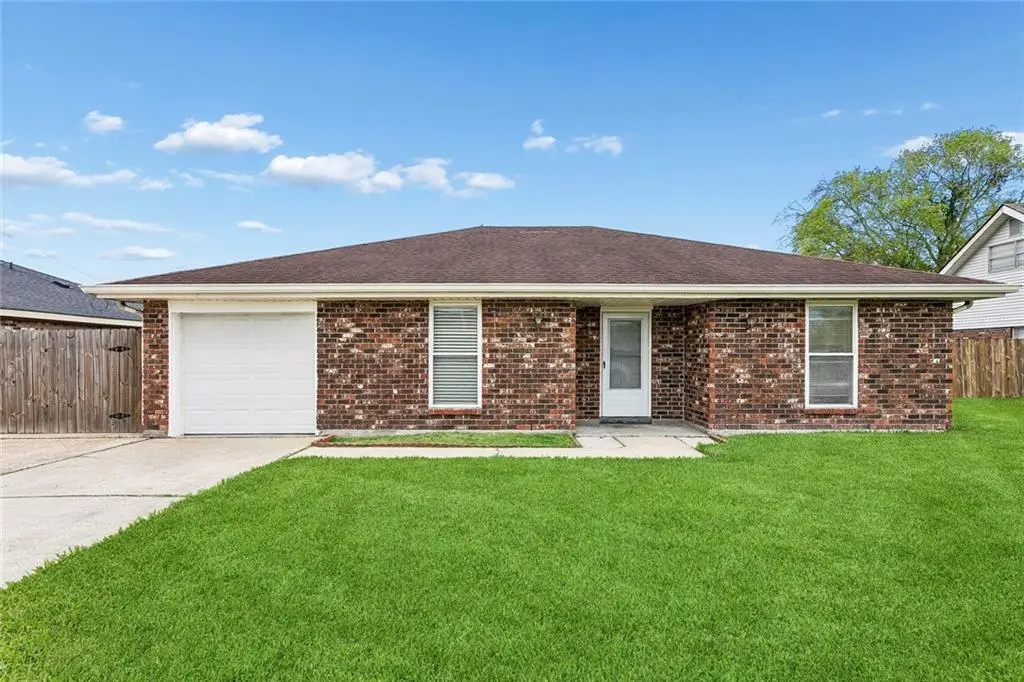
5336 Ehret Rd · Marrero, LA
Flood risk 8/10 · Major
- FEMA flood zone
- X
- Chance of flooding over 30 yrs
- 0.6%
- Est. flood insurance / yr
- $507 – $1,088
Fire risk 1/10 · Minimal
- Est. fire insurance / yr
- $1,269 – $2,357
Heat risk 10/10 · Severe
- Hot days now (above 109°F)
- 7 days/yr
- Hot days in 30 yrs
- 21 days/yr
Wind risk 10/10 · Severe
- Chance of severe wind over 30 yrs
- 99.0%
Air-quality risk 3/10 · Minor
- Unhealthy air days now
- 3 days/yr
- Unhealthy air days in 30 yrs
- 4 days/yr
Risk factors via First Street. Map © Google.
Why this score? — see what drove the D grade
The composite is a weighted blend of 9 inputs, each scored 0–100. Each bar is that input's sub-score; the figure is the points it added to the 100-point composite (weight × sub-score).
- ARV discount +14.5/15.0
- Cash flow +10.8/30.0
- Livability +3.4/5.0
- DSCR +3.1/10.0
- Rent growth +2.8/5.0
- 1% rule +2.6/10.0
- Schools +2.5/10.0
- Condition / age +2.5/5.0
- Appreciation +0.0/10.0
$224,900
🖨 Deal sheet 📄 Offer letter ✓ Due diligence
Listing remarks MLS
Well-Maintained 3Br/2Ba Marrero Home Located In A High Demand Area! Features You'll Love: Bright & Airy Interior, Neutral Paint Throughout, Abundant Natural Light, Ceramic Flooring In Living Areas, Rear Yard Access, Fenced Backyard, X Flood Zone And More! Seller Is Offering A Flooring Allowance To Replace Carpets In Bedrooms With A Reasonable Offer.
Key facts
- Rear yard access
- Fenced backyard
- 7,919 sq ft lot
Tags
Neighborhood map
What this means for you Summary
Snapshot
- This is a 3-bed/2.0-bath single-family listed at $225k.
Deal economics
- At list price, monthly cash flow is $-168 ($-2k/yr) — negative.
- To cash-flow at today's rent, offer at most $195k (13.2% below list).
- To meet the 1% rule (rent ≥ 1% of price), the offer needs to be $170k (24.2% below list).
- Recommended offer: $170k (24.2% below list) — sets the bar for 1% rule.
Location & tenants
- Location reads 67/100 on livability (#104 in LA) — a middle-class / working-renter tenant base. Strengths: cost of living A+, housing A+, health & safety A+; Watch: crime F, amenities F, commute F.
- Jefferson Parish (suburban): math 24% / reading 34% proficiency, ranked #44 of 98 in LA (top 45%) — low school quality limits family demand, transient renter base, plan for 1-2y turnover; 70% free/reduced lunch — lower-income household profile, screen leases tightly.
- Market conditions: Rents rising (+1.1%/yr); 294 active listings in the ZIP; 19 comparable units currently listed for rent nearby; rentals at typical pace (median 24d on market — plan ~3-4 weeks tenant-placement turnaround); 518 units permitted in Jefferson Parish in 2024 (43 in 5+ unit buildings).
- This rent runs 37% of the median local income ($55k/yr) — at the standard rent-burdened threshold; future hikes will face affordability resistance.
Forward outlook
- Local home prices are declining (-3.0%/yr); year-one equity from $2k of loan paydown is wiped out by about $7k of value loss. Plan a longer hold.
Negotiation context
- It's been on market 76 days — a 6% lower offer ($211k) is reasonable based on typical stale-listing flexibility.
- 6 sale attempts since 24y ago with the ask held roughly flat each time — persistent listings suggest the price (not the market) is what's stuck; bring a comps-based counter.
- Current owner paid $146k; list at $225k implies a 54% gain — meaningful room to come down on a strong offer.
Risks & watch-outs
- Watch-outs: flood insurance adds $66/mo.
- Climate carrying-cost: severe flood risk; severe wind risk, 99% chance of damaging wind over 30y; extreme-heat days projected 7→21/yr by 2055 (HVAC capex compounding) — expect insurance premiums to compound above CPI over the hold.
Questions for the listing agent
- What do current leases actually rent for vs. the listed asking? Can we see a recent rent roll and the last 12 months of T-12 income?
- It's been on market 76 days. Have you received any prior offers? Is the seller open to a 24% concession, seller financing, or rate buy-down credit?
- What's the actual annual flood-insurance premium (NFIP or private), and is the property in a SFHA with mandatory coverage?
- Why hasn't it sold? Are there any deal-killer items the seller is aware of (foundation, flood, title, zoning, code violations)?
- Is there a deadline driving the sale (1031 exchange, divorce, estate, relocation)? That informs how much negotiation room exists.
- Schools are B-rated — typically a magnet for longer-tenancy family renters. What's the average tenant stay here, and is there a school-zone premium baked into asking?
- Crime grade is F in this area — have there been break-ins, vandalism, or insurance claims at this property in the last 3 years? What carrier currently insures it and at what premium?
- The area grade is low — what's the realistic commute time and amenity access for the typical tenant pool here? Any planned neighborhood developments (good or bad) we should know about?
- What's the average days-on-market for RENTAL listings here right now (not sales)? A rising rental-DOM trend means longer vacancies and softer asking-rent achievability than the comps imply.
- What's the recent tenant-quality profile in this submarket — average credit score on applications, eviction rate, late-payment / NSF rate, and stable-employment percentage? A property-management company in the area should have these aggregated.
- How much new for-sale + rental construction is in the pipeline within 1–3 miles? Heavy new supply typically softens prices + rents 12–24 months out; constrained supply supports both.
Investment metrics
- 1% rule
- 0.76% ✗
- Cap rate
- 5.75%
- Cash-on-cash
- -1.94%
- DSCR
- 0.91
- GRM
- 11.0
CMA / ARV
- ARV (median comp)
- $266,463
- List price
- $224,900
- Delta
- -15.60%
- Verdict
- UNDERPRICED
- Comps
- 20 within 1.0 mi
Show comp detail 12 sales within ~0.75 mi
| Address | Dist | Beds/Ba | Sqft | Sold | Price | $/sf | Match |
|---|---|---|---|---|---|---|---|
| 2232 Potomac Dr | 0.46mi | 3/2.0 | 1,478 (+1%) | 1mo | $225,000 | $152 | 76 |
| 2329 Caddy Dr | 0.41mi | 3/2.0 | 1,495 (+2%) | 3mo | $270,000 | $181 | 75 |
| 5201 Willowtree Rd | 0.38mi | 3/2.0 | 1,529 (+4%) | 3mo | $252,500 | $165 | 73 |
| 5937 S Oak Dr | 0.55mi | 2/2.0 (-1) | 1,450 (-1%) | 0mo | $171,500 | $118 | 68 |
| 2008 Giaise St | 0.52mi | 3/2.0 | 1,600 (+9%) | 2mo | $140,000 | $88 | 59 |
| 5220 Mt Shasta Ln | 0.65mi | 3/1.0 | 1,398 (-5%) | 2mo | $86,000 | $62 | 57 |
| 5165 Oak Bayou Ave | 0.60mi | 4/2.0 (+1) | 1,546 (+6%) | 3mo | $235,000 | $152 | 55 |
| 2516 Foliage Dr | 0.69mi | 3/2.0 | 1,566 (+7%) | 3mo | $180,000 | $115 | 54 |
| 3520 Bastian Dr | 0.49mi | 4/2.0 (+1) | 1,300 (-11%) | 1mo | $115,000 | $88 | 52 |
| 5065 Oak Bayou Ave | 0.67mi | 4/2.0 (+1) | 1,344 (-8%) | 4mo | $215,000 | $160 | 47 |
| 5068 Dueling Oaks Ave | 0.69mi | 3/2.0 | 1,263 (-14%) | 4mo | $209,900 | $166 | 42 |
| 5032 Dueling Oaks Ave | 0.73mi | 3/2.0 | 1,254 (-14%) | 3mo | $215,000 | $171 | 39 |
Match score weights: distance 35% · size 25% · config 20% · recency 20%. Top-matched comps best support the ARV.
Projected returns pro-forma
-3.0% appreciation · 1.05% rent growth · sell at horizon
- IRR
- -23.8%
- Equity multiple
- 0.20×
- Total profit
- $-50,428
- Equity at exit
- $33,533
- IRR
- -25.0%
- Equity multiple
- -0.12×
- Total profit
- $-70,635
- Equity at exit
- $19,445
Cash invested: $62,972 (down + closing). Projections, not guarantees.
Landlord ↔ Tenant lean methodology
- Overall (STATE)
- 90 Strongly Landlord-Friendly
- State Louisiana
- 90 Strongly Landlord-Friendly · R+12
- County
- — inherits STATE
- City
- — inherits STATE
ZIP-level market 70072
- Rents YoY
- 1.1%
- Active inventory
- 294
- Price-to-rent
- 11.0×
Monthly cashflow live
- Estimated rent
- $1,704 high interval (Pro) →
- Mortgage (P&I)
- −$1,179
- Tax from tax record
- −$175 /mo · $2,097/yr
- Insurance
- −$94
- Flood insurance flood zone
- −$66 /mo · $798/yr
- HOA
- −$0
- Vacancy / Maint / Mgmt
- −$358
- Net cashflow
- $-168
Break-even live
UW: 25.0% down · 7.5% · 30yr · 1.5% tax · 5.0% vac · 8.0% maint · 8.0% mgmt
Financing live
Cash to close
- Down payment
- $56,225
- Closing costs
- $6,747
- Reserves months
- —
- Total cash needed
- —
Loan-product check · same deal, 3 products live
Conventional
25% down · 7.5% · 30yr
- Down + closing
- —
- Monthly P&I
- —
- Monthly cashflow
- —
- DSCR
- —
- Eligible?
- —
Personal DTI + credit; lowest rate.
DSCR
20% down · 8.5% · 30yr
- Down + closing
- —
- Monthly P&I
- —
- Monthly cashflow
- —
- DSCR
- —
- Eligible?
- —
No personal income docs; deal must DSCR.
Hard money
10% down · 12.0% · 12mo
- Down + closing
- —
- Monthly P&I
- —
- Monthly cashflow
- —
- DSCR
- —
- Eligible?
- —
Short-term bridge; refi at stabilization.
Rent comps 19 comps
| Address | Beds | Baths | Sqft | Rent | $/sqft | DOM | Units | Dist |
|---|---|---|---|---|---|---|---|---|
| 2325 Wilton St Unit A Marrero, LA | 2.0 | 1.0 | 1000 | $1,200 | $1.20 | 44d | 1 | 0.16mi |
| 5118 Ehret Rd Unit B Marrero, LA | 3.0 | 2.5 | 1275 | $1,800 | $1.41 | 4d | 1 | 0.26mi |
| 5504 Randolph St Marrero, LA | 3.0 | 2.0 | 1800 | $1,800 | $1.00 | 24d | 1 | 0.47mi |
| 5913 S Oak Dr Marrero, LA | 4.0 | 2.0 | 1300 | $1,950 | $1.50 | 24d | 1 | 0.51mi |
| 2632 Dove Ave Unit NA Marrero, LA | 3.0 | 2.0 | 1250 | $1,650 | $1.32 | 44d | 1 | 0.55mi |
| 5128 Eden Roc Dr Marrero, LA | 3.0 | 2.0 | 1400 | $1,750 | $1.25 | 4d | 1 | 0.56mi |
| 5162 Mount Matterhorn Ave Marrero, LA | 2.0 | 1.0 | 1000 | $1,050 | $1.05 | 4d | 1 | 0.63mi |
| 5160 Mount Matterhorn St Marrero, LA | 2.0 | 1.0 | 1000 | $1,050 | $1.05 | 24d | 1 | 0.63mi |
| 116 Sunrise Dr Marrero, LA | 3.0 | 1.5 | 1225 | $1,750 | $1.43 | 44d | 1 | 0.69mi |
| 5045 Dueling Oaks Ave Marrero, LA | 3.0 | 2.0 | 1300 | $1,700 | $1.31 | 24d | 1 | 0.73mi |
| 5007 Towering Oaks Ave Marrero, LA | 3.0 | 2.0 | 1400 | $1,700 | $1.21 | 44d | 1 | 0.82mi |
| 2612 Susie Ct Marrero, LA | 3.0 | 2.0 | 1852 | $2,200 | $1.19 | 20d | 1 | 0.96mi |
| 2425 Ramsey Dr Marrero, LA | 4.0 | 2.0 | 1500 | $1,800 | $1.20 | 2d | 1 | 0.98mi |
| 5119 Oak Dr Marrero, LA | 3.0 | 2.0 | 1624 | $1,750 | $1.08 | 14d | 1 | 1.04mi |
| 5027 Richland Dr Marrero, LA | 2.0 | 1.5 | 1260 | $1,500 | $1.19 | 4d | 1 | 1.14mi |
| 1728 Irma St Marrero, LA | 3.0 | 2.0 | 1450 | $1,550 | $1.07 | 24d | 1 | 1.20mi |
| 4016 S Dells St Harvey, LA | 4.0 | 2.0 | 1750 | $2,000 | $1.14 | 44d | 1 | 1.36mi |
| 1836 Plaza Dr Unit C Marrero, LA | 3.0 | 1.0 | 1040 | $1,700 | $1.63 | 4d | 1 | 1.40mi |
| 1836 Plaza Dr Unit A Marrero, LA | 3.0 | 1.0 | 1040 | $1,700 | $1.63 | 44d | 1 | 1.40mi |
Listing history 25 events
-
2026-06-18days on market $224,900 Active 76 DOM
-
2026-06-17days on market $224,900 Active 75 DOM
-
2026-06-16days on market $224,900 Active 74 DOM
-
2026-06-15days on market $224,900 Active 73 DOM
-
2026-06-13days on market $224,900 Active 71 DOM
-
2026-06-10days on market $224,900 Active 68 DOM
-
2026-06-09days on market $224,900 Active 67 DOM
-
2026-06-08days on market $224,900 Active 66 DOM
-
2026-06-07days on market $224,900 Active 65 DOM
-
2026-06-03days on market $224,900 Active 61 DOM
-
2026-06-02days on market $224,900 Active 60 DOM
-
2026-06-01days on market $224,900 Active 59 DOM
-
2026-05-31days on market $224,900 Active 58 DOM
-
2026-05-14price $224,900 355-char remark
Show marketing remark (363 chars)
Well-Maintained 3Br/2Ba Marrero Home Located In A High Demand Area! Features You’ll Love: Bright & Airy Interior, Neutral Paint Throughout, Abundant Natural Light, Ceramic Flooring In Living Areas, Rear Yard Access, Fenced Backyard, X Flood Zone And More! Seller Is Offering A Flooring Allowance To Replace Carpets In Bedrooms With A Reasonable Offer.
-
2026-05-14price $224,900 363-char remark
Show marketing remark (363 chars)
Well-Maintained 3Br/2Ba Marrero Home Located In A High Demand Area! Features You’ll Love: Bright & Airy Interior, Neutral Paint Throughout, Abundant Natural Light, Ceramic Flooring In Living Areas, Rear Yard Access, Fenced Backyard, X Flood Zone And More! Seller Is Offering A Flooring Allowance To Replace Carpets In Bedrooms With A Reasonable Offer.
-
2026-04-03$229,900 Active 355-char remark
Show marketing remark (363 chars)
Well-Maintained 3Br/2Ba Marrero Home Located In A High Demand Area! Features You’ll Love: Bright & Airy Interior, Neutral Paint Throughout, Abundant Natural Light, Ceramic Flooring In Living Areas, Rear Yard Access, Fenced Backyard, X Flood Zone And More! Seller Is Offering A Flooring Allowance To Replace Carpets In Bedrooms With A Reasonable Offer.
-
2026-04-03$229,900 Active 363-char remark
Show marketing remark (363 chars)
Well-Maintained 3Br/2Ba Marrero Home Located In A High Demand Area! Features You’ll Love: Bright & Airy Interior, Neutral Paint Throughout, Abundant Natural Light, Ceramic Flooring In Living Areas, Rear Yard Access, Fenced Backyard, X Flood Zone And More! Seller Is Offering A Flooring Allowance To Replace Carpets In Bedrooms With A Reasonable Offer.
-
2008-11-10soldstatus $146,000
-
2008-11-07soldstatus $146,000
-
2008-01-14$149,900
-
2008-01-14$149,900
-
2003-04-11soldstatus $108,000
-
2003-04-01soldstatus $108,000
-
2002-08-14$119,900
-
2002-08-14$119,900
ⓘ Source: listings_history table (triggers on properties + properties_extension) + one-shot
backfill from property_details.listing_events for pre-trigger history.
Tax reassessment forecast LA · Resets to sale price
- Current annual tax
- $2,097 · $175/mo
- Projected year-2 tax
- $2,097 · $175/mo
- Expected delta
- $0/yr ($0/mo · 0.0%)
ⓘ Screening estimate from a state-policy table — verify with the county assessor before closing.
Climate risk First Street
- Flood 8/10 Severe FEMA zone X · 60% chance over 30 yrs
- Wildfire 1/10 Low
- Heat 10/10 Extreme 7 d/yr ≥109°F today · 21 d/yr by 30 yrs out
- Wind 10/10 Extreme 99% chance of damaging wind over 30 yrs
- Air quality 3/10 Moderate 3 unhealthy d/yr today · 4 by 30 yrs out
Nearby sold comps map
Loading sold comps map…
Walkable amenities ~0.75 mi
Loading nearby amenities…
Taxation est. · year 1
- Rental income
- $20,449
- − Mortgage interest
- −$12,598
- − Property taxes
- −$2,097
- − Insurance
- −$1,922
- − Repairs & maintenance
- −$1,636
- − Management
- −$1,636
- − Depreciation
- −$6,543
- Taxable loss
- −$5,982
- Est. tax savings @ 24.0%
- +$1,436
- After-tax cash flow
- $-581/yr
For passive investors: Depreciation is non-cash, so a rental often shows a tax loss while cash-flowing — sheltering income. Rental losses are passive: they offset passive income freely, and up to $25,000/yr can offset ordinary (W-2) income if you actively participate and your MAGI is under $100k (phasing out to $0 by $150k); unused losses carry forward. On sale, claimed depreciation is recaptured at up to 25%, and gains may owe capital-gains tax (a 1031 exchange can defer both). Figures are a year-1 estimate at your 24.0% rate — not tax advice; consult a CPA.
Schools (NCES district)
- District
- Jefferson Parish
- NCES district ID
- 2200840
- Math proficiency
- 24% ▼ -36.00%
- Reading proficiency
- 34% ▼ -30.00%
- Median HH income
- $48,421
- Composite
- 25.19/100
- National rank
- #7511
- State rank
- #44 of 98 in LA
Livability — Marrero
- Score
- 67/100
- State rank
- #104
- US rank
- #10146
Category grades
Schools grade is shown separately in the Schools card above.
Census & demographics
- Census place
- Marrero, LA
- County
- Jefferson Parish · 426,999 people
- City population
- 55,693
- Metro
- New Orleans-Metairie, LA
- Population (ZIP)
- 55,693
- Household income
- $54,885
- Rent vs Own
- Severe rent burden
- 1807.0
Population outlook (Jefferson County) Hauer SSP2
- Today (2025)
- 451,696 people
- By 2030
- 455,451 · +0.8%
- By 2040
- 458,308 · +1.5%
- By 2050
- 461,031 · +2.1%
- By 2075
- 476,351 · +5.5%
- By 2100
- 499,377 · +10.6%
Race, ethnicity, and origin ACS 2023
- Neighborhood character
- Diverse neighborhood (Simpson 0.67)
- Race & ethnicity
- Black 40% White 39% Hispanic / Latino 12% Two or more races 7% Asian 5%
- Hispanic origin (detail)
- Mexican 4% Dominican 1%
- Common ancestry
- Lithuanian 12% Hispanic 1%
- Foreign-born
- 10% · Canada, Vietnam, Jamaica
- Languages at home
- 85% English-only · Spanish 8% Vietnamese 4% French/Haitian/Cajun 2%
Political lean MEDSL · Jefferson
- 2024 margin
- R (+12.9) · D 42.5% · R 55.5% · Other 2.1%
- 2008→2024 swing
- +13.6pp toward D · 2008: -26.6pp · 2024: -12.9pp
- All cycles
- 2024: R+12.9 2020: R+11.1 2016: R+14.8 2012: R+18.4 2008: R+26.6
Not yet ingested
- Civics
- —
Market trends
- HPI YoY
- ▼ -89.87%
- Current HPI
- 161.7477
- Rent YoY
- ▲ 1.05%
- Metro
- New Orleans-Metairie, LA
- State GDP YoY
- ▲ 3.29%
- F500 in state
- 10
Industry mix (Fortune 500 HQ in LA)
| Industry | F500 HQs | Revenue |
|---|---|---|
| Telecommunications | 2 | $23B |
|
||
| Utilities | 1 | $12B |
|
||
| Wholesale / Distribution | 1 | $5B |
|
||
| Advertising | 1 | $2B |
|
||
Price history
+87.6% since first listed12 events — show timeline
- 2026-05-14 Price Changed $224,900 AcadianaMLS
- 2026-05-14 Price Changed $224,900 GSREIN
- 2026-04-03 Listed $229,900 GSREIN
- 2026-04-03 Listed $229,900 AcadianaMLS
- 2008-11-10 Sold (Public Records) $146,000 Public Records
- 2008-11-07 Sold (MLS) $146,000 GSREIN
- 2008-01-14 Listed $149,900 AcadianaMLS
- 2008-01-14 Listed $149,900 GSREIN
- 2003-04-11 Sold (MLS) $108,000 GSREIN
- 2003-04-01 Sold (Public Records) $108,000 Public Records
- 2002-08-14 Listed $119,900 GSREIN
- 2002-08-14 Listed $119,900 AcadianaMLS
Property tax history
+1.9%/yrLatest (2025): $2,097 · +0.3% YoY. Source: county tax records.
Cash-flow waterfall
monthlySold comps — $/sqft
last 12 mo · ≤1 miLoading sold comps…