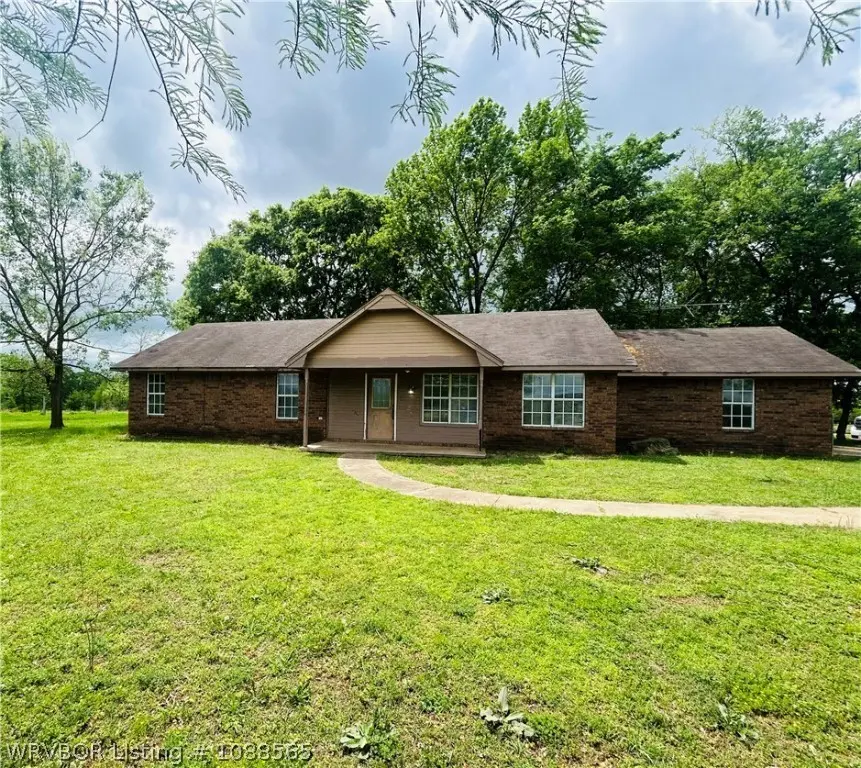
609 Ollar Ln · Heavener, OK
Flood risk 1/10 · Minimal
- FEMA flood zone
- X (unshaded)
- Chance of flooding over 30 yrs
- 0.0%
- Est. flood insurance / yr
- $507 – $1,088
Fire risk 7/10 · Major
- Est. fire insurance / yr
- $2,463 – $4,575
Heat risk 6/10 · Moderate
- Hot days now (above 114°F)
- 7 days/yr
- Hot days in 30 yrs
- 20 days/yr
Wind risk 3/10 · Minor
- Chance of severe wind over 30 yrs
- 6.0%
Air-quality risk 2/10 · Minimal
- Unhealthy air days now
- 0 days/yr
- Unhealthy air days in 30 yrs
- 1 days/yr
Risk factors via First Street. Map © Google.
Why this score? — see what drove the D+ grade
The composite is a weighted blend of 9 inputs, each scored 0–100. Each bar is that input's sub-score; the figure is the points it added to the 100-point composite (weight × sub-score).
- Cash flow +14.6/30.0
- Appreciation +10.0/10.0
- ARV discount +7.5/15.0
- DSCR +4.5/10.0
- 1% rule +3.2/10.0
- Livability +3.0/5.0
- Rent growth +2.5/5.0
- Condition / age +2.5/5.0
- Schools +1.5/10.0
$141,000
🖨 Deal sheet 📄 Offer letter ✓ Due diligence
Listing remarks MLS
3br/2b w 5 acreas country home inside city limits w ponds and pasture surrounding it. Awesome country living but your minutes from the grocery store! Dont miss this one of a kind investment- home is in need of some updates but priced to sell fast.
Key facts
- 3.55 acre lot
- Garage
- Built 1995
Property features AI
Finance
- Other: Located in Heavener Township Add subdivision
Exterior
- Parking: Attached garage; 1 covered parking space; Gravel and concrete driveway/parking
- Utilities: Electricity available
- Home design: Single-family house; One level / single story
- Construction: Brick and vinyl siding exterior; Asphalt shingle roof; Slab foundation; Built as a house (year built not provided)
- Exterior features: Patio; Cleared lot; Level lot; Lot irregularly shaped; 3.55 acre lot
Interior
- Kitchen: Electric water heater (serves kitchen); Eat-in kitchen
- Bedrooms: Single-family home (number of bedrooms not specified)
- Flooring: Laminate
- Bathrooms: 2 full bathrooms
- Heating & cooling: Central air; Electric heating; Ceiling fan(s)
- Interior features: Built-in features; Ceiling fan(s); Eat-in kitchen
- Laundry & utility: Electric dryer hookup
Neighborhood map
What this means for you Summary
Snapshot
- This is a 3-bed/2.0-bath single-family listed at $141k.
Deal economics
- At list price, monthly cash flow is $34 ($410/yr) — positive.
- The deal already cash-flows at list — no discount required.
- To meet the 1% rule (rent ≥ 1% of price), the offer needs to be $116k (18.1% below list).
- Recommended offer: $116k (18.1% below list) — sets the bar for 1% rule.
Location & tenants
- Location reads 60/100 on livability (#354 in OK) — a middle-class / working-renter tenant base. Strengths: cost of living A+, housing A+; Watch: amenities F, commute F, employment F.
- Heavener (town): math 14% / reading 23% proficiency, ranked #200 of 270 in OK (top 74%) — low school quality limits family demand, transient renter base, plan for 1-2y turnover; 74% free/reduced lunch — lower-income household profile, screen leases tightly.
- Zoned schools: Heavener Es (math 14% / reading 23%, grade F, #530 of 845 statewide, top 63%, 577 students, 0% FRL); Heavener Hs (math 12% / reading 22%, grade F, #314 of 447 statewide, top 72%, 310 students, 0% FRL) — zoned schools average 0% FRL vs 74% district-wide (74 pts lower); this property's tenant base skews higher-income than the district average.
- Market conditions: 43 active listings in the ZIP; 73 units permitted in Le Flore County in 2024 (0 in 5+ unit buildings).
Forward outlook
- In year one you build about $15k of equity ($975 loan paydown + $14k appreciation (9.9% local appreciation)).
- Le Flore County population projected at -13% by 2050 — secular population decline; favor cash flow + early exit over multi-decade hold.
- At projected returns (9.9% appreciation + 3.0% rent growth), your $39k cash investment doubles in ~3 years — after that, you're playing with house money.
- By year 3, paydown + projected appreciation supports a ~$38k cash-out refi (75% LTV) — recoverable capital for the next deal without selling this one.
Negotiation context
- It's been on market 57 days — a 3% lower offer ($137k) is reasonable based on typical stale-listing flexibility.
- 2 sale attempts since 7y ago; this cycle's ask has dropped $24k (15%) from the opening price — seller is motivated, your offer sets the floor, not the list.
- Current owner paid $95k; 48% above their basis — modest negotiation headroom, anchor on the comps not their cost.
Risks & watch-outs
- Climate carrying-cost: major wildfire risk; extreme-heat days projected 7→20/yr by 2055 (HVAC capex compounding) — expect insurance premiums to compound above CPI over the hold.
Questions for the listing agent
- It's been on market 57 days. Have you received any prior offers? Is the seller open to a 18% concession, seller financing, or rate buy-down credit?
- Is there a deadline driving the sale (1031 exchange, divorce, estate, relocation)? That informs how much negotiation room exists.
- Schools are F-rated, which usually means shorter tenancies and higher turnover. Who's the typical renter profile here, and what's been the actual vacancy rate?
- The area grade is low — what's the realistic commute time and amenity access for the typical tenant pool here? Any planned neighborhood developments (good or bad) we should know about?
- What's the average days-on-market for RENTAL listings here right now (not sales)? A rising rental-DOM trend means longer vacancies and softer asking-rent achievability than the comps imply.
- What's the recent tenant-quality profile in this submarket — average credit score on applications, eviction rate, late-payment / NSF rate, and stable-employment percentage? A property-management company in the area should have these aggregated.
- How much new for-sale + rental construction is in the pipeline within 1–3 miles? Heavy new supply typically softens prices + rents 12–24 months out; constrained supply supports both.
Investment metrics
- 1% rule
- 0.82% ✗
- Cap rate
- 6.58%
- Cash-on-cash
- 1.04%
- DSCR
- 1.05
- GRM
- 10.2
CMA / ARV
- ARV (on-the-fly)
- $416,416
- Comps found
- 1
Show comp detail 1 sale within ~0.75 mi
| Address | Dist | Beds/Ba | Sqft | Sold | Price | $/sf | Match |
|---|---|---|---|---|---|---|---|
| 21 Pickle Ln | 0.43mi | 3/2.0 | 1,554 (+7%) | 18mo | $445,000 | $286 | 54 |
Match score weights: distance 35% · size 25% · config 20% · recency 20%. Top-matched comps best support the ARV.
Projected returns pro-forma
9.94% appreciation · 3.0% rent growth · sell at horizon
- IRR
- 24.9%
- Equity multiple
- 2.98×
- Total profit
- $78,324
- Equity at exit
- $126,385
- IRR
- 22.0%
- Equity multiple
- 6.79×
- Total profit
- $228,697
- Equity at exit
- $271,876
Cash invested: $39,480 (down + closing). Projections, not guarantees.
Landlord ↔ Tenant lean methodology
- Overall (STATE)
- 83 Strongly Landlord-Friendly
- State Oklahoma
- 83 Strongly Landlord-Friendly · R+20
- County
- — inherits STATE
- City
- — inherits STATE
ZIP-level market 74937
- Home prices YoY
- 3.9%
- Active inventory
- 43
- Price-to-rent
- 10.2×
Monthly cashflow live
- Estimated rent
- $1,155 medium interval (Pro) →
- Mortgage (P&I)
- −$739
- Tax from tax record
- −$80 /mo · $966/yr
- Insurance
- −$59
- HOA
- −$0
- Vacancy / Maint / Mgmt
- −$243
- Net cashflow
- $34
Break-even live
UW: 25.0% down · 7.5% · 30yr · 1.5% tax · 5.0% vac · 8.0% maint · 8.0% mgmt
Financing live
Cash to close
- Down payment
- $35,250
- Closing costs
- $4,230
- Reserves months
- —
- Total cash needed
- —
Loan-product check · same deal, 3 products live
Conventional
25% down · 7.5% · 30yr
- Down + closing
- —
- Monthly P&I
- —
- Monthly cashflow
- —
- DSCR
- —
- Eligible?
- —
Personal DTI + credit; lowest rate.
DSCR
20% down · 8.5% · 30yr
- Down + closing
- —
- Monthly P&I
- —
- Monthly cashflow
- —
- DSCR
- —
- Eligible?
- —
No personal income docs; deal must DSCR.
Hard money
10% down · 12.0% · 12mo
- Down + closing
- —
- Monthly P&I
- —
- Monthly cashflow
- —
- DSCR
- —
- Eligible?
- —
Short-term bridge; refi at stabilization.
Listing history 19 events
-
2026-06-18days on market $141,000 Active 57 DOM
-
2026-06-17days on market $141,000 Active 56 DOM
-
2026-06-16days on market $141,000 Active 55 DOM
-
2026-06-15days on market $141,000 Active 54 DOM
-
2026-06-13days on market $141,000 Active 52 DOM
-
2026-06-12days on market $141,000 Active 51 DOM
-
2026-06-09pricedays on market $141,000 Active 48 DOM
-
2026-06-08days on market $165,000 Active 47 DOM
-
2026-06-08days on market $165,000 Active 46 DOM
-
2026-06-05days on market $165,000 Active 44 DOM
-
2026-06-04days on market $165,000 Active 42 DOM
-
2026-06-02days on market $165,000 Active 41 DOM
-
2026-06-01days on market $165,000 Active 40 DOM
-
2026-05-31days on market $165,000 Active 39 DOM
-
2026-04-22$165,000 Active
-
2019-07-30soldstatus $95,000 247-char remark
Show marketing remark (247 chars)
3br/2b w 5 acreas country home inside city limits w ponds and pasture surrounding it. Awesome country living but your minutes from the grocery store! Dont miss this one of a kind investment- home is in need of some updates but priced to sell fast.
-
2019-07-18soldstatus $95,000
-
2019-04-14$90,000 247-char remark
Show marketing remark (247 chars)
3br/2b w 5 acreas country home inside city limits w ponds and pasture surrounding it. Awesome country living but your minutes from the grocery store! Dont miss this one of a kind investment- home is in need of some updates but priced to sell fast.
-
2012-08-20soldstatus $20,000
ⓘ Source: listings_history table (triggers on properties + properties_extension) + one-shot
backfill from property_details.listing_events for pre-trigger history.
Tax reassessment forecast OK · Resets to sale price
- Current annual tax
- $966 · $80/mo
- Projected year-2 tax
- $1,269 · $106/mo
- Expected delta
- +$303/yr (+$25/mo · 31.4%)
ⓘ Screening estimate from a state-policy table — verify with the county assessor before closing.
Climate risk First Street
- Flood 1/10 Low FEMA zone X (unshaded) · 0% chance over 30 yrs
- Wildfire 7/10 Severe
- Heat 6/10 Major 7 d/yr ≥114°F today · 20 d/yr by 30 yrs out
- Wind 3/10 Moderate 6% chance of damaging wind over 30 yrs
- Air quality 2/10 Low 0 unhealthy d/yr today · 1 by 30 yrs out
Nearby sold comps map
Loading sold comps map…
Walkable amenities ~0.75 mi
Loading nearby amenities…
Taxation est. · year 1
- Rental income
- $13,865
- − Mortgage interest
- −$7,898
- − Property taxes
- −$966
- − Insurance
- −$705
- − Repairs & maintenance
- −$1,109
- − Management
- −$1,109
- − Depreciation
- −$4,102
- Taxable loss
- −$2,024
- Est. tax savings @ 24.0%
- +$486
- After-tax cash flow
- $895/yr
For passive investors: Depreciation is non-cash, so a rental often shows a tax loss while cash-flowing — sheltering income. Rental losses are passive: they offset passive income freely, and up to $25,000/yr can offset ordinary (W-2) income if you actively participate and your MAGI is under $100k (phasing out to $0 by $150k); unused losses carry forward. On sale, claimed depreciation is recaptured at up to 25%, and gains may owe capital-gains tax (a 1031 exchange can defer both). Figures are a year-1 estimate at your 24.0% rate — not tax advice; consult a CPA.
Schools (NCES district)
- District
- Heavener
- NCES district ID
- 4014160
- Math proficiency
- 14% ▼ -5.00%
- Reading proficiency
- 23% ▼ -4.00%
- Median HH income
- $32,029
- Composite
- 14.92/100
- National rank
- #9370
- State rank
- #200 of 270 in OK
Livability — Heavener
- Score
- 60/100
- State rank
- #354
- US rank
- #19062
Category grades
Schools grade is shown separately in the Schools card above.
Census & demographics
- Census place
- Heavener, OK
- Population (ZIP)
- 5,185
Population outlook (Le Flore County) Hauer SSP2
- Today (2025)
- 48,504 people
- By 2030
- 47,474 · -2.1%
- By 2040
- 44,914 · -7.4%
- By 2050
- 42,239 · -12.9%
- By 2075
- 35,071 · -27.7%
- By 2100
- 25,949 · -46.5%
Race, ethnicity, and origin ACS 2023
- Neighborhood character
- Diverse neighborhood (Simpson 0.61)
- Race & ethnicity
- White 59% Hispanic / Latino 21% Two or more races 12% Native American 11%
- Hispanic origin (detail)
- Mexican 19%
- Common ancestry
- Serbian 1% Slovak 1% Lithuanian 1%
- Foreign-born
- 9% · Canada
- Languages at home
- 83% English-only · Spanish 17%
Political lean MEDSL · Le Flore
- 2024 margin
- Solid R (+64.8) · D 17.0% · R 81.8% · Other 1.3%
- 2008→2024 swing
- -26.1pp toward R · 2008: -38.6pp · 2024: -64.8pp
- All cycles
- 2024: R+64.8 2020: R+63.4 2016: R+58.7 2012: R+41.1 2008: R+38.6
Not yet ingested
- Civics
- —
Market trends
- HPI YoY
- ▲ 9.94%
- Current HPI
- 267.2382
- Rent YoY
- —
- Metro
- —
- State GDP YoY
- ▲ 1.55%
- F500 in state
- 6
Industry mix (Fortune 500 HQ in OK)
| Industry | F500 HQs | Revenue |
|---|---|---|
| Energy | 3 | $48B |
|
||
Price history
+725.0% since first listed5 events — show timeline
- 2026-04-22 Listed $165,000 WRVBOR
- 2019-07-30 Sold (MLS) $95,000 MLS Technology, Inc.
- 2019-07-18 Sold (Public Records) $95,000 Public Records
- 2019-04-14 Listed $90,000 MLS Technology, Inc.
- 2012-08-20 Sold (Public Records) $20,000 Public Records
Property tax history
+5.7%/yrLatest (2025): $966 · +5.3% YoY. Source: county tax records.
Cash-flow waterfall
monthlySold comps — $/sqft
last 12 mo · ≤1 miLoading sold comps…