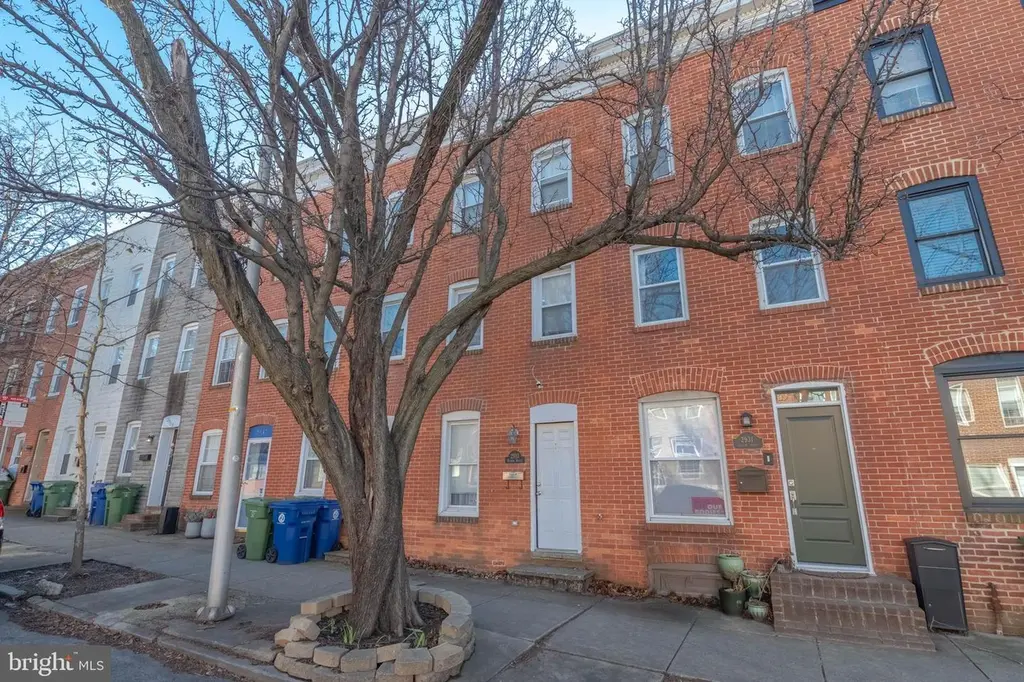
2933 Hudson St · Baltimore, MD
Flood risk 1/10 · Minimal
- FEMA flood zone
- X (unshaded)
- Chance of flooding over 30 yrs
- 0.0%
- Est. flood insurance / yr
- $507 – $1,088
Fire risk 1/10 · Minimal
- Est. fire insurance / yr
- $755 – $1,403
Heat risk 8/10 · Major
- Hot days now (above 103°F)
- 7 days/yr
- Hot days in 30 yrs
- 15 days/yr
Wind risk 6/10 · Moderate
- Chance of severe wind over 30 yrs
- 27.0%
Air-quality risk 4/10 · Minor
- Unhealthy air days now
- 6 days/yr
- Unhealthy air days in 30 yrs
- 7 days/yr
Risk factors via First Street. Map © Google.
Why this score? — see what drove the D+ grade
The composite is a weighted blend of 9 inputs, each scored 0–100. Each bar is that input's sub-score; the figure is the points it added to the 100-point composite (weight × sub-score).
- Cash flow +15.2/30.0
- ARV discount +15.0/15.0
- 1% rule +4.8/10.0
- DSCR +4.7/10.0
- Livability +3.8/5.0
- Rent growth +2.8/5.0
- Condition / age +2.5/5.0
- Schools +1.0/10.0
- Appreciation +0.0/10.0
$229,900
🖨 Deal sheet 📄 Offer letter ✓ Due diligence
Listing remarks
Welcome to 2933 Hudson Street, a three-story rowhome ideally located in the heart of highly sought-after Canton, just steps from the area’s best dining, shopping, and waterfront attractions. The main level offers an open-concept layout perfect for entertaining, featuring hardwood floors throughout the living and dining areas and an eat-in kitchen with ceramic tile flooring and stainless-steel appliances. Step right outside from the kitchen to a spacious rear deck, ideal for BBQs, outdoor dining, or simply unwinding after a long day. The upper levels provide two private bedrooms, convenient upper-level laundry, and a top-floor primary suite complete with an ensuite bath and jacuzzi tub
Key facts
- Eat-in kitchen
- Hardwood floors
- Spacious rear deck
Tags
Neighborhood map
What this means for you Summary
Snapshot
- This is a 2-bed/1.0-bath townhouse listed at $230k.
Deal economics
- At list price, monthly cash flow is $80 ($957/yr) — positive.
- The deal already cash-flows at list — no discount required.
- To meet the 1% rule (rent ≥ 1% of price), the offer needs to be $225k (2.3% below list).
- Recommended offer: $209k (9.0% below list) — sets the bar for market timing.
Location & tenants
- Location reads 76/100 on livability (#90 in MD, #3,396 nationally) — a middle-class / working-renter tenant base. Strengths: amenities A+, commute A+, housing A+; Watch: schools D, crime F.
- Baltimore City Public Schools (urban): math 7% / reading 16% proficiency, ranked #24 of 24 in MD (top 100%) — low school quality limits family demand, transient renter base, plan for 1-2y turnover; 79% free/reduced lunch — lower-income household profile, screen leases tightly.
- Market conditions: Rents rising (+1.3%/yr); 391 active listings in the ZIP; 40 comparable units currently listed for rent nearby; rentals at typical pace (median 24d on market — plan ~3-4 weeks tenant-placement turnaround); 40% of comp listings sitting > 30 days — soft ceiling on asking rent; solid renter incomes; 1,273 units permitted in Baltimore city in 2024 (1,104 in 5+ unit buildings).
- This rent runs 30% of the median local income ($89k/yr) — at the standard rent-burdened threshold; future hikes will face affordability resistance.
Forward outlook
- Local home prices are declining (-3.0%/yr); year-one equity from $2k of loan paydown is wiped out by about $7k of value loss. Plan a longer hold.
- Baltimore County population projected to shrink 4% by 2050 — rents likely to lag national; underwrite the cash flow, not the appreciation.
Negotiation context
- It's been on market 101 days — a 9% lower offer ($209k) is reasonable based on typical stale-listing flexibility.
- 9 sale attempts since 24y ago with the ask held roughly flat each time — persistent listings suggest the price (not the market) is what's stuck; bring a comps-based counter.
Risks & watch-outs
- Watch-outs: built in 1910 — expect roof / HVAC / electrical / plumbing capex.
- Climate carrying-cost: major wind risk, 27% chance of damaging wind over 30y; extreme-heat days projected 7→15/yr by 2055 (HVAC capex compounding) — expect insurance premiums to compound above CPI over the hold.
Questions for the listing agent
- It's been on market 101 days. Have you received any prior offers? Is the seller open to a 9% concession, seller financing, or rate buy-down credit?
- Built in 1910 — when were the roof, HVAC, electrical panel, plumbing, and water heater last replaced?
- Why hasn't it sold? Are there any deal-killer items the seller is aware of (foundation, flood, title, zoning, code violations)?
- Is there a deadline driving the sale (1031 exchange, divorce, estate, relocation)? That informs how much negotiation room exists.
- Schools are D-rated, which usually means shorter tenancies and higher turnover. Who's the typical renter profile here, and what's been the actual vacancy rate?
- Crime grade is F in this area — have there been break-ins, vandalism, or insurance claims at this property in the last 3 years? What carrier currently insures it and at what premium?
- The area grade is low — what's the realistic commute time and amenity access for the typical tenant pool here? Any planned neighborhood developments (good or bad) we should know about?
- What's the average days-on-market for RENTAL listings here right now (not sales)? A rising rental-DOM trend means longer vacancies and softer asking-rent achievability than the comps imply.
- What's the recent tenant-quality profile in this submarket — average credit score on applications, eviction rate, late-payment / NSF rate, and stable-employment percentage? A property-management company in the area should have these aggregated.
- How much new for-sale + rental construction is in the pipeline within 1–3 miles? Heavy new supply typically softens prices + rents 12–24 months out; constrained supply supports both.
Investment metrics
- 1% rule
- 0.98% ✗
- Cap rate
- 6.71%
- Cash-on-cash
- 1.49%
- DSCR
- 1.07
- GRM
- 8.5
CMA / ARV
- ARV (on-the-fly)
- $291,200
- Comps found
- 12
Show comp detail 12 sales within ~0.75 mi
| Address | Dist | Beds/Ba | Sqft | Sold | Price | $/sf | Match |
|---|---|---|---|---|---|---|---|
| 2933 Hudson St | 0.00mi | 2/2.0 | 1,120 (0%) | 1mo | $235,000 | $210 | 95 |
| 2731 Fait Ave | 0.16mi | 2/2.0 | 1,097 (-2%) | 0mo | $285,000 | $260 | 85 |
| 806 S Bouldin St | 0.22mi | 2/2.5 | 1,080 (-4%) | 1mo | $360,000 | $333 | 77 |
| 3033 Elliott St | 0.23mi | 2/2.5 | 1,180 (+5%) | 1mo | $310,000 | $263 | 73 |
| 922 S Bouldin St | 0.21mi | 2/2.0 | 1,202 (+7%) | 1mo | $352,000 | $293 | 73 |
| 1008 S Clinton St | 0.26mi | 3/1.0 (+1) | 1,176 (+5%) | 1mo | $200,000 | $170 | 73 |
| 816 S Dean St | 0.46mi | 2/1.5 | 1,088 (-3%) | 2mo | $279,900 | $257 | 71 |
| 520 S Bouldin St | 0.32mi | 2/1.5 | 1,212 (+8%) | 1mo | $345,000 | $285 | 68 |
| 2702 Lighthouse Pt E #522 | 0.34mi | 2/2.0 | 1,050 (-6%) | 2mo | $375,000 | $357 | 68 |
| 14 S Curley St | 0.66mi | 2/1.0 | 1,092 (-2%) | 1mo | $269,000 | $246 | 64 |
| 280 S Robinson St | 0.46mi | 2/1.0 | 1,282 (+14%) | 1mo | $294,000 | $229 | 54 |
| 309 S Fagley St | 0.70mi | 2/2.0 | 1,030 (-8%) | 1mo | $225,000 | $218 | 49 |
Match score weights: distance 35% · size 25% · config 20% · recency 20%. Top-matched comps best support the ARV.
Projected returns pro-forma
-3.0% appreciation · 1.31% rent growth · sell at horizon
- IRR
- -15.9%
- Equity multiple
- 0.44×
- Total profit
- $-35,831
- Equity at exit
- $34,279
- IRR
- -10.9%
- Equity multiple
- 0.39×
- Total profit
- $-39,158
- Equity at exit
- $19,878
Cash invested: $64,372 (down + closing). Projections, not guarantees.
Landlord ↔ Tenant lean methodology
- Overall (CITY)
- 12 Strongly Tenant-Friendly
- State Maryland
- 27 Tenant-Leaning · D+14
- County
- — inherits STATE
- City Baltimore
- 12 Strongly Tenant-Friendly · D+58
ZIP-level market 21224
- Rents YoY
- 1.3%
- Active inventory
- 391
- Price-to-rent
- 8.5×
Monthly cashflow live
- Estimated rent
- $2,247 high interval (Pro) →
- Mortgage (P&I)
- −$1,206
- Tax from tax record
- −$394 /mo · $4,724/yr
- Insurance
- −$96
- HOA
- −$0
- Vacancy / Maint / Mgmt
- −$472
- Net cashflow
- $80
Break-even live
UW: 25.0% down · 7.5% · 30yr · 1.5% tax · 5.0% vac · 8.0% maint · 8.0% mgmt
Financing live
Cash to close
- Down payment
- $57,475
- Closing costs
- $6,897
- Reserves months
- —
- Total cash needed
- —
Loan-product check · same deal, 3 products live
Conventional
25% down · 7.5% · 30yr
- Down + closing
- —
- Monthly P&I
- —
- Monthly cashflow
- —
- DSCR
- —
- Eligible?
- —
Personal DTI + credit; lowest rate.
DSCR
20% down · 8.5% · 30yr
- Down + closing
- —
- Monthly P&I
- —
- Monthly cashflow
- —
- DSCR
- —
- Eligible?
- —
No personal income docs; deal must DSCR.
Hard money
10% down · 12.0% · 12mo
- Down + closing
- —
- Monthly P&I
- —
- Monthly cashflow
- —
- DSCR
- —
- Eligible?
- —
Short-term bridge; refi at stabilization.
Rent comps 40 comps
| Address | Beds | Baths | Sqft | Rent | $/sqft | DOM | Units | Dist |
|---|---|---|---|---|---|---|---|---|
| 825 S Linwood Ave Baltimore, MD | 1.0 | 1.0 | 1000 | $2,150 | $2.15 | 23d | 1 | 0.05mi |
| 3036 Hudson St Baltimore, MD | 2.0 | 2.5 | 1428 | $2,600 | $1.82 | 43d | 1 | 0.11mi |
| 3018 O Donnell St Unit 2R Baltimore, MD | 1.0 | 1.0 | 750 | $1,700 | $2.27 | 43d | 1 | 0.13mi |
| 643 S Potomac St Baltimore, MD | 2.0 | 1.0 | 785 | $1,650 | $2.10 | 43d | 1 | 0.17mi |
| 3200 Fait Ave Baltimore, MD | 1.0 | 1.0 | 800 | $1,700 | $2.12 | 1d | 1 | 0.23mi |
| 1209 S Ellwood Ave Baltimore, MD | 2.0 | 2.0 | 1188 | $2,250 | $1.89 | 43d | 1 | 0.26mi |
| 2639 Boston St #210 Baltimore, MD | 2.0 | 2.0 | 784 | $2,150 | $2.74 | 43d | 1 | 0.28mi |
| 3245 Fait Ave Baltimore, MD | 3.0 | 2.0 | 1470 | $2,900 | $1.97 | 43d | 1 | 0.29mi |
| 2809 Boston St Baltimore, MD | 1.0–3.0 | 1.0–3.0 | 1246 | $2,868 | $2.30 | 1d | 11 | 0.29mi |
| 2515 Boston St Baltimore, MD | 1.0 | 1.0 | 1077 | $1,900 | $1.76 | 19d | 1 | 0.32mi |
| 825 S Port St Baltimore, MD | 2.0 | 1.5 | 1316 | $2,800 | $2.13 | 43d | 1 | 0.36mi |
| 3232 Eastern Ave Baltimore, MD | 1.0 | 1.5 | 874 | $2,260 | $2.59 | 1d | 1 | 0.42mi |
| 3518 Elliott St Baltimore, MD | 3.0 | 2.5 | 1036 | $2,800 | $2.70 | 17d | 1 | 0.46mi |
| 3610 Dillon St Baltimore, MD | 1.0–2.0 | 1.0–2.0 | 828 | $2,820 | $3.41 | 43d | 1 | 0.47mi |
| 400 S Highland Ave Unit 402 Baltimore, MD | 2.0 | 1.0 | 900 | $1,700 | $1.89 | 43d | 1 | 0.48mi |
| 1200 S Conkling St Baltimore, MD | 1.0–2.0 | 1.0–2.0 | 1085 | $2,933 | $2.70 | 1d | 16 | 0.49mi |
| 400 S Conkling St Unit 3 Baltimore, MD | 1.0 | 1.0 | 700 | $1,700 | $2.43 | 43d | 1 | 0.55mi |
| 2210 Cambridge St Baltimore, MD | 3.0 | 3.5 | 1450 | $2,725 | $1.88 | 43d | 1 | 0.56mi |
| 513 S Madeira St Baltimore, MD | 2.0 | 2.0 | 1132 | $2,000 | $1.77 | 4d | 1 | 0.58mi |
| 3700 Toone St Baltimore, MD | 1.0–2.0 | 1.0–2.0 | 1093 | $3,218 | $2.94 | 1d | 28 | 0.58mi |
| 235 S Highland Ave Baltimore, MD | 2.0 | 1.5 | 1222 | $2,000 | $1.64 | 23d | 1 | 0.59mi |
| 3801 Fleet St Unit 209 Baltimore, MD | 1.0 | 1.5 | 814 | $1,899 | $2.33 | 43d | 1 | 0.60mi |
| 127 S Robinson St Baltimore, MD | 2.0 | 1.5 | 1400 | $2,000 | $1.43 | 43d | 1 | 0.61mi |
| 411 S Madeira St Baltimore, MD | 2.0 | 2.0 | 1312 | $2,150 | $1.64 | 43d | 1 | 0.62mi |
| 102 S Curley St Baltimore, MD | 2.0 | 1.5 | 1200 | $1,800 | $1.50 | 4d | 1 | 0.62mi |
| 1211 S Eaton St Unit 5020 Baltimore, MD | 1.0 | 1.0 | 832 | $2,534 | $3.05 | 43d | 1 | 0.62mi |
| 1211 S Eaton St Unit 6046 Baltimore, MD | 1.0 | 1.0 | 774 | $2,325 | $3.00 | 16d | 1 | 0.62mi |
| 1211 S Eaton St Unit 7020 Baltimore, MD | 1.0 | 1.0 | 832 | $2,400 | $2.88 | 23d | 1 | 0.62mi |
| 1211 S Eaton St Unit 8038 Baltimore, MD | 1.0 | 1.0 | 1037 | $2,475 | $2.39 | 16d | 1 | 0.62mi |
| 1211 S Eaton St Unit 6012 Baltimore, MD | 1.0 | 1.0 | 774 | $2,554 | $3.30 | 21d | 1 | 0.62mi |
| 1211 S Eaton St Unit 8041 Baltimore, MD | 1.0 | 1.0 | 768 | $2,300 | $2.99 | 23d | 1 | 0.62mi |
| 1211 S Eaton St Unit 6010 Baltimore, MD | 1.0 | 1.0 | 774 | $2,325 | $3.00 | 21d | 1 | 0.62mi |
| 1211 S Eaton St Unit 5012 Baltimore, MD | 1.0 | 1.0 | 774 | $2,325 | $3.00 | 23d | 1 | 0.62mi |
| 106 S Bouldin St Baltimore, MD | 2.0 | 3.0 | 1134 | $2,100 | $1.85 | 20d | 1 | 0.66mi |
| 611 Grundy St Baltimore, MD | 3.0 | 2.0 | 1434 | $2,700 | $1.88 | 23d | 1 | 0.68mi |
| 201 S Conkling St Baltimore, MD | 1.0 | 1.0 | 740 | $1,500 | $2.03 | 2d | 2 | 0.69mi |
| 3905 Bank St Baltimore, MD | 4.0 | 1.0–3.0 | 909 | $2,350 | $2.58 | 2d | 20 | 0.69mi |
| 305 S Collington Ave Baltimore, MD | 3.0 | 2.5 | 722 | $2,895 | $4.01 | 17d | 1 | 0.69mi |
| 328 S Collington Ave Baltimore, MD | 2.0 | 2.0 | 1100 | $2,300 | $2.09 | 43d | 1 | 0.70mi |
| 3850 Boston St Baltimore, MD | 2.0 | 1.0–2.0 | 854 | $3,378 | $3.96 | 2d | 22 | 0.71mi |
Listing history 29 events
-
2026-04-27status Pending
-
2026-04-02price $229,900
-
2026-03-09price $234,900
-
2026-01-16$239,900 Active
-
2017-07-17historical Withdrawn
-
2017-07-17historical
-
2017-06-29price
-
2017-06-07price
-
2017-05-19price
-
2017-04-02price
-
2017-02-21price
-
2017-02-01status Active
-
2017-02-01
-
2017-02-01historical
-
2017-02-01$229,000
-
2007-06-08historical
-
2007-04-24
-
2007-04-24historical
-
2007-02-16
-
2003-08-28soldstatus $213,000
-
2003-07-16soldstatus $213,000
-
2003-06-06historical
-
2003-03-20$219,000
-
2002-08-12soldstatus $105,000
-
2002-07-05soldstatus $105,000
-
2002-05-16$105,000
-
2002-05-16historical
-
2002-04-29historical
-
2002-02-02
ⓘ Source: listings_history table (triggers on properties + properties_extension) + one-shot
backfill from property_details.listing_events for pre-trigger history.
Tax reassessment forecast MD · Partial reset (capped growth)
- Current annual tax
- $4,724 · $394/mo
- Projected year-2 tax
- $4,724 · $394/mo
- Expected delta
- $0/yr ($0/mo · 0.0%)
ⓘ Screening estimate from a state-policy table — verify with the county assessor before closing.
Climate risk First Street
- Flood 1/10 Low FEMA zone X (unshaded) · 0% chance over 30 yrs
- Wildfire 1/10 Low
- Heat 8/10 Severe 7 d/yr ≥103°F today · 15 d/yr by 30 yrs out
- Wind 6/10 Major 27% chance of damaging wind over 30 yrs
- Air quality 4/10 Moderate 6 unhealthy d/yr today · 7 by 30 yrs out
Nearby sold comps map
Loading sold comps map…
Walkable amenities ~0.75 mi
Loading nearby amenities…
Taxation est. · year 1
- Rental income
- $26,960
- − Mortgage interest
- −$12,878
- − Property taxes
- −$4,724
- − Insurance
- −$1,150
- − Repairs & maintenance
- −$2,157
- − Management
- −$2,157
- − Depreciation
- −$6,688
- Taxable loss
- −$2,793
- Est. tax savings @ 24.0%
- +$670
- After-tax cash flow
- $1,628/yr
For passive investors: Depreciation is non-cash, so a rental often shows a tax loss while cash-flowing — sheltering income. Rental losses are passive: they offset passive income freely, and up to $25,000/yr can offset ordinary (W-2) income if you actively participate and your MAGI is under $100k (phasing out to $0 by $150k); unused losses carry forward. On sale, claimed depreciation is recaptured at up to 25%, and gains may owe capital-gains tax (a 1031 exchange can defer both). Figures are a year-1 estimate at your 24.0% rate — not tax advice; consult a CPA.
Schools (NCES district)
- District
- Baltimore City Public Schools
- NCES district ID
- 2400090
- Math proficiency
- 7% ▼ -9.00%
- Reading proficiency
- 16% ▼ -5.00%
- Median HH income
- $42,108
- Composite
- 10.08/100
- National rank
- #9805
- State rank
- #24 of 24 in MD
Livability — Baltimore
- Score
- 76/100
- State rank
- #90
- US rank
- #3396
Category grades
Schools grade is shown separately in the Schools card above.
Census & demographics
- Census place
- Baltimore, MD
- County
- Baltimore City · 558,601 people
- City population
- 588,727
- Metro
- Baltimore-Columbia-Towson, MD
- Population (ZIP)
- 47,465
- Household income
- $89,017
- Rent vs Own
- Severe rent burden
- 1786.0
Population outlook (Baltimore County) Hauer SSP2
- Today (2025)
- 624,249 people
- By 2030
- 621,541 · -0.4%
- By 2040
- 609,756 · -2.3%
- By 2050
- 597,249 · -4.3%
- By 2075
- 552,236 · -11.5%
- By 2100
- 513,934 · -17.7%
Race, ethnicity, and origin ACS 2023
- Neighborhood character
- Diverse neighborhood (Simpson 0.62)
- Race & ethnicity
- White 55% Hispanic / Latino 21% Black 16% Two or more races 7% Asian 4%
- Hispanic origin (detail)
- Mexican 4% Puerto Rican 2% Dominican 1%
- Common ancestry
- Romanian 5% Lithuanian 2% Italian 1%
- Foreign-born
- 17% · Canada, China, Vietnam
- Languages at home
- 76% English-only · Spanish 18% Other Indo-European 2% Russian/Polish/Slavic 1%
Political lean MEDSL · Baltimore
- 2024 margin
- Solid D (+73.0) · D 85.2% · R 12.2% · Other 2.6%
- 2008→2024 swing
- -2.5pp toward R · 2008: 75.5pp · 2024: 73.0pp
- All cycles
- 2024: D+73.0 2020: D+76.6 2016: D+74.6 2012: D+76.4 2008: D+75.5
Not yet ingested
- Civics
- —
Market trends
- HPI YoY
- ▼ -332.23%
- Current HPI
- 241.284
- Rent YoY
- ▲ 1.31%
- Metro
- Baltimore-Columbia-Towson, MD
- State GDP YoY
- ▲ 2.97%
- F500 in state
- 12
Industry mix (Fortune 500 HQ in MD)
| Industry | F500 HQs | Revenue |
|---|---|---|
| Aerospace / Defense | 1 | $71B |
|
||
| Utilities | 1 | $25B |
|
||
| Hotels | 1 | $24B |
|
||
| Consumer Goods | 1 | $7B |
|
||
| Real Estate | 1 | $6B |
|
||
| Chemicals | 1 | $2B |
|
||
Price history
+119.0% since first listed29 events — show timeline
- 2026-04-27 Pending — BRIGHT MLS
- 2026-04-02 Price Changed $229,900 BRIGHT MLS
- 2026-03-09 Price Changed $234,900 BRIGHT MLS
- 2026-01-16 Listed $239,900 BRIGHT MLS
- 2017-07-17 Listing Removed — BRIGHT MLS
- 2017-07-17 Delisted — MRIS
- 2017-06-29 Price Changed — MRIS
- 2017-06-07 Price Changed — MRIS
- 2017-05-19 Price Changed — MRIS
- 2017-04-02 Price Changed — MRIS
- 2017-02-21 Price Changed — MRIS
- 2017-02-01 Relisted — MRIS
- 2017-02-01 Listed $229,000 BRIGHT MLS
- 2017-02-01 Delisted — MRIS
- 2017-02-01 Listed — MRIS
- 2007-06-08 Delisted — MRIS
- 2007-04-24 Delisted — MRIS
- 2007-04-24 Listed — MRIS
- 2007-02-16 Listed — MRIS
- 2003-08-28 Sold (Public Records) $213,000 Public Records
- 2003-07-16 Sold (MLS) $213,000 MRIS
- 2003-06-06 Delisted — MRIS
- 2003-03-20 Listed $219,000 MRIS
- 2002-08-12 Sold (Public Records) $105,000 Public Records
- 2002-07-05 Sold (MLS) $105,000 MRIS
- 2002-05-16 Listed $105,000 MRIS
- 2002-05-16 Delisted — MRIS
- 2002-04-29 Delisted — MRIS
- 2002-02-02 Listed — MRIS
Property tax history
-0.7%/yrLatest (2025): $4,724 · -4.3% YoY. Source: county tax records.
Cash-flow waterfall
monthlySold comps — $/sqft
last 12 mo · ≤1 miLoading sold comps…