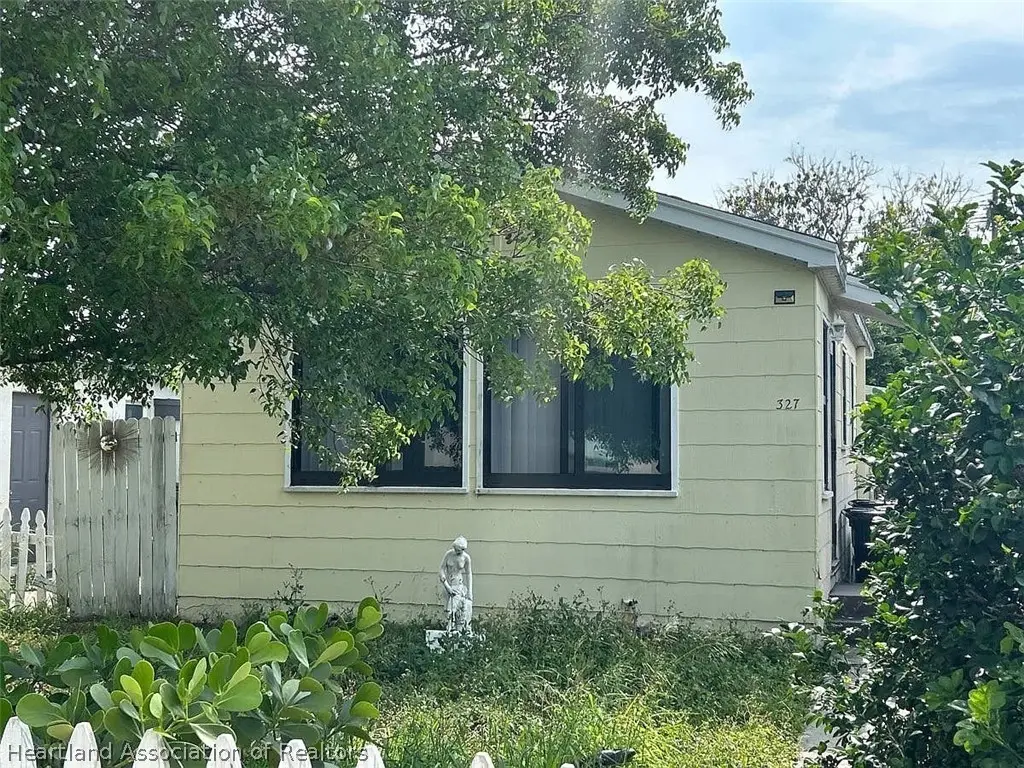
327 N H St · Lake Worth Beach, FL
Flood risk 1/10 · Minimal
- FEMA flood zone
- X (unshaded)
- Chance of flooding over 30 yrs
- 0.0%
- Est. flood insurance / yr
- $507 – $1,088
Fire risk 1/10 · Minimal
- Est. fire insurance / yr
- $947 – $1,759
Heat risk 10/10 · Severe
- Hot days now (above 105°F)
- 7 days/yr
- Hot days in 30 yrs
- 26 days/yr
Wind risk 10/10 · Severe
- Chance of severe wind over 30 yrs
- 99.0%
Air-quality risk 2/10 · Minimal
- Unhealthy air days now
- 0 days/yr
- Unhealthy air days in 30 yrs
- 2 days/yr
Risk factors via First Street. Map © Google.
Why this score? — see what drove the D+ grade
The composite is a weighted blend of 9 inputs, each scored 0–100. Each bar is that input's sub-score; the figure is the points it added to the 100-point composite (weight × sub-score).
- Cash flow +15.0/30.0
- ARV discount +7.5/15.0
- 1% rule +5.0/10.0
- DSCR +5.0/10.0
- Schools +4.3/10.0
- Rent growth +3.4/5.0
- Livability +2.5/5.0
- Condition / age +2.5/5.0
- Appreciation +0.0/10.0
$5,000
🖨 Deal sheet 📄 Offer letter ✓ Due diligence
Listing remarks MLS
Location! Location !! Location!!! The property is located in the city of Lake Worth, close to shopping complex, super markets, Rail Roads, Highways, Schools and many more. Perfect for the investors or owner living.
Key facts
- 3,485 sq ft lot
- Built 1925
- Listed 7 days
Property features AI
Finance
- Financial info: Zoning: MU-DIXIE
Exterior
- Parking: Driveway; On-street parking
- Utilities: Other water source; Other sewer
- Home design: Single family residence; One level; Residential property
- Construction: Construction details: see remarks
- Exterior features: Front porch; Other roof
Interior
- Bedrooms: 1 total room (studio/open layout)
- Flooring: Other
- Bathrooms: 1 full bathroom
- Heating & cooling: No heating; No cooling
- Interior features: Other flooring
Neighborhood map
What this means for you Summary
Snapshot
- This is a 2-bed/1.0-bath single-family listed at $5k.
Deal economics
- At list price, monthly cash flow is $1k ($16k/yr) — positive.
- The deal already cash-flows at list — no discount required.
- Meets the 1% rule at list price ($2k rent vs $5k).
Location & tenants
- Location reads: area grade D — affects rentability + tenant quality, not the cash-flow math above.
- Palm Beach (suburban): math 46% / reading 53% proficiency, ranked #34 of 73 in FL (top 47%) — families likely to look elsewhere, expect single-tenant / working-renter base with shorter leases.
- Market conditions: Rents rising (+3.5%/yr); 249 active listings in the ZIP; 40 comparable units currently listed for rent nearby; rentals at typical pace (median 25d on market — plan ~3-4 weeks tenant-placement turnaround); 3,974 units permitted in Palm Beach County in 2024 (1,012 in 5+ unit buildings).
- This rent runs 34% of the median local income ($62k/yr) — at the standard rent-burdened threshold; future hikes will face affordability resistance.
Forward outlook
- Local home prices are declining (-3.0%/yr); year-one equity from $35 of loan paydown is wiped out by about $150 of value loss. Plan a longer hold.
- Palm Beach County population projected at +30% by 2050 — long-run rental-demand tailwind backs the buy-and-hold thesis.
- At projected returns (-3.0% appreciation + 3.5% rent growth), your $1k cash investment doubles in ~1 year — after that, you're playing with house money.
Negotiation context
- Only 7 days on market — expect competitive offers; lowballing is unlikely to land.
- 6 sale attempts since 18y ago with the ask held roughly flat each time — persistent listings suggest the price (not the market) is what's stuck; bring a comps-based counter.
Risks & watch-outs
- Watch-outs: built in 1925 — expect roof / HVAC / electrical / plumbing capex.
- Climate carrying-cost: severe wind risk, 99% chance of damaging wind over 30y; extreme-heat days projected 7→26/yr by 2055 (HVAC capex compounding) — expect insurance premiums to compound above CPI over the hold.
Questions for the listing agent
- Built in 1925 — when were the roof, HVAC, electrical panel, plumbing, and water heater last replaced?
- Is there a deadline driving the sale (1031 exchange, divorce, estate, relocation)? That informs how much negotiation room exists.
- The area grade is low — what's the realistic commute time and amenity access for the typical tenant pool here? Any planned neighborhood developments (good or bad) we should know about?
- What's the average days-on-market for RENTAL listings here right now (not sales)? A rising rental-DOM trend means longer vacancies and softer asking-rent achievability than the comps imply.
- What's the recent tenant-quality profile in this submarket — average credit score on applications, eviction rate, late-payment / NSF rate, and stable-employment percentage? A property-management company in the area should have these aggregated.
- How much new for-sale + rental construction is in the pipeline within 1–3 miles? Heavy new supply typically softens prices + rents 12–24 months out; constrained supply supports both.
Investment metrics
- 1% rule
- 35.36% ✓
- Cap rate
- 333.19%
- Cash-on-cash
- 1167.50%
- DSCR
- 52.95
- GRM
- 0.2
CMA / ARV
No comps found within radius.
Projected returns pro-forma
-3.0% appreciation · 3.53% rent growth · sell at horizon
- IRR
- —
- Equity multiple
- 63.08×
- Total profit
- $86,916
- Equity at exit
- $746
- IRR
- —
- Equity multiple
- 137.74×
- Total profit
- $191,432
- Equity at exit
- $432
Cash invested: $1,400 (down + closing). Projections, not guarantees.
Landlord ↔ Tenant lean methodology
- Overall (STATE)
- 87 Strongly Landlord-Friendly
- State Florida
- 87 Strongly Landlord-Friendly · R+3
- County
- — inherits STATE
- City
- — inherits STATE
ZIP-level market 33460
- Rents YoY
- 3.5%
- Active inventory
- 249
- Price-to-rent
- 0.2×
Monthly cashflow live
- Estimated rent
- $1,768 high interval (Pro) →
- Mortgage (P&I)
- −$26
- Tax est. 1.5%
- −$6 /mo · $75/yr
- Insurance
- −$2
- HOA
- −$0
- Vacancy / Maint / Mgmt
- −$371
- Net cashflow
- $1,362
Break-even live
UW: 25.0% down · 7.5% · 30yr · 1.5% tax · 5.0% vac · 8.0% maint · 8.0% mgmt
Financing live
Cash to close
- Down payment
- $1,250
- Closing costs
- $150
- Reserves months
- —
- Total cash needed
- —
Loan-product check · same deal, 3 products live
Conventional
25% down · 7.5% · 30yr
- Down + closing
- —
- Monthly P&I
- —
- Monthly cashflow
- —
- DSCR
- —
- Eligible?
- —
Personal DTI + credit; lowest rate.
DSCR
20% down · 8.5% · 30yr
- Down + closing
- —
- Monthly P&I
- —
- Monthly cashflow
- —
- DSCR
- —
- Eligible?
- —
No personal income docs; deal must DSCR.
Hard money
10% down · 12.0% · 12mo
- Down + closing
- —
- Monthly P&I
- —
- Monthly cashflow
- —
- DSCR
- —
- Eligible?
- —
Short-term bridge; refi at stabilization.
Rent comps 40 comps
| Address | Beds | Baths | Sqft | Rent | $/sqft | DOM | Units | Dist |
|---|---|---|---|---|---|---|---|---|
| 317 N H St Unit B Lake Worth Beach, FL | 1.0 | 1.0 | 420 | $1,200 | $2.86 | 24d | 1 | 0.03mi |
| 312 N H St Unit A Lake Worth Beach, FL | 2.0 | 2.0 | 594 | $2,200 | $3.70 | 24d | 1 | 0.03mi |
| 417 N K St Unit 1A Lake Worth Beach, FL | 1.0 | 1.0 | 620 | $1,550 | $2.50 | 5d | 1 | 0.17mi |
| 413 N E St Lake Worth Beach, FL | 2.0 | 1.0 | 646 | $2,000 | $3.10 | 24d | 1 | 0.22mi |
| 325 N L St Lake Worth Beach, FL | 2.0 | 1.0 | 500 | $1,600 | $3.20 | 24d | 1 | 0.22mi |
| 223 N E St Unit 4 Lake Worth Beach, FL | 1.0 | 1.0 | 650 | $1,695 | $2.61 | 24d | 1 | 0.22mi |
| 417 N E St Unit 39 Lake Worth Beach, FL | 1.0 | 1.0 | 700 | $1,550 | $2.21 | 24d | 1 | 0.23mi |
| 417 N E St Unit 36 Lake Worth Beach, FL | 1.0 | 1.0 | 650 | $1,550 | $2.38 | 12d | 1 | 0.23mi |
| 430 N L St Lake Worth Beach, FL | 1.0 | 1.0 | 523 | $2,190 | $4.19 | 19d | 1 | 0.26mi |
| 430 N L St Lake Worth Beach, FL | 1.0 | 1.0 | 523 | $2,475 | $4.73 | 24d | 1 | 0.26mi |
| 526 6th Ave N Unit 519 Lake Worth Beach, FL | 1.0 | 1.0 | 700 | $1,395 | $1.99 | 22d | 1 | 0.32mi |
| 509 6th Ave N Unit 3B Lake Worth, FL | 1.0 | 1.0 | 540 | $1,595 | $2.95 | 24d | 1 | 0.32mi |
| 1307 Lucerne Ave Unit 1 Lake Worth Beach, FL | 1.0 | 1.0 | 528 | $1,400 | $2.65 | 24d | 1 | 0.33mi |
| 1307 Lucerne Ave Unit 1 Lake Worth Beach, FL | 1.0 | 1.0 | 528 | $1,325 | $2.51 | 5d | 1 | 0.33mi |
| 30 S J St #14 Lake Worth Beach, FL | 1.0 | 1.0 | 620 | $1,500 | $2.42 | 24d | 1 | 0.37mi |
| 35 S J St Lake Worth Beach, FL | 1.0 | 1.0 | 500 | $2,095 | $4.19 | 24d | 1 | 0.37mi |
| 625 N M St #1 Lake Worth Beach, FL | 1.0 | 1.0 | 640 | $1,600 | $2.50 | 24d | 1 | 0.37mi |
| 801 N H St #1 Lake Worth Beach, FL | 1.0 | 1.0 | 600 | $1,550 | $2.58 | 24d | 1 | 0.37mi |
| 702 N L St Lake Worth, FL | 1.0 | 1.0 | 643 | $1,474 | $2.29 | 5d | 2 | 0.39mi |
| 817 N J St Lake Worth, FL | 2.0 | 1.0 | 652 | $2,000 | $3.07 | 24d | 1 | 0.41mi |
| 721 N M St Lake Worth Beach, FL | 1.0 | 1.0 | 450 | $1,800 | $4.00 | 24d | 1 | 0.42mi |
| 14 S M St Apt 3 Lake Worth Beach, FL | 1.0 | 1.0 | 600 | $1,800 | $3.00 | 3d | 1 | 0.44mi |
| 626 N Federal Hwy Unit 3 Lake Worth Beach, FL | 1.0 | 1.0 | 640 | $1,600 | $2.50 | 24d | 1 | 0.45mi |
| 201 S J St #6 Lake Worth Beach, FL | 2.0 | 1.0 | 680 | $1,950 | $2.87 | 15d | 1 | 0.47mi |
| 201 S J St Lake Worth, FL | 1.0–2.0 | 1.0 | 570 | $1,950 | $3.42 | 19d | 2 | 0.47mi |
| 717 2nd Ave S Unit 5 Lake Worth Beach, FL | 1.0 | 1.0 | 550 | $1,995 | $3.63 | 24d | 1 | 0.47mi |
| 715 2nd Ave S Unit 3 Lake Worth Beach, FL | 1.0 | 1.0 | 550 | $1,995 | $3.63 | 15d | 1 | 0.48mi |
| 715 2nd Ave S Unit 1 Lake Worth Beach, FL | 1.0 | 1.0 | 550 | $1,995 | $3.63 | 24d | 1 | 0.48mi |
| 124 N Palmway Apt 5 Lake Worth Beach, FL | 1.0 | 1.0 | 624 | $1,525 | $2.44 | 24d | 1 | 0.52mi |
| 504 9th Ave N Unit 508 Lake Worth Beach, FL | 1.0 | 1.0 | 625 | $1,650 | $2.64 | 21d | 1 | 0.53mi |
| 120 N Palmway Unit 5 Lake Worth Beach, FL | 1.0 | 1.0 | 622 | $1,525 | $2.45 | 5d | 1 | 0.53mi |
| 405 2nd Ave S Unit 405 B Lake Worth Beach, FL | 1.0 | 1.0 | 680 | $1,350 | $1.99 | 24d | 1 | 0.57mi |
| 914 N Federal Hwy Unit 3 Lake Worth Beach, FL | 1.0 | 1.0 | 609 | $1,800 | $2.96 | 24d | 1 | 0.60mi |
| 318 S K St Unit 4 Lake Worth Beach, FL | 1.0 | 1.0 | 750 | $1,450 | $1.93 | 17d | 1 | 0.60mi |
| 912 11th Ave N Lake Worth Beach, FL | 1.0 | 1.0 | 600 | $1,100 | $1.83 | 21d | 1 | 0.61mi |
| 920 11th Ave N Unit 912 Lake Worth Beach, FL | 1.0 | 1.0 | 600 | $1,100 | $1.83 | 21d | 1 | 0.61mi |
| 210 S Ocean Breeze Lake Worth Beach, FL | 1.0 | 1.0 | 700 | $2,100 | $3.00 | 24d | 1 | 0.65mi |
| 225 Ocean Breeze Unit 2 Lake Worth Beach, FL | 1.0 | 1.0 | 625 | $1,525 | $2.44 | 24d | 1 | 0.65mi |
| 225 S B St Unit 3 Lake Worth Beach, FL | 1.0 | 1.0 | 503 | $1,449 | $2.88 | 8d | 1 | 0.65mi |
| 1118 N H St Unit 15 Lake Worth Beach, FL | 1.0 | 1.0 | 483 | $1,550 | $3.21 | 14d | 1 | 0.65mi |
Listing history 6 events
-
2026-06-09days on market $5,000 Active 7 DOM
-
2026-06-08days on market $5,000 Active 6 DOM
-
2026-06-07days on market $5,000 Active 5 DOM
-
2026-06-04days on market $5,000 Active 2 DOM
-
2026-06-02remarks 298-char remark
-
2026-06-02$5,000 Active 1 DOM
ⓘ Source: listings_history table (triggers on properties + properties_extension) + one-shot
backfill from property_details.listing_events for pre-trigger history.
Climate risk First Street
- Flood 1/10 Low FEMA zone X (unshaded) · 0% chance over 30 yrs
- Wildfire 1/10 Low
- Heat 10/10 Extreme 7 d/yr ≥105°F today · 26 d/yr by 30 yrs out
- Wind 10/10 Extreme 99% chance of damaging wind over 30 yrs
- Air quality 2/10 Low 0 unhealthy d/yr today · 2 by 30 yrs out
Nearby sold comps map
Loading sold comps map…
Walkable amenities ~0.75 mi
Loading nearby amenities…
Taxation est. · year 1
- Rental income
- $21,215
- − Mortgage interest
- −$280
- − Property taxes
- −$75
- − Insurance
- −$25
- − Repairs & maintenance
- −$1,697
- − Management
- −$1,697
- − Depreciation
- −$145
- Taxable income
- $17,295
- Est. tax owed @ 24.0%
- −$4,151
- After-tax cash flow
- $12,194/yr
For passive investors: Depreciation is non-cash, so a rental often shows a tax loss while cash-flowing — sheltering income. Rental losses are passive: they offset passive income freely, and up to $25,000/yr can offset ordinary (W-2) income if you actively participate and your MAGI is under $100k (phasing out to $0 by $150k); unused losses carry forward. On sale, claimed depreciation is recaptured at up to 25%, and gains may owe capital-gains tax (a 1031 exchange can defer both). Figures are a year-1 estimate at your 24.0% rate — not tax advice; consult a CPA.
Schools (NCES district)
- District
- Palm Beach
- NCES district ID
- 1201500
- Math proficiency
- 46% ▼ -16.00%
- Reading proficiency
- 53% ▼ -4.00%
- Median HH income
- $53,943
- Composite
- 42.72/100
- National rank
- #3160
- State rank
- #34 of 73 in FL
Livability — Lake Worth Beach
No livability data for this city. (Only ~50 U.S. cities are tracked.)
Census & demographics
- Census place
- Lake Worth Beach, FL
- County
- Palm Beach County · 1,438,312 people
- City population
- 129,577
- Metro
- Miami-Fort Lauderdale-Pompano Beach, FL
- Population (ZIP)
- 37,795
- Household income
- $62,090
- Rent vs Own
- Severe rent burden
- 2429.0
Population outlook (Palm Beach County) Hauer SSP2
- Today (2025)
- 1,637,487 people
- By 2030
- 1,743,255 · +6.5%
- By 2040
- 1,948,712 · +19.0%
- By 2050
- 2,132,979 · +30.3%
- By 2075
- 2,530,027 · +54.5%
- By 2100
- 2,706,979 · +65.3%
Race, ethnicity, and origin ACS 2023
- Neighborhood character
- Diverse neighborhood (Simpson 0.64)
- Race & ethnicity
- Hispanic / Latino 49% White 30% Two or more races 21% Black 17%
- Hispanic origin (detail)
- Mexican 5% Puerto Rican 5% Cuban 5% Dominican 2%
- Common ancestry
- Hispanic 8% Lithuanian 2% Slovak 1%
- Foreign-born
- 40% · Canada, Jamaica
- Languages at home
- 44% English-only · Spanish 42% French/Haitian/Cajun 9% Other Indo-European 2%
Political lean MEDSL · Palm Beach
- 2024 margin
- Toss-up / Even · D 50.0% · R 49.2%
- 2008→2024 swing
- -22.1pp toward R · 2008: 22.9pp · 2024: 0.8pp
- All cycles
- 2024: D+0.8 2020: D+12.8 2016: D+15.3 2012: D+17.0 2008: D+22.9
Not yet ingested
- Civics
- —
Market trends
- HPI YoY
- ▼ -345.65%
- Current HPI
- 484.2793
- Rent YoY
- ▲ 3.53%
- Metro
- Miami-Fort Lauderdale-Pompano Beach, FL
- State GDP YoY
- ▲ 3.28%
- F500 in state
- 36
Industry mix (Fortune 500 HQ in FL)
| Industry | F500 HQs | Revenue |
|---|---|---|
| Industrial Technology | 2 | $29B |
|
||
| Insurance | 2 | $17B |
|
||
| Retail | 1 | $60B |
|
||
| Technology Distribution | 1 | $58B |
|
||
| Homebuilding | 1 | $35B |
|
||
| Technology Manufacturing | 1 | $35B |
|
||
Price history
-92.7% since first listed20 events — show timeline
- 2026-06-02 Listed $5,000 HAOR as distributed by MLS GRID
- 2021-11-19 Sold (Public Records) $190,000 Public Records
- 2021-11-15 Sold (MLS) $190,000 Beaches MLS
- 2021-09-04 Contingent — Beaches MLS
- 2021-08-28 Price Changed $190,000 Beaches MLS
- 2021-08-25 Price Changed $194,500 Beaches MLS
- 2021-08-18 Listed $195,000 Beaches MLS
- 2017-11-08 Sold (Public Records) $115,000 Public Records
- 2017-11-08 Sold (MLS) $115,000 Beaches MLS
- 2017-11-08 Sold (MLS) $115,000 MARMLS
- 2017-08-31 Relisted — MARMLS
- 2017-08-16 Listing Removed — MARMLS
- 2017-08-15 Listed $119,000 MARMLS
- 2017-04-01 Price Changed $119,000 Beaches MLS
- 2017-03-03 Price Changed $109,000 Beaches MLS
- 2016-12-04 Price Changed $119,500 Beaches MLS
- 2016-06-06 Listed $125,000 Beaches MLS
- 2008-07-18 Sold (MLS) $50,400 Beaches MLS
- 2008-06-27 Listing Removed — Beaches MLS
- 2008-04-23 Listed $68,500 Beaches MLS
Property tax history
+14.0%/yrLatest (2025): $6,179 · +5.2% YoY. Source: county tax records.
Cash-flow waterfall
monthlySold comps — $/sqft
last 12 mo · ≤1 miLoading sold comps…