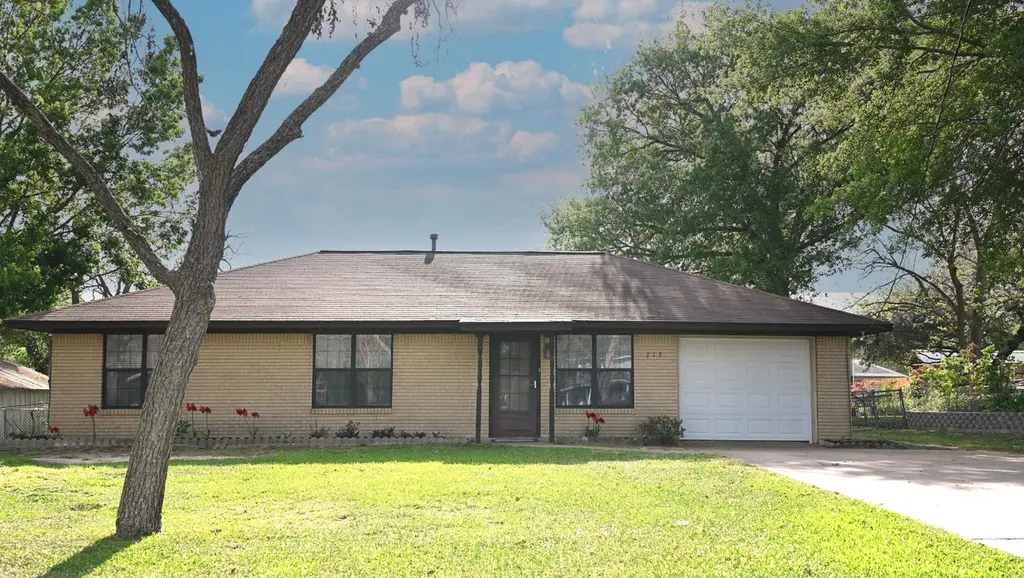
713 Burleson St · Brenham, TX
Flood risk 1/10 · Minimal
- FEMA flood zone
- X (unshaded)
- Chance of flooding over 30 yrs
- 0.0%
- Est. flood insurance / yr
- $507 – $1,088
Fire risk 4/10 · Minor
- Est. fire insurance / yr
- $1,222 – $2,270
Heat risk 8/10 · Major
- Hot days now (above 111°F)
- 7 days/yr
- Hot days in 30 yrs
- 23 days/yr
Wind risk 8/10 · Major
- Chance of severe wind over 30 yrs
- 99.0%
Air-quality risk 1/10 · Minimal
- Unhealthy air days now
- 0 days/yr
- Unhealthy air days in 30 yrs
- 0 days/yr
Risk factors via First Street. Map © Google.
Why this score? — see what drove the D grade
The composite is a weighted blend of 9 inputs, each scored 0–100. Each bar is that input's sub-score; the figure is the points it added to the 100-point composite (weight × sub-score).
- ARV discount +14.9/15.0
- Cash flow +10.8/30.0
- Schools +3.9/10.0
- Livability +3.8/5.0
- DSCR +3.1/10.0
- 1% rule +2.9/10.0
- Rent growth +2.5/5.0
- Condition / age +2.5/5.0
- Appreciation +0.0/10.0
$199,000
🖨 Deal sheet 📄 Offer letter ✓ Due diligence
Listing remarks MLS
The same owner has loved this property for over 60 years. This cherished home offers 2 bedrooms and 1 bathroom; however, it can easily be converted back into a 3 bedroom. This sunroom and storage shed are great additions to the property but the star to the show is the lot size, which is just shy of a half an acre. Schedule your tour of this special downtown Brenham gem. Buyer to verify all listing information.
Key facts
- Lot size
- Sunroom
- Storage shed
Tags
Neighborhood map
What this means for you Summary
Snapshot
- This is a 3-bed/1.0-bath single-family listed at $199k.
Deal economics
- At list price, monthly cash flow is $-90 ($-1k/yr) — negative.
- To cash-flow at today's rent, offer at most $183k (8.0% below list).
- To meet the 1% rule (rent ≥ 1% of price), the offer needs to be $158k (20.6% below list).
- Recommended offer: $158k (20.6% below list) — sets the bar for 1% rule.
- Cap rate 5.8% vs local median 2.7% in Brenham — top-decile yield for the area; either an underpriced asset or a hidden risk that comps aren't pricing in. Stress-test before assuming the spread holds.
Location & tenants
- Location reads 75/100 on livability (#136 in TX, #3,978 nationally) — a middle-class / working-renter tenant base. Strengths: cost of living A+, housing A+, amenities A; Watch: schools C-, employment C-, crime F.
- Brenham ISD (town): math 50% / reading 40% proficiency, ranked #263 of 826 in TX (top 32%) — families likely to look elsewhere, expect single-tenant / working-renter base with shorter leases.
- Market conditions: 514 active listings in the ZIP; 17 comparable units currently listed for rent nearby; rentals lingering (median 44d on market — plan ~5-8 weeks vacancy on turnover, expect pricing pressure); 100% of comp listings sitting > 30 days — soft ceiling on asking rent; 111 units permitted in Washington County in 2024 (0 in 5+ unit buildings).
Forward outlook
- Local home prices are declining (-3.0%/yr); year-one equity from $1k of loan paydown is wiped out by about $6k of value loss. Plan a longer hold.
- Washington County population projected at +16% by 2050 — long-run rental-demand tailwind backs the buy-and-hold thesis.
Negotiation context
- It's been on market 80 days — a 6% lower offer ($187k) is reasonable based on typical stale-listing flexibility.
Risks & watch-outs
- Climate carrying-cost: severe wind risk, 99% chance of damaging wind over 30y; extreme-heat days projected 7→23/yr by 2055 (HVAC capex compounding) — expect insurance premiums to compound above CPI over the hold.
Questions for the listing agent
- What do current leases actually rent for vs. the listed asking? Can we see a recent rent roll and the last 12 months of T-12 income?
- It's been on market 80 days. Have you received any prior offers? Is the seller open to a 21% concession, seller financing, or rate buy-down credit?
- Built in 1973 — when were the roof, HVAC, electrical panel, plumbing, and water heater last replaced?
- Why hasn't it sold? Are there any deal-killer items the seller is aware of (foundation, flood, title, zoning, code violations)?
- Is there a deadline driving the sale (1031 exchange, divorce, estate, relocation)? That informs how much negotiation room exists.
- Crime grade is F in this area — have there been break-ins, vandalism, or insurance claims at this property in the last 3 years? What carrier currently insures it and at what premium?
- The area grade is low — what's the realistic commute time and amenity access for the typical tenant pool here? Any planned neighborhood developments (good or bad) we should know about?
- What's the average days-on-market for RENTAL listings here right now (not sales)? A rising rental-DOM trend means longer vacancies and softer asking-rent achievability than the comps imply.
- What's the recent tenant-quality profile in this submarket — average credit score on applications, eviction rate, late-payment / NSF rate, and stable-employment percentage? A property-management company in the area should have these aggregated.
- How much new for-sale + rental construction is in the pipeline within 1–3 miles? Heavy new supply typically softens prices + rents 12–24 months out; constrained supply supports both.
Investment metrics
- 1% rule
- 0.79% ✗
- Cap rate
- 5.75%
- Cash-on-cash
- -1.94%
- DSCR
- 0.91
- GRM
- 10.5
CMA / ARV
- ARV (median comp)
- $238,383
- List price
- $199,000
- Delta
- -16.52%
- Verdict
- UNDERPRICED
- Comps
- 20 within 1.0 mi
Show comp detail 12 sales within ~0.75 mi
| Address | Dist | Beds/Ba | Sqft | Sold | Price | $/sf | Match |
|---|---|---|---|---|---|---|---|
| 704 Burleson St | 0.04mi | 3/2.0 | 1,026 (-9%) | 1mo | $254,900 | $248 | 77 |
| 205 Munz St | 0.73mi | 2/1.5 (-1) | 1,107 (-2%) | 2mo | $270,000 | $244 | 54 |
| 1253 Wilkins Valley St | 0.26mi | 3/2.0 | 1,297 (+15%) | 8mo | $242,785 | $187 | 53 |
| 1232 Wilkins Valley St | 0.24mi | 3/2.0 | 1,297 (+15%) | 8mo | $245,065 | $189 | 53 |
| 1208 Wilkins Valley St | 0.24mi | 3/2.0 | 1,297 (+15%) | 10mo | $244,765 | $189 | 52 |
| 1400 Cedar St | 0.58mi | 2/1.0 (-1) | 1,093 (-3%) | 13mo | $215,000 | $197 | 51 |
| 213 N Austin St | 0.39mi | 3/2.0 | 1,292 (+14%) | 5mo | $205,000 | $159 | 50 |
| 308 W Jefferson St | 0.34mi | 2/1.0 (-1) | 970 (-14%) | 7mo | $155,000 | $160 | 50 |
| 1004 Mill Creek Dr | 0.58mi | 2/2.0 (-1) | 1,042 (-8%) | 8mo | $179,900 | $173 | 44 |
| 207 Munz St | 0.72mi | 3/1.0 | 1,253 (+11%) | 12mo | $247,000 | $197 | 38 |
| 602 Alma St | 0.73mi | 2/1.0 (-1) | 996 (-12%) | 4mo | $349,000 | $350 | 38 |
| 1309 Hidden Creek Ln | 0.72mi | 3/2.0 | 1,029 (-9%) | 13mo | $285,000 | $277 | 37 |
Match score weights: distance 35% · size 25% · config 20% · recency 20%. Top-matched comps best support the ARV.
Projected returns pro-forma
-3.0% appreciation · 3.0% rent growth · sell at horizon
- IRR
- -19.5%
- Equity multiple
- 0.32×
- Total profit
- $-37,968
- Equity at exit
- $29,672
- IRR
- -12.3%
- Equity multiple
- 0.27×
- Total profit
- $-40,426
- Equity at exit
- $17,206
Cash invested: $55,720 (down + closing). Projections, not guarantees.
Landlord ↔ Tenant lean methodology
- Overall (STATE)
- 87 Strongly Landlord-Friendly
- State Texas
- 87 Strongly Landlord-Friendly · R+5
- County
- — inherits STATE
- City
- — inherits STATE
ZIP-level market 77833
- Active inventory
- 514
- Price-to-rent
- 10.5×
Monthly cashflow live
- Estimated rent
- $1,581 high interval (Pro) →
- Mortgage (P&I)
- −$1,044
- Tax from tax record
- −$212 /mo · $2,548/yr
- Insurance
- −$83
- HOA
- −$0
- Vacancy / Maint / Mgmt
- −$332
- Net cashflow
- $-90
Break-even live
UW: 25.0% down · 7.5% · 30yr · 1.5% tax · 5.0% vac · 8.0% maint · 8.0% mgmt
Financing live
Cash to close
- Down payment
- $49,750
- Closing costs
- $5,970
- Reserves months
- —
- Total cash needed
- —
Loan-product check · same deal, 3 products live
Conventional
25% down · 7.5% · 30yr
- Down + closing
- —
- Monthly P&I
- —
- Monthly cashflow
- —
- DSCR
- —
- Eligible?
- —
Personal DTI + credit; lowest rate.
DSCR
20% down · 8.5% · 30yr
- Down + closing
- —
- Monthly P&I
- —
- Monthly cashflow
- —
- DSCR
- —
- Eligible?
- —
No personal income docs; deal must DSCR.
Hard money
10% down · 12.0% · 12mo
- Down + closing
- —
- Monthly P&I
- —
- Monthly cashflow
- —
- DSCR
- —
- Eligible?
- —
Short-term bridge; refi at stabilization.
Rent comps 17 comps
| Address | Beds | Baths | Sqft | Rent | $/sqft | DOM | Units | Dist |
|---|---|---|---|---|---|---|---|---|
| 1003 Oakridge St Brenham, TX | 3.0 | 2.0 | 1452 | $1,750 | $1.21 | 43d | 1 | 0.22mi |
| 514 W Jefferson St Brenham, TX | 2.0 | 1.0 | 819 | $1,300 | $1.59 | 43d | 1 | 0.23mi |
| 1008 Oakridge St Brenham, TX | 3.0 | 2.0 | 1153 | $1,500 | $1.30 | 43d | 1 | 0.26mi |
| 910 N Park St Brenham, TX | 1.0–2.0 | 1.0 | 715 | $1,250 | $1.75 | 43d | 2 | 0.53mi |
| 309 McNeese St Brenham, TX | 2.0 | 1.0 | 877 | $1,400 | $1.60 | 43d | 1 | 0.55mi |
| 705 S Jackson St Brenham, TX | 2.0 | 1.0 | 1050 | $1,312 | $1.25 | 43d | 2 | 0.76mi |
| 500 College Ave Brenham, TX | 1.0–3.0 | 1.0–1.5 | 800 | $1,375 | $1.72 | 43d | 2 | 0.80mi |
| 704 E Academy St Brenham, TX | 2.0 | 1.0 | 816 | $1,250 | $1.53 | 43d | 1 | 0.85mi |
| 226 N Dixie St Brenham, TX | 3.0 | 2.0 | 1260 | $2,100 | $1.67 | 43d | 1 | 0.89mi |
| 707 Davy St Brenham, TX | 3.0 | 2.0 | 1315 | $1,955 | $1.49 | 43d | 1 | 0.89mi |
| 204 Cornish Dr Brenham, TX | 3.0 | 1.0 | 1242 | $1,450 | $1.17 | 43d | 1 | 0.96mi |
| 309 Duprie Dr Brenham, TX | 3.0 | 2.0 | 1094 | $1,550 | $1.42 | 43d | 1 | 0.97mi |
| 201 Ava Dr Brenham, TX | 3.0 | 2.0 | 1301 | $1,800 | $1.38 | 43d | 1 | 1.04mi |
| 1002 Garrett St Brenham, TX | 3.0 | 2.0 | 1084 | $1,450 | $1.34 | 43d | 1 | 1.09mi |
| 1000 Marie St Brenham, TX | 3.0 | 2.0 | 1322 | $1,450 | $1.10 | 43d | 1 | 1.16mi |
| 715 Sabine St Brenham, TX | 2.0 | 1.0 | 900 | $1,450 | $1.61 | 43d | 1 | 1.33mi |
| 809 Jersey Ln Brenham, TX | 2.0 | 1.0 | 884 | $1,300 | $1.47 | 43d | 1 | 1.46mi |
Listing history 17 events
-
2026-06-19days on market $199,000 Active 80 DOM
-
2026-06-18days on market $199,000 Active 79 DOM
-
2026-06-17days on market $199,000 Active 78 DOM
-
2026-06-16days on market $199,000 Active 77 DOM
-
2026-06-15days on market $199,000 Active 76 DOM
-
2026-06-14days on market $199,000 Active 74 DOM
-
2026-06-12days on market $199,000 Active 73 DOM
-
2026-06-09days on market $199,000 Active 70 DOM
-
2026-06-08days on market $199,000 Active 69 DOM
-
2026-06-07days on market $199,000 Active 68 DOM
-
2026-06-02days on market $199,000 Active 63 DOM
-
2026-06-01days on market $199,000 Active 62 DOM
-
2026-05-31days on market $199,000 Active 61 DOM
-
2026-05-30days on market $199,000 Active 60 DOM
-
2026-05-12price $199,000 413-char remark
Show marketing remark (413 chars)
The same owner has loved this property for over 60 years. This cherished home offers 2 bedrooms and 1 bathroom; however, it can easily be converted back into a 3 bedroom. This sunroom and storage shed are great additions to the property but the star to the show is the lot size, which is just shy of a half an acre. Schedule your tour of this special downtown Brenham gem. Buyer to verify all listing information.
-
2026-04-16price $219,000 413-char remark
Show marketing remark (413 chars)
The same owner has loved this property for over 60 years. This cherished home offers 2 bedrooms and 1 bathroom; however, it can easily be converted back into a 3 bedroom. This sunroom and storage shed are great additions to the property but the star to the show is the lot size, which is just shy of a half an acre. Schedule your tour of this special downtown Brenham gem. Buyer to verify all listing information.
-
2026-03-31$222,500 Active 413-char remark
Show marketing remark (413 chars)
The same owner has loved this property for over 60 years. This cherished home offers 2 bedrooms and 1 bathroom; however, it can easily be converted back into a 3 bedroom. This sunroom and storage shed are great additions to the property but the star to the show is the lot size, which is just shy of a half an acre. Schedule your tour of this special downtown Brenham gem. Buyer to verify all listing information.
ⓘ Source: listings_history table (triggers on properties + properties_extension) + one-shot
backfill from property_details.listing_events for pre-trigger history.
Tax reassessment forecast TX · Resets to sale price
- Current annual tax
- $2,548 · $212/mo
- Projected year-2 tax
- $3,642 · $303/mo
- Expected delta
- +$1,093/yr (+$91/mo · 42.9%)
ⓘ Screening estimate from a state-policy table — verify with the county assessor before closing.
Climate risk First Street
- Flood 1/10 Low FEMA zone X (unshaded) · 0% chance over 30 yrs
- Wildfire 4/10 Moderate
- Heat 8/10 Severe 7 d/yr ≥111°F today · 23 d/yr by 30 yrs out
- Wind 8/10 Severe 99% chance of damaging wind over 30 yrs
- Air quality 1/10 Low 0 unhealthy d/yr today · 0 by 30 yrs out
Nearby sold comps map
Loading sold comps map…
Walkable amenities ~0.75 mi
Loading nearby amenities…
Taxation est. · year 1
- Rental income
- $18,972
- − Mortgage interest
- −$11,147
- − Property taxes
- −$2,548
- − Insurance
- −$995
- − Repairs & maintenance
- −$1,518
- − Management
- −$1,518
- − Depreciation
- −$5,789
- Taxable loss
- −$4,543
- Est. tax savings @ 24.0%
- +$1,090
- After-tax cash flow
- $12/yr
For passive investors: Depreciation is non-cash, so a rental often shows a tax loss while cash-flowing — sheltering income. Rental losses are passive: they offset passive income freely, and up to $25,000/yr can offset ordinary (W-2) income if you actively participate and your MAGI is under $100k (phasing out to $0 by $150k); unused losses carry forward. On sale, claimed depreciation is recaptured at up to 25%, and gains may owe capital-gains tax (a 1031 exchange can defer both). Figures are a year-1 estimate at your 24.0% rate — not tax advice; consult a CPA.
Schools (NCES district)
- District
- Brenham ISD
- NCES district ID
- 4811280
- Math proficiency
- 50% ▼ -4.00%
- Reading proficiency
- 40% ▼ -4.00%
- Median HH income
- $48,090
- Composite
- 38.51/100
- National rank
- #4177
- State rank
- #263 of 826 in TX
Livability — Brenham
- Score
- 75/100
- State rank
- #136
- US rank
- #3978
Category grades
Schools grade is shown separately in the Schools card above.
Census & demographics
- Census place
- Brenham, TX
- County
- Washington County · 29,498 people
- City population
- 29,498
- Metro
- Brenham, TX
- Population (ZIP)
- 29,498
- Household income
- $73,388
- Rent vs Own
- Severe rent burden
- 614.0
Population outlook (Washington County) Hauer SSP2
- Today (2025)
- 37,557 people
- By 2030
- 38,789 · +3.3%
- By 2040
- 41,305 · +10.0%
- By 2050
- 43,687 · +16.3%
- By 2075
- 50,242 · +33.8%
- By 2100
- 53,235 · +41.7%
Race, ethnicity, and origin ACS 2023
- Neighborhood character
- Diverse neighborhood (Simpson 0.59)
- Race & ethnicity
- White 59% Hispanic / Latino 20% Black 16% Two or more races 12% Asian 2%
- Hispanic origin (detail)
- Mexican 18%
- Common ancestry
- Romanian 2% Lithuanian 2% Slovak 1%
- Foreign-born
- 7% · Canada, South Korea
- Languages at home
- 85% English-only · Spanish 12% Tagalog/Filipino 1% Russian/Polish/Slavic 1%
Political lean MEDSL · Washington
- 2024 margin
- Solid R (+54.7) · D 22.3% · R 77.0%
- 2008→2024 swing
- -12.0pp toward R · 2008: -42.7pp · 2024: -54.7pp
- All cycles
- 2024: R+54.7 2020: R+49.9 2016: R+51.3 2012: R+52.0 2008: R+42.7
Not yet ingested
- Civics
- —
Market trends
- HPI YoY
- ▼ -107.24%
- Current HPI
- 192.9078
- Rent YoY
- —
- Metro
- Brenham, TX
- State GDP YoY
- ▲ 3.95%
- F500 in state
- 110
Industry mix (Fortune 500 HQ in TX)
| Industry | F500 HQs | Revenue |
|---|---|---|
| Energy | 16 | $1,198B |
|
||
| Technology | 5 | $198B |
|
||
| Engineering / Construction | 4 | $72B |
|
||
| Energy Services | 3 | $60B |
|
||
| Utilities | 3 | $41B |
|
||
| Healthcare | 2 | $330B |
|
||
Price history
-10.6% since first listed3 events — show timeline
- 2026-05-12 Price Changed $199,000 HARMLS
- 2026-04-16 Price Changed $219,000 HARMLS
- 2026-03-31 Listed $222,500 HARMLS
Property tax history
+3.9%/yrLatest (2025): $2,548 · +12.2% YoY. Source: county tax records.
Cash-flow waterfall
monthlySold comps — $/sqft
last 12 mo · ≤1 miLoading sold comps…