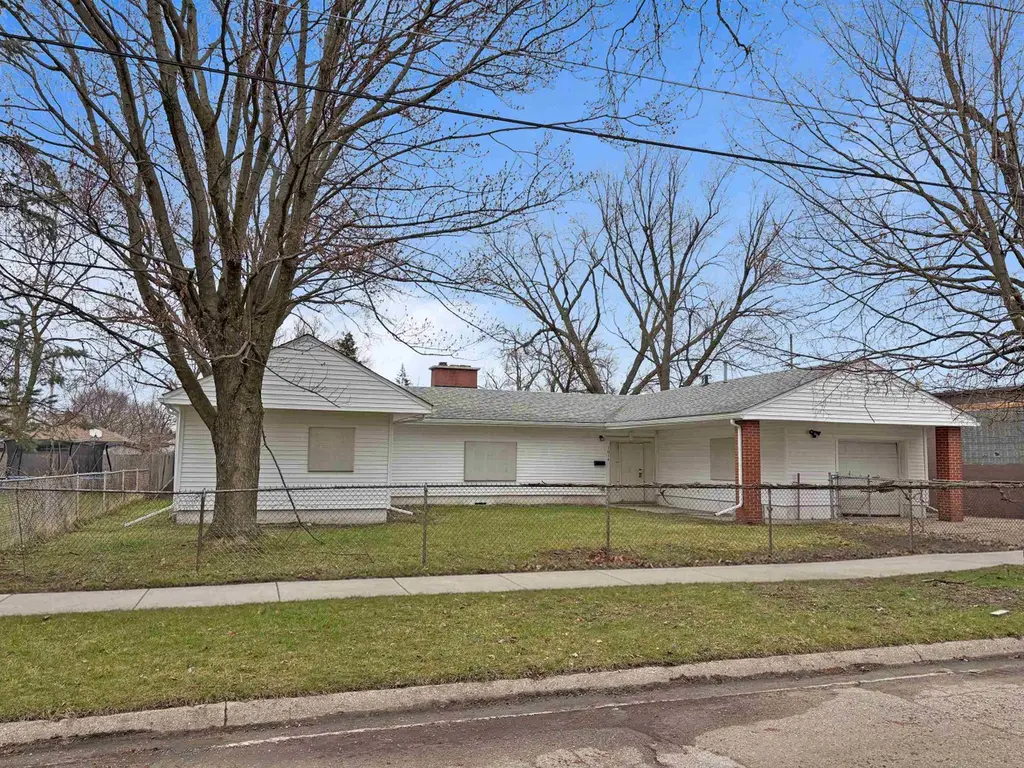
1014 Bloor Ave · Flint, MI
Flood risk 1/10 · Minimal
- FEMA flood zone
- X (unshaded)
- Chance of flooding over 30 yrs
- 0.0%
- Est. flood insurance / yr
- $507 – $1,088
Fire risk 1/10 · Minimal
- Est. fire insurance / yr
- $784 – $1,456
Heat risk 2/10 · Minimal
- Hot days now (above 97°F)
- 7 days/yr
- Hot days in 30 yrs
- 15 days/yr
Wind risk 2/10 · Minimal
- Chance of severe wind over 30 yrs
- —
Air-quality risk 3/10 · Minor
- Unhealthy air days now
- 3 days/yr
- Unhealthy air days in 30 yrs
- 4 days/yr
Risk factors via First Street. Map © Google.
Why this score? — see what drove the D+ grade
The composite is a weighted blend of 9 inputs, each scored 0–100. Each bar is that input's sub-score; the figure is the points it added to the 100-point composite (weight × sub-score).
- Cash flow +25.4/30.0
- DSCR +8.4/10.0
- 1% rule +6.5/10.0
- Livability +3.7/5.0
- Condition / age +2.5/5.0
- Rent growth +2.2/5.0
- Schools +1.1/10.0
- ARV discount +0.0/15.0
- Appreciation +0.0/10.0
$110,000
🖨 Deal sheet 📄 Offer letter ✓ Due diligence
Listing remarks MLS
Beautiful ranch style home with updates throughout. Property features 3 bedrooms, 1.5 bathrooms, formal and informal dining areas, large living room and kitchen. Updates throughout includes flooring, paint, counter tops, bathrooms, electrical and more in the interior. Vinyl siding, windows and roof on the exterior. This is a Fannie Mae HomePath property. First Time Buyers, complete the HomePath Ready Buyer homeownership course on Homepath.com. Attach certificate to offer up to 3% closing cost assistance. Check HomePath.com for more details. Restrictions apply.
Key facts
- 7,841 sq ft lot
- Garage
- Built 1948
Property features AI
Finance
- Other: Residential property managed/listed by REMAX Right Choice
- Financial info: No investor or income/expense details provided
- HOA & community: Homeowners association membership required
Exterior
- Parking: Attached garage with 1 parking space
- Security: No security features provided
- Utilities: Public water; Public sewer
- Home design: Single-family residence; One level
- Construction: Vinyl siding
- Exterior features: Lot approximately 80 x 100 (0.18 acres); Subdivision: CENTRAL PARK ADD; Cross streets: Bloor / Fenton
Interior
- Kitchen: No kitchen appliance details provided
- Bedrooms: No bedroom-specific details provided
- Flooring: No flooring details provided
- Bathrooms: 1 full bathroom; 1 half bathroom
- Heating & cooling: Forced air heating; Natural gas heating; No central cooling
- Interior features: Living room fireplace; Crawl space basement; Total of 7 rooms
- Laundry & utility: No laundry details provided
Neighborhood map
What this means for you Summary
Snapshot
- This is a 3-bed/1.5-bath single-family listed at $110k.
Deal economics
- At list price, monthly cash flow is $253 ($3k/yr) — positive.
- The deal already cash-flows at list — no discount required.
- Meets the 1% rule at list price ($1k rent vs $110k).
- Recommended offer: $107k (3.0% below list) — sets the bar for market timing.
- Cap rate 9.0% vs local median 11.5% in Flint — below-typical yield; the buyer is paying a premium for something (appreciation thesis, condition, location) that the cap rate doesn't capture.
Location & tenants
- Location reads 74/100 on livability (#196 in MI, #4,946 nationally) — a middle-class / working-renter tenant base. Strengths: commute A+, cost of living A+, housing A+; Watch: schools F, crime F, employment F.
- Flint School District (urban): math 7% / reading 13% proficiency, ranked #714 of 760 in MI (top 94%) — low school quality limits family demand, transient renter base, plan for 1-2y turnover; 83% free/reduced lunch — lower-income household profile, screen leases tightly.
- Market conditions: Rents soft (-1.0%/yr); 206 active listings in the ZIP; 1 comparable units currently listed for rent nearby; 419 units permitted in Genesee County in 2024 (68 in 5+ unit buildings).
- This rent runs 33% of the median local income ($47k/yr) — at the standard rent-burdened threshold; future hikes will face affordability resistance.
Forward outlook
- Local home prices are declining (-3.0%/yr); year-one equity from $761 of loan paydown is wiped out by about $3k of value loss. Plan a longer hold.
- Genesee County population projected at -27% by 2050 — secular population decline; favor cash flow + early exit over multi-decade hold.
Negotiation context
- It's been on market 52 days — a 3% lower offer ($107k) is reasonable based on typical stale-listing flexibility.
- 3 sale attempts since 21y ago; this cycle's ask has dropped $14k (11%) from the opening price — seller is motivated, your offer sets the floor, not the list.
- Current owner paid $63k; list at $110k implies a 75% gain — meaningful room to come down on a strong offer.
Risks & watch-outs
- Watch-outs: built in 1948 — expect roof / HVAC / electrical / plumbing capex.
Questions for the listing agent
- It's been on market 52 days. Have you received any prior offers? Is the seller open to a 3% concession, seller financing, or rate buy-down credit?
- Built in 1948 — when were the roof, HVAC, electrical panel, plumbing, and water heater last replaced?
- Is there a deadline driving the sale (1031 exchange, divorce, estate, relocation)? That informs how much negotiation room exists.
- Schools are F-rated, which usually means shorter tenancies and higher turnover. Who's the typical renter profile here, and what's been the actual vacancy rate?
- Crime grade is F in this area — have there been break-ins, vandalism, or insurance claims at this property in the last 3 years? What carrier currently insures it and at what premium?
- The area grade is low — what's the realistic commute time and amenity access for the typical tenant pool here? Any planned neighborhood developments (good or bad) we should know about?
- What's the average days-on-market for RENTAL listings here right now (not sales)? A rising rental-DOM trend means longer vacancies and softer asking-rent achievability than the comps imply.
- What's the recent tenant-quality profile in this submarket — average credit score on applications, eviction rate, late-payment / NSF rate, and stable-employment percentage? A property-management company in the area should have these aggregated.
- How much new for-sale + rental construction is in the pipeline within 1–3 miles? Heavy new supply typically softens prices + rents 12–24 months out; constrained supply supports both.
Investment metrics
- 1% rule
- 1.15% ✓
- Cap rate
- 9.05%
- Cash-on-cash
- 9.84%
- DSCR
- 1.44
- GRM
- 7.3
CMA / ARV
- ARV (on-the-fly)
- $73,923
- Comps found
- 12
Show comp detail 12 sales within ~0.75 mi
| Address | Dist | Beds/Ba | Sqft | Sold | Price | $/sf | Match |
|---|---|---|---|---|---|---|---|
| 2917 Fenton Rd | 0.10mi | 3/1.5 | 1,800 (-0%) | 4mo | $10,500 | $6 | 92 |
| 4117 Brunswick Ave | 0.69mi | 3/2.5 | 1,808 (+0%) | 0mo | $58,000 | $32 | 63 |
| 1033 Simcoe Ave | 0.13mi | 4/2.5 (+1) | 1,597 (-11%) | 10mo | $60,000 | $38 | 58 |
| 1421 Berrywood Ln | 0.63mi | 3/2.0 | 1,705 (-5%) | 15mo | $132,500 | $78 | 47 |
| 1741 Carmanbrook Pkwy | 0.72mi | 4/2.0 (+1) | 1,696 (-6%) | 4mo | $6,000 | $4 | 46 |
| 627 Campbell St | 0.71mi | 3/1.5 | 1,623 (-10%) | 5mo | $85,000 | $52 | 46 |
| 820 Pettibone Ave | 0.43mi | 3/2.5 | 2,026 (+12%) | 14mo | $75,000 | $37 | 43 |
| 3354 S Grand Traverse St | 0.58mi | 3/1.5 | 1,656 (-8%) | 22mo | $45,000 | $27 | 41 |
| 718 Freeman Ave | 0.41mi | 4/2.0 (+1) | 2,052 (+14%) | 16mo | $85,000 | $41 | 38 |
| 1613 Waldman Ave | 0.62mi | 3/1.0 | 1,558 (-14%) | 11mo | $77,000 | $49 | 37 |
| 642 Leland St | 0.71mi | 3/1.0 | 1,626 (-10%) | 20mo | $96,000 | $59 | 32 |
| 2308 S Grand Traverse St | 0.58mi | 2/1.0 (-1) | 1,596 (-12%) | 19mo | $65,000 | $41 | 31 |
Match score weights: distance 35% · size 25% · config 20% · recency 20%. Top-matched comps best support the ARV.
Projected returns pro-forma
-3.0% appreciation · 0.0% rent growth · sell at horizon
- IRR
- -4.9%
- Equity multiple
- 0.82×
- Total profit
- $-5,432
- Equity at exit
- $16,401
- IRR
- 0.9%
- Equity multiple
- 1.06×
- Total profit
- $1,713
- Equity at exit
- $9,511
Cash invested: $30,800 (down + closing). Projections, not guarantees.
Landlord ↔ Tenant lean methodology
- Overall (STATE)
- 62 Landlord-Friendly
- State Michigan
- 62 Landlord-Friendly · EVEN
- County
- — inherits STATE
- City
- — inherits STATE
ZIP-level market 48507
- Rents YoY
- -1.0%
- Active inventory
- 206
- Price-to-rent
- 7.3×
Monthly cashflow live
- Estimated rent
- $1,264 medium interval (Pro) →
- Mortgage (P&I)
- −$577
- Tax from tax record
- −$123 /mo · $1,475/yr
- Insurance
- −$46
- HOA
- −$0
- Vacancy / Maint / Mgmt
- −$265
- Net cashflow
- $253
Break-even live
UW: 25.0% down · 7.5% · 30yr · 1.5% tax · 5.0% vac · 8.0% maint · 8.0% mgmt
Financing live
Cash to close
- Down payment
- $27,500
- Closing costs
- $3,300
- Reserves months
- —
- Total cash needed
- —
Loan-product check · same deal, 3 products live
Conventional
25% down · 7.5% · 30yr
- Down + closing
- —
- Monthly P&I
- —
- Monthly cashflow
- —
- DSCR
- —
- Eligible?
- —
Personal DTI + credit; lowest rate.
DSCR
20% down · 8.5% · 30yr
- Down + closing
- —
- Monthly P&I
- —
- Monthly cashflow
- —
- DSCR
- —
- Eligible?
- —
No personal income docs; deal must DSCR.
Hard money
10% down · 12.0% · 12mo
- Down + closing
- —
- Monthly P&I
- —
- Monthly cashflow
- —
- DSCR
- —
- Eligible?
- —
Short-term bridge; refi at stabilization.
Rent comps 1 comps
| Address | Beds | Baths | Sqft | Rent | $/sqft | DOM | Units | Dist |
|---|---|---|---|---|---|---|---|---|
| 1935 Carmanbrook Pkwy Flint, MI | 4.0 | 1.5 | 1800 | $1,200 | $0.67 | 13d | 1 | 0.78mi |
Listing history 23 events
-
2026-06-18days on market $110,000 Active 52 DOM
-
2026-06-17days on market $110,000 Active 51 DOM
-
2026-06-16days on market $110,000 Active 50 DOM
-
2026-06-15days on market $110,000 Active 49 DOM
-
2026-06-14days on market $110,000 Active 47 DOM
-
2026-06-13days on market $110,000 Active 46 DOM
-
2026-06-10days on market $110,000 Active 44 DOM
-
2026-06-09days on market $110,000 Active 43 DOM
-
2026-06-08days on market $110,000 Active 42 DOM
-
2026-06-07days on market $110,000 Active 41 DOM
-
2026-06-05days on market $110,000 Active 38 DOM
-
2026-06-03days on market $110,000 Active 37 DOM
-
2026-06-02days on market $110,000 Active 36 DOM
-
2026-06-01days on market $110,000 Active 35 DOM
-
2026-06-01price $110,000 Active 34 DOM
-
2026-05-31days on market $123,500 Active 34 DOM
-
2026-05-30days on market $123,500 Active 33 DOM
-
2026-04-23$123,500 Active 566-char remark
Show marketing remark (566 chars)
Beautiful ranch style home with updates throughout. Property features 3 bedrooms, 1.5 bathrooms, formal and informal dining areas, large living room and kitchen. Updates throughout includes flooring, paint, counter tops, bathrooms, electrical and more in the interior. Vinyl siding, windows and roof on the exterior. This is a Fannie Mae HomePath property. First Time Buyers, complete the HomePath Ready Buyer homeownership course on Homepath.com. Attach certificate to offer up to 3% closing cost assistance. Check HomePath.com for more details. Restrictions apply.
-
2026-04-23$123,500 Active
Show marketing remark (566 chars)
Beautiful ranch style home with updates throughout. Property features 3 bedrooms, 1.5 bathrooms, formal and informal dining areas, large living room and kitchen. Updates throughout includes flooring, paint, counter tops, bathrooms, electrical and more in the interior. Vinyl siding, windows and roof on the exterior. This is a Fannie Mae HomePath property. First Time Buyers, complete the HomePath Ready Buyer homeownership course on Homepath.com. Attach certificate to offer up to 3% closing cost assistance. Check HomePath.com for more details. Restrictions apply.
-
2006-06-20historical
-
2005-07-27$84,917
-
2001-10-04soldstatus $63,000
-
2001-10-04soldstatus $62,000
ⓘ Source: listings_history table (triggers on properties + properties_extension) + one-shot
backfill from property_details.listing_events for pre-trigger history.
Tax reassessment forecast MI · Partial reset (capped growth)
- Current annual tax
- $1,475 · $123/mo
- Projected year-2 tax
- $1,585 · $132/mo
- Expected delta
- +$109/yr (+$9/mo · 7.4%)
ⓘ Screening estimate from a state-policy table — verify with the county assessor before closing.
Climate risk First Street
- Flood 1/10 Low FEMA zone X (unshaded) · 0% chance over 30 yrs
- Wildfire 1/10 Low
- Heat 2/10 Low 7 d/yr ≥97°F today · 15 d/yr by 30 yrs out
- Wind 2/10 Low
- Air quality 3/10 Moderate 3 unhealthy d/yr today · 4 by 30 yrs out
Nearby sold comps map
Loading sold comps map…
Walkable amenities ~0.75 mi
Loading nearby amenities…
Taxation est. · year 1
- Rental income
- $15,162
- − Mortgage interest
- −$6,162
- − Property taxes
- −$1,475
- − Insurance
- −$550
- − Repairs & maintenance
- −$1,213
- − Management
- −$1,213
- − Depreciation
- −$3,200
- Taxable income
- $1,349
- Est. tax owed @ 24.0%
- −$324
- After-tax cash flow
- $2,707/yr
For passive investors: Depreciation is non-cash, so a rental often shows a tax loss while cash-flowing — sheltering income. Rental losses are passive: they offset passive income freely, and up to $25,000/yr can offset ordinary (W-2) income if you actively participate and your MAGI is under $100k (phasing out to $0 by $150k); unused losses carry forward. On sale, claimed depreciation is recaptured at up to 25%, and gains may owe capital-gains tax (a 1031 exchange can defer both). Figures are a year-1 estimate at your 24.0% rate — not tax advice; consult a CPA.
Schools (NCES district)
- District
- Flint School District
- NCES district ID
- 2614520
- Math proficiency
- 7% ▬ 0.00%
- Reading proficiency
- 13% ▲ 3.00%
- Median HH income
- $25,954
- Composite
- 10.97/100
- National rank
- #14642
- State rank
- #714 of 760 in MI
Livability — Flint
- Score
- 74/100
- State rank
- #196
- US rank
- #4946
Category grades
Schools grade is shown separately in the Schools card above.
Census & demographics
- Census place
- Flint, MI
- County
- Genesee County · 221,329 people
- City population
- 93,814
- Metro
- Flint, MI
- Population (ZIP)
- 28,723
- Household income
- $46,554
- Rent vs Own
- Severe rent burden
- 1534.0
Population outlook (Genesee County) Hauer SSP2
- Today (2025)
- 381,312 people
- By 2030
- 362,731 · -4.9%
- By 2040
- 321,550 · -15.7%
- By 2050
- 279,212 · -26.8%
- By 2075
- 193,336 · -49.3%
- By 2100
- 128,118 · -66.4%
Race, ethnicity, and origin ACS 2023
- Neighborhood character
- Diverse neighborhood (Simpson 0.57)
- Race & ethnicity
- White 59% Black 28% Two or more races 10% Hispanic / Latino 5%
- Common ancestry
- Lithuanian 4% Romanian 3% Slovak 2%
- Foreign-born
- 1% · Canada
- Languages at home
- 97% English-only · Spanish 1% Other Asian/Pacific 1%
Political lean MEDSL · Genesee
- 2024 margin
- Toss-up / Even · D 51.4% · R 47.2% · Other 1.4%
- 2008→2024 swing
- -28.3pp toward R · 2008: 32.5pp · 2024: 4.2pp
- All cycles
- 2024: D+4.2 2020: D+9.3 2016: D+9.5 2012: D+28.2 2008: D+32.5
Not yet ingested
- Civics
- —
Market trends
- HPI YoY
- ▼ -154.90%
- Current HPI
- 132.3632
- Rent YoY
- ▼ -1.04%
- Metro
- Flint, MI
- State GDP YoY
- ▲ 1.37%
- F500 in state
- 28
Industry mix (Fortune 500 HQ in MI)
| Industry | F500 HQs | Revenue |
|---|---|---|
| Automotive Parts | 3 | $48B |
|
||
| Automotive | 2 | $372B |
|
||
| Chemicals | 1 | $45B |
|
||
| Automotive Retail | 1 | $29B |
|
||
| Healthcare / Medical Devices | 1 | $23B |
|
||
| Automotive Technology | 1 | $20B |
|
||
Price history
+96.0% since first listed6 events — show timeline
- 2026-04-23 Listed $123,500 REALCOMP
- 2026-04-23 Listed $123,500 MiRealSource-MiMLS
- 2006-06-20 Listing Removed — REALCOMP
- 2005-07-27 Listed $84,917 REALCOMP
- 2001-10-04 Sold (Public Records) $62,000 Public Records
- 2001-10-04 Sold (Public Records) $63,000 Public Records
Property tax history
+4.8%/yrLatest (2025): $1,475 · +1.8% YoY. Source: county tax records.
Cash-flow waterfall
monthlySold comps — $/sqft
last 12 mo · ≤1 miLoading sold comps…