 🏗️ New Construction
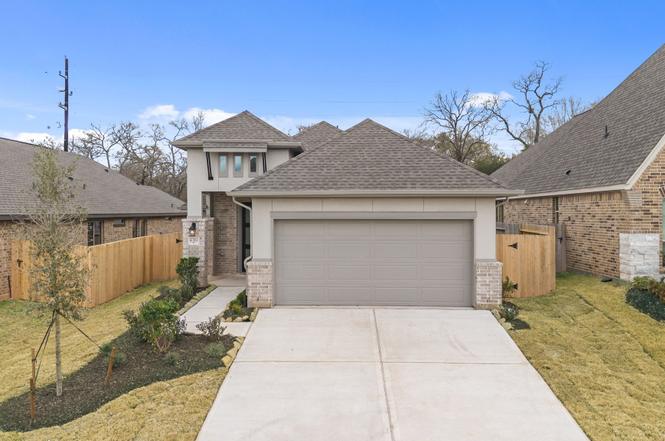
42563 Rustico Rd · Magnolia, TX
Flood risk No data
- FEMA flood zone
- —
- Chance of flooding over 30 yrs
- —
- Est. flood insurance / yr
- —
Fire risk No data
- Est. fire insurance / yr
- —
Heat risk No data
- Hot days now (above threshold)
- —
- Hot days in 30 yrs
- —
Wind risk No data
- Chance of severe wind over 30 yrs
- —
Air-quality risk No data
- Unhealthy air days now
- —
- Unhealthy air days in 30 yrs
- —
Risk factors via First Street. Map © Google.
Why this score? — see what drove the D+ grade
The composite is a weighted blend of 9 inputs, each scored 0–100. Each bar is that input's sub-score; the figure is the points it added to the 100-point composite (weight × sub-score).
- Cash flow +11.0/30.0
- Appreciation +10.0/10.0
- ARV discount +7.5/15.0
- Schools +3.9/10.0
- Livability +3.7/5.0
- DSCR +3.2/10.0
- Rent growth +2.6/5.0
- 1% rule +2.5/10.0
- Condition / age +2.5/5.0
$289,990
🖨 Deal sheet (PDF) 📄 Offer letter ✓ Due diligence
Listing remarks
If you're looking for a beautifully crafted one-story home that offers exceptional quality at an affordable price, your search ends here! This Coventry Home is thoughtfully designed for your lifestyle needs. Step into a grand entrance featuring an elegant tray ceiling. The home offers four spacious bedrooms with the flexibility to convert one into a home office or fitness room. The primary bedroom is a peaceful retreat-charming bow window—perfect for enjoying your morning coffee. The primary bath features a spa-like atmosphere with a separate soaking tub and walk-in shower, while a second full bath ensures convenience for guests. The chef-style kitchen includes an oversized island, gr
Key facts
- Grand entrance
- Tray ceiling
- Walk-in shower
Tags
Neighborhood map
What this means for you Summary
Snapshot
- This is a 4-bed/2.0-bath land listed at $290k.
Deal economics
- At list price, monthly cash flow is $-123 ($-1k/yr) — negative.
- To cash-flow at today's rent, offer at most $268k (7.5% below list).
- To meet the 1% rule (rent ≥ 1% of price), the offer needs to be $216k (25.4% below list).
- Recommended offer: $216k (25.4% below list) — sets the bar for 1% rule.
- Cap rate 5.8% vs local median 3.4% in Magnolia — top-decile yield for the area; either an underpriced asset or a hidden risk that comps aren't pricing in. Stress-test before assuming the spread holds.
Location & tenants
- Location reads 73/100 on livability (#222 in TX) — a middle-class / working-renter tenant base. Strengths: crime A+, cost of living A+, housing A+; Watch: amenities F, commute F.
- Magnolia ISD (rural): math 42% / reading 45% proficiency, ranked #247 of 826 in TX (top 30%) — families likely to look elsewhere, expect single-tenant / working-renter base with shorter leases.
- Zoned schools: Willie E Williams El (math 46% / reading 41%, grade F, #1,269 of 4,322 statewide, top 30%, 869 students, 70% FRL); Magnolia West H S (math 41% / reading 53%, grade D-, #591 of 1,632 statewide, top 38%, 2,208 students, 52% FRL) — zoned schools average 61% FRL vs 39% district-wide (22 pts higher); higher-poverty schools than district average — tighter screening recommended.
- Market conditions: Rents flat; 1604 active listings in the ZIP; high-income renter base; 13,259 units permitted in Montgomery County in 2024 (1,402 in 5+ unit buildings).
Forward outlook
- In year one you build about $31k of equity ($2k loan paydown + $29k appreciation (10.0% local appreciation)).
- Montgomery County population projected at +65% by 2050 — long-run rental-demand tailwind backs the buy-and-hold thesis.
- By year 2, paydown + projected appreciation supports a ~$50k cash-out refi (75% LTV) — recoverable capital for the next deal without selling this one.
Negotiation context
- It's been on market 68 days — a 6% lower offer ($273k) is reasonable based on typical stale-listing flexibility.
- 4 sale attempts with the ask held roughly flat each time — persistent listings suggest the price (not the market) is what's stuck; bring a comps-based counter.
Questions for the listing agent
- What do current leases actually rent for vs. the listed asking? Can we see a recent rent roll and the last 12 months of T-12 income?
- It's been on market 68 days. Have you received any prior offers? Is the seller open to a 25% concession, seller financing, or rate buy-down credit?
- What does the HOA fee cover, when was the last increase, and are there any pending special assessments or reserve-fund shortfalls?
- Why hasn't it sold? Are there any deal-killer items the seller is aware of (foundation, flood, title, zoning, code violations)?
- Is there a deadline driving the sale (1031 exchange, divorce, estate, relocation)? That informs how much negotiation room exists.
- Schools are D-rated, which usually means shorter tenancies and higher turnover. Who's the typical renter profile here, and what's been the actual vacancy rate?
- The area grade is low — what's the realistic commute time and amenity access for the typical tenant pool here? Any planned neighborhood developments (good or bad) we should know about?
- What's the average days-on-market for RENTAL listings here right now (not sales)? A rising rental-DOM trend means longer vacancies and softer asking-rent achievability than the comps imply.
- What's the recent tenant-quality profile in this submarket — average credit score on applications, eviction rate, late-payment / NSF rate, and stable-employment percentage? A property-management company in the area should have these aggregated.
- How much new for-sale + rental construction is in the pipeline within 1–3 miles? Heavy new supply typically softens prices + rents 12–24 months out; constrained supply supports both.
Investment metrics
- 1% rule
- 0.75% ✗
- Cap rate
- 5.78%
- Cash-on-cash
- -1.82%
- DSCR
- 0.92
- GRM
- 11.2
CMA / ARV
No comps found within radius.
Projected returns pro-forma
10.0% appreciation · 0.32% rent growth · sell at horizon
- IRR
- 22.2%
- Equity multiple
- 2.78×
- Total profit
- $144,318
- Equity at exit
- $261,246
- IRR
- 19.4%
- Equity multiple
- 6.18×
- Total profit
- $420,717
- Equity at exit
- $563,387
Cash invested: $81,197 (down + closing). Projections, not guarantees.
Landlord ↔ Tenant lean methodology
- Overall (STATE)
- 87 Strongly Landlord-Friendly
- State Texas
- 87 Strongly Landlord-Friendly · R+5
- County
- — inherits STATE
- City
- — inherits STATE
ZIP-level market 77354
- Home prices YoY
- 2.4%
- Rents YoY
- 0.3%
- Active inventory
- 1604
- Price-to-rent
- 11.2×
Monthly cashflow live
- Estimated rent
- $2,164 medium interval (Pro) →
- Mortgage (P&I)
- −$1,521
- Tax from tax record
- −$116 /mo · $1,395/yr
- Insurance
- −$121
- HOA
- −$75
- Vacancy / Maint / Mgmt
- −$454
- Net cashflow
- $-123
Break-even live
Sensitivity live
| Price | -10% $41 | -5% $-41 | +0% $-123 | +5% $-206 | +10% $-288 |
|---|---|---|---|---|---|
| Rent | -10% $-294 | -5% $-209 | +0% $-123 | +5% $-38 | +10% $47 |
| Rate | -1.0pp $23 | -0.5pp $-50 | base $-123 | +0.5pp $-199 | +1.0pp $-275 |
UW: 25.0% down · 7.5% · 30yr · 1.5% tax · 5.0% vac · 8.0% maint · 8.0% mgmt
Financing live
Cash to close
- Down payment
- $72,498
- Closing costs
- $8,700
- Reserves months
- —
- Total cash needed
- —
Loan-product check · same deal, 3 products live
Conventional
25% down · 7.5% · 30yr
- Down + closing
- —
- Monthly P&I
- —
- Monthly cashflow
- —
- DSCR
- —
- Eligible?
- —
Personal DTI + credit; lowest rate.
DSCR
20% down · 8.5% · 30yr
- Down + closing
- —
- Monthly P&I
- —
- Monthly cashflow
- —
- DSCR
- —
- Eligible?
- —
No personal income docs; deal must DSCR.
Hard money
10% down · 12.0% · 12mo
- Down + closing
- —
- Monthly P&I
- —
- Monthly cashflow
- —
- DSCR
- —
- Eligible?
- —
Short-term bridge; refi at stabilization.
HOA detail
- Monthly dues
- $75 · $900/yr
Listing history 9 events
-
2026-04-27status Pending
-
2026-02-18$289,990 Active
-
2026-02-18$289,990 Active
-
2026-02-18historical
-
2026-02-18historical
-
2025-11-10$289,990 Active
-
2025-11-10historical
-
2025-08-29price $289,990
-
2025-06-05$341,467 Active
ⓘ Source: listings_history table (triggers on properties + properties_extension) + one-shot
backfill from property_details.listing_events for pre-trigger history.
Tax reassessment forecast TX · Resets to sale price
- Current annual tax
- $1,395 · $116/mo
- Projected year-2 tax
- $5,307 · $442/mo
- Expected delta
- +$3,912/yr (+$326/mo · 280.4%)
ⓘ Screening estimate from a state-policy table — verify with the county assessor before closing.
Nearby sold comps map
Loading sold comps map…
Walkable amenities ~0.75 mi
Loading nearby amenities…
Taxation est. · year 1
- Rental income
- $25,965
- − Mortgage interest
- −$16,244
- − Property taxes
- −$1,395
- − Insurance
- −$1,450
- − Repairs & maintenance
- −$2,077
- − Management
- −$2,077
- − HOA
- −$900
- − Depreciation
- −$8,436
- Taxable loss
- −$6,614
- Est. tax savings @ 24.0%
- +$1,587
- After-tax cash flow
- $106/yr
For passive investors: Depreciation is non-cash, so a rental often shows a tax loss while cash-flowing — sheltering income. Rental losses are passive: they offset passive income freely, and up to $25,000/yr can offset ordinary (W-2) income if you actively participate and your MAGI is under $100k (phasing out to $0 by $150k); unused losses carry forward. On sale, claimed depreciation is recaptured at up to 25%, and gains may owe capital-gains tax (a 1031 exchange can defer both). Figures are a year-1 estimate at your 24.0% rate — not tax advice; consult a CPA.
Schools (NCES district)
- District
- Magnolia ISD
- NCES district ID
- 4828740
- Math proficiency
- 42% ▼ -7.00%
- Reading proficiency
- 45% ▼ -4.00%
- Median HH income
- $71,692
- Composite
- 39.46/100
- National rank
- #3958
- State rank
- #247 of 826 in TX
Livability — Magnolia
- Score
- 73/100
- State rank
- #222
- US rank
- #5442
Category grades
Schools grade is shown separately in the Schools card above.
Census & demographics
- County
- Montgomery County · 663,713 people
- City population
- 106,505
- Metro
- Houston-The Woodlands-Sugar Land, TX
- Population (ZIP)
- 44,900
- Household income
- $112,504
- Rent vs Own
- Severe rent burden
- 586.0
Population outlook (Montgomery County) Hauer SSP2
- Today (2025)
- 713,896 people
- By 2030
- 805,263 · +12.8%
- By 2040
- 992,708 · +39.1%
- By 2050
- 1,179,590 · +65.2%
- By 2075
- 1,628,084 · +128.1%
- By 2100
- 1,937,880 · +171.5%
Race, ethnicity, and origin ACS 2023
- Neighborhood character
- Predominantly White (66%)
- Race & ethnicity
- White 66% Hispanic / Latino 25% Two or more races 18% Black 3% Asian 1%
- Hispanic origin (detail)
- Mexican 14% Puerto Rican 1%
- Common ancestry
- Lithuanian 4% Slovak 2% Italian 2%
- Foreign-born
- 11% · Canada, Vietnam
- Languages at home
- 83% English-only · Spanish 15% Other Indo-European 1% German/W. Germanic 1%
Political lean MEDSL · Montgomery
- 2024 margin
- Solid R (+45.5) · D 26.8% · R 72.3%
- 2008→2024 swing
- +7.2pp toward D · 2008: -52.7pp · 2024: -45.5pp
- All cycles
- 2024: R+45.5 2020: R+43.8 2016: R+51.4 2012: R+60.7 2008: R+52.7
Not yet ingested
- Civics
- —
Market trends
- HPI YoY
- ▲ 12.09%
- Current HPI
- 512.87
- Rent YoY
- ▲ 0.32%
- Metro
- Houston-The Woodlands-Sugar Land, TX
- State GDP YoY
- ▲ 3.95%
- F500 in state
- 110
Industry mix (Fortune 500 HQ in TX)
| Industry | F500 HQs | Revenue |
|---|---|---|
| Energy | 16 | $1,198B |
|
||
| Technology | 5 | $198B |
|
||
| Engineering / Construction | 4 | $72B |
|
||
| Energy Services | 3 | $60B |
|
||
| Utilities | 3 | $41B |
|
||
| Healthcare | 2 | $330B |
|
||
Price history
-15.1% since first listed9 events — show timeline
- 2026-04-27 Pending — HARMLS
- 2026-02-18 Listing Removed — HARMLS
- 2026-02-18 Listing Removed — HARMLS
- 2026-02-18 Listed $289,990 HARMLS
- 2026-02-18 Listed $289,990 HARMLS
- 2025-11-10 Listing Removed — HARMLS
- 2025-11-10 Listed $289,990 HARMLS
- 2025-08-29 Price Changed $289,990 HARMLS
- 2025-06-05 Listed $341,467 HARMLS
Property tax history
-30.1%/yrLatest (2025): $1,395 · -30.1% YoY. Source: county tax records.
Cash-flow waterfall
monthlySold comps — $/sqft
last 12 mo · ≤1 miLoading sold comps…