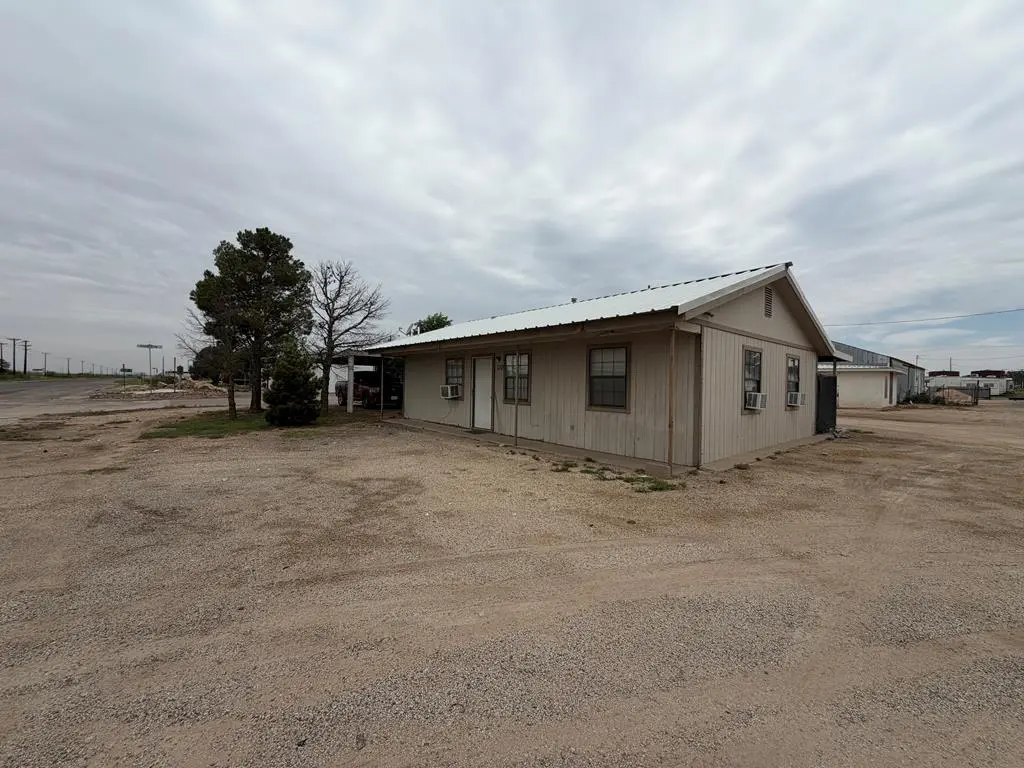
110 W Gulf Ave · Goldsmith, TX
Flood risk No data
- FEMA flood zone
- —
- Chance of flooding over 30 yrs
- —
- Est. flood insurance / yr
- —
Fire risk No data
- Est. fire insurance / yr
- —
Heat risk No data
- Hot days now (above threshold)
- —
- Hot days in 30 yrs
- —
Wind risk No data
- Chance of severe wind over 30 yrs
- —
Air-quality risk No data
- Unhealthy air days now
- —
- Unhealthy air days in 30 yrs
- —
Risk factors via First Street. Map © Google.
Why this score? — see what drove the D- grade
The composite is a weighted blend of 9 inputs, each scored 0–100. Each bar is that input's sub-score; the figure is the points it added to the 100-point composite (weight × sub-score).
- Cash flow +10.7/30.0
- ARV discount +7.5/15.0
- Appreciation +5.0/10.0
- 1% rule +3.2/10.0
- Livability +3.2/5.0
- DSCR +3.1/10.0
- Rent growth +2.5/5.0
- Schools +2.2/10.0
- Condition / age +1.0/5.0
$175,000
🖨 Deal sheet 📄 Offer letter ✓ Due diligence
Listing remarks
2 bedroom 1 bathroom home currently rented for $1000. Month to month rent.
Key facts
- 0.23 acre lot
- Built 1991
- Listed 18 days
Property features AI
Exterior
- Parking: Carport
- Utilities: Public water; Public sewer; Propane service
- Home design: Single family residence; Residential property type
- Construction: Aluminum siding; Metal roof; Slab foundation; Built with solar (green energy generation)
- Exterior features: Corner lot; Paved road access; Solar energy system
Interior
- Kitchen: Electric range
- Bathrooms: 1 full bathroom
- Heating & cooling: Central heating; Cooling present
- Interior features: Electric water heater; Electric range; Central heating; Has heating; Has cooling; No fireplace
Neighborhood map
What this means for you Summary
Snapshot
- This is a 2-bed/1.0-bath single-family listed at $175k. Condition is rated poor.
Deal economics
- At list price, monthly cash flow is $-82 ($-982/yr) — negative.
- To cash-flow at today's rent, offer at most $163k (6.8% below list).
- To meet the 1% rule (rent ≥ 1% of price), the offer needs to be $143k (18.4% below list).
- Recommended offer: $143k (18.4% below list) — sets the bar for 1% rule.
Location & tenants
- Location reads 63/100 on livability (#890 in TX) — a middle-class / working-renter tenant base. Strengths: cost of living A+, housing A+; Watch: employment C-, health & safety C-, crime D.
- Ector County ISD (urban): math 22% / reading 27% proficiency, ranked #707 of 826 in TX (top 86%) — low school quality limits family demand, transient renter base, plan for 1-2y turnover.
- Zoned schools: Odessa H S (math 18% / reading 22%, grade F, #1,397 of 1,632 statewide, top 87%, 3,874 students, 68% FRL).
- Market conditions: 9 active listings in the ZIP; 1,004 units permitted in Ector County in 2024 (0 in 5+ unit buildings).
Forward outlook
- In year one you build about $6k of equity ($1k loan paydown + $5k appreciation (3.0% local appreciation)).
- Ector County population projected at +78% by 2050 — long-run rental-demand tailwind backs the buy-and-hold thesis.
- At projected returns (3.0% appreciation + 3.0% rent growth), your $49k cash investment doubles in ~7 years — after that, you're playing with house money.
- By year 6, paydown + projected appreciation supports a ~$34k cash-out refi (75% LTV) — recoverable capital for the next deal without selling this one.
Negotiation context
- It's been on market 19 days — a 2% lower offer ($172k) is reasonable based on typical stale-listing flexibility.
Questions for the listing agent
- What do current leases actually rent for vs. the listed asking? Can we see a recent rent roll and the last 12 months of T-12 income?
- Have any recent inspections been done? Can we get a copy of the seller's disclosures and any deferred-maintenance estimates?
- Is there a deadline driving the sale (1031 exchange, divorce, estate, relocation)? That informs how much negotiation room exists.
- Schools are F-rated, which usually means shorter tenancies and higher turnover. Who's the typical renter profile here, and what's been the actual vacancy rate?
- Crime grade is D in this area — have there been break-ins, vandalism, or insurance claims at this property in the last 3 years? What carrier currently insures it and at what premium?
- The area grade is low — what's the realistic commute time and amenity access for the typical tenant pool here? Any planned neighborhood developments (good or bad) we should know about?
- What's the average days-on-market for RENTAL listings here right now (not sales)? A rising rental-DOM trend means longer vacancies and softer asking-rent achievability than the comps imply.
- What's the recent tenant-quality profile in this submarket — average credit score on applications, eviction rate, late-payment / NSF rate, and stable-employment percentage? A property-management company in the area should have these aggregated.
- How much new for-sale + rental construction is in the pipeline within 1–3 miles? Heavy new supply typically softens prices + rents 12–24 months out; constrained supply supports both.
Investment metrics
- 1% rule
- 0.82% ✗
- Cap rate
- 5.73%
- Cash-on-cash
- -2.00%
- DSCR
- 0.91
- GRM
- 10.2
CMA / ARV
No comps found within radius.
Projected returns pro-forma
3.0% appreciation · 3.0% rent growth · sell at horizon
- IRR
- 5.6%
- Equity multiple
- 1.32×
- Total profit
- $15,893
- Equity at exit
- $78,688
- IRR
- 8.6%
- Equity multiple
- 2.30×
- Total profit
- $63,936
- Equity at exit
- $121,267
Cash invested: $49,000 (down + closing). Projections, not guarantees.
Landlord ↔ Tenant lean methodology
- Overall (STATE)
- 87 Strongly Landlord-Friendly
- State Texas
- 87 Strongly Landlord-Friendly · R+5
- County
- — inherits STATE
- City
- — inherits STATE
ZIP-level market 79741
- Active inventory
- 9
- Price-to-rent
- 10.2×
Monthly cashflow live
- Estimated rent
- $1,427 medium interval (Pro) →
- Mortgage (P&I)
- −$918
- Tax est. 1.5%
- −$219 /mo · $2,625/yr
- Insurance
- −$73
- HOA
- −$0
- Vacancy / Maint / Mgmt
- −$300
- Net cashflow
- $-82
Break-even live
UW: 25.0% down · 7.5% · 30yr · 1.5% tax · 5.0% vac · 8.0% maint · 8.0% mgmt
Financing live
Cash to close
- Down payment
- $43,750
- Closing costs
- $5,250
- Reserves months
- —
- Total cash needed
- —
Loan-product check · same deal, 3 products live
Conventional
25% down · 7.5% · 30yr
- Down + closing
- —
- Monthly P&I
- —
- Monthly cashflow
- —
- DSCR
- —
- Eligible?
- —
Personal DTI + credit; lowest rate.
DSCR
20% down · 8.5% · 30yr
- Down + closing
- —
- Monthly P&I
- —
- Monthly cashflow
- —
- DSCR
- —
- Eligible?
- —
No personal income docs; deal must DSCR.
Hard money
10% down · 12.0% · 12mo
- Down + closing
- —
- Monthly P&I
- —
- Monthly cashflow
- —
- DSCR
- —
- Eligible?
- —
Short-term bridge; refi at stabilization.
Listing history 14 events
-
2026-06-19days on market $175,000 Active 19 DOM
-
2026-06-18days on market $175,000 Active 18 DOM
-
2026-06-17days on market $175,000 Active 17 DOM
-
2026-06-16days on market $175,000 Active 16 DOM
-
2026-06-15days on market $175,000 Active 15 DOM
-
2026-06-14days on market $175,000 Active 13 DOM
-
2026-06-13days on market $175,000 Active 12 DOM
-
2026-06-10days on market $175,000 Active 10 DOM
-
2026-06-09days on market $175,000 Active 9 DOM
-
2026-06-08days on market $175,000 Active 8 DOM
-
2026-06-07days on market $175,000 Active 7 DOM
-
2026-06-03days on market $175,000 Active 2 DOM
-
2026-06-01remarks 74-char remark
-
2026-06-01$175,000 Active 1 DOM
ⓘ Source: listings_history table (triggers on properties + properties_extension) + one-shot
backfill from property_details.listing_events for pre-trigger history.
Nearby sold comps map
Loading sold comps map…
Walkable amenities ~0.75 mi
Loading nearby amenities…
Taxation est. · year 1
- Rental income
- $17,128
- − Mortgage interest
- −$9,803
- − Property taxes
- −$2,625
- − Insurance
- −$875
- − Repairs & maintenance
- −$1,370
- − Management
- −$1,370
- − Depreciation
- −$5,091
- Taxable loss
- −$4,006
- Est. tax savings @ 24.0%
- +$961
- After-tax cash flow
- $-20/yr
For passive investors: Depreciation is non-cash, so a rental often shows a tax loss while cash-flowing — sheltering income. Rental losses are passive: they offset passive income freely, and up to $25,000/yr can offset ordinary (W-2) income if you actively participate and your MAGI is under $100k (phasing out to $0 by $150k); unused losses carry forward. On sale, claimed depreciation is recaptured at up to 25%, and gains may owe capital-gains tax (a 1031 exchange can defer both). Figures are a year-1 estimate at your 24.0% rate — not tax advice; consult a CPA.
Condition & rehab AI · 4 photos
This single-family home requires extensive repairs and maintenance, including roof and exterior siding repairs, painting, and HVAC and plumbing system repairs. Landscaping and curb appeal improvements would also significantly enhance its value.
Repairs flagged
- Major roof — Significant wear and tear visible.
- Major exterior siding — Severe peeling and wear.
- Major HVAC — No visible systems, but the exterior suggests potential issues.
- Major plumbing — No visible systems, but the exterior suggests potential issues.
- Major interior walls/paint — No visible interior, but the exterior suggests potential issues with the structure and systems.
Value-add opportunities
- Both repair roof and exterior siding — Both the roof and exterior siding are in poor condition, which would significantly improve the home's appearance and functionality.
- Both paint interior walls and paint exterior siding — Painting the interior walls and exterior siding would improve the home's appearance and potentially increase its value.
- Both repair HVAC and plumbing systems — Repairing the HVAC and plumbing systems would improve the home's functionality and potentially increase its value.
- Both landscaping and curb appeal — Landscaping and improving curb appeal would enhance the home's visual appeal and potentially increase its value.
Renovation cost estimate screening
| Repair item | Severity | Est. cost |
|---|---|---|
| roof · Significant wear and tear visible. | Major | $15,000–50,000 |
| exterior siding · Severe peeling and wear. | Major | $15,000–50,000 |
| HVAC · No visible systems, but the exterior suggests potential issues. | Major | $15,000–50,000 |
| plumbing · No visible systems, but the exterior suggests potential issues. | Major | $15,000–50,000 |
| interior walls/paint · No visible interior, but the exterior suggests potential issues with the structure and systems. | Major | $15,000–50,000 |
| Total estimated repair cost · 5 items | $75,000–250,000 |
Value-add ROI direction
- Both repair roof and exterior siding — Both the roof and exterior siding are in poor condition, which would significantly improve the home's appearance and functionality. ↑
- Both paint interior walls and paint exterior siding — Painting the interior walls and exterior siding would improve the home's appearance and potentially increase its value. ↑
- Both repair HVAC and plumbing systems — Repairing the HVAC and plumbing systems would improve the home's functionality and potentially increase its value. ↑
- Both landscaping and curb appeal — Landscaping and improving curb appeal would enhance the home's visual appeal and potentially increase its value. ↑
ⓘ Cost ranges are severity-bucket heuristics (US national rule-of-thumb). Get contractor quotes + a written scope before underwriting a rehab budget.
Schools (NCES district)
- District
- Ector County ISD
- NCES district ID
- 4818000
- Math proficiency
- 22% ▼ -9.00%
- Reading proficiency
- 27% ▼ -4.00%
- Median HH income
- $52,740
- Composite
- 21.89/100
- National rank
- #8233
- State rank
- #707 of 826 in TX
Livability — Goldsmith
- Score
- 63/100
- State rank
- #890
- US rank
- #15972
Category grades
Schools grade is shown separately in the Schools card above.
Census & demographics
- Census place
- Goldsmith, TX
- Population (ZIP)
- 215
Population outlook (Ector County) Hauer SSP2
- Today (2025)
- 212,765 people
- By 2030
- 241,962 · +13.7%
- By 2040
- 306,582 · +44.1%
- By 2050
- 379,755 · +78.5%
- By 2075
- 568,991 · +167.4%
- By 2100
- 709,829 · +233.6%
Race, ethnicity, and origin ACS 2023
- Neighborhood character
- Predominantly White (87%)
- Race & ethnicity
- White 87% Hispanic / Latino 13%
- Hispanic origin (detail)
- Mexican 13%
- Common ancestry
- Scottish 12% Slovak 5% Serbian 2%
- Foreign-born
- 4% · Canada
- Languages at home
- 86% English-only · Spanish 14%
Political lean MEDSL · Ector
- 2024 margin
- Solid R (+52.9) · D 23.2% · R 76.1%
- 2008→2024 swing
- -4.9pp toward R · 2008: -48.0pp · 2024: -52.9pp
- All cycles
- 2024: R+52.9 2020: R+47.8 2016: R+40.6 2012: R+48.9 2008: R+48.0
Not yet ingested
- Civics
- —
Market trends
- HPI YoY
- —
- Current HPI
- —
- Rent YoY
- —
- Metro
- —
- State GDP YoY
- ▲ 3.95%
- F500 in state
- 110
Industry mix (Fortune 500 HQ in TX)
| Industry | F500 HQs | Revenue |
|---|---|---|
| Energy | 16 | $1,198B |
|
||
| Technology | 5 | $198B |
|
||
| Engineering / Construction | 4 | $72B |
|
||
| Energy Services | 3 | $60B |
|
||
| Utilities | 3 | $41B |
|
||
| Healthcare | 2 | $330B |
|
||
Price history
1 event — show timeline
- 2026-05-31 Listed $175,000 ODMLS
Cash-flow waterfall
monthlySold comps — $/sqft
last 12 mo · ≤1 miLoading sold comps…