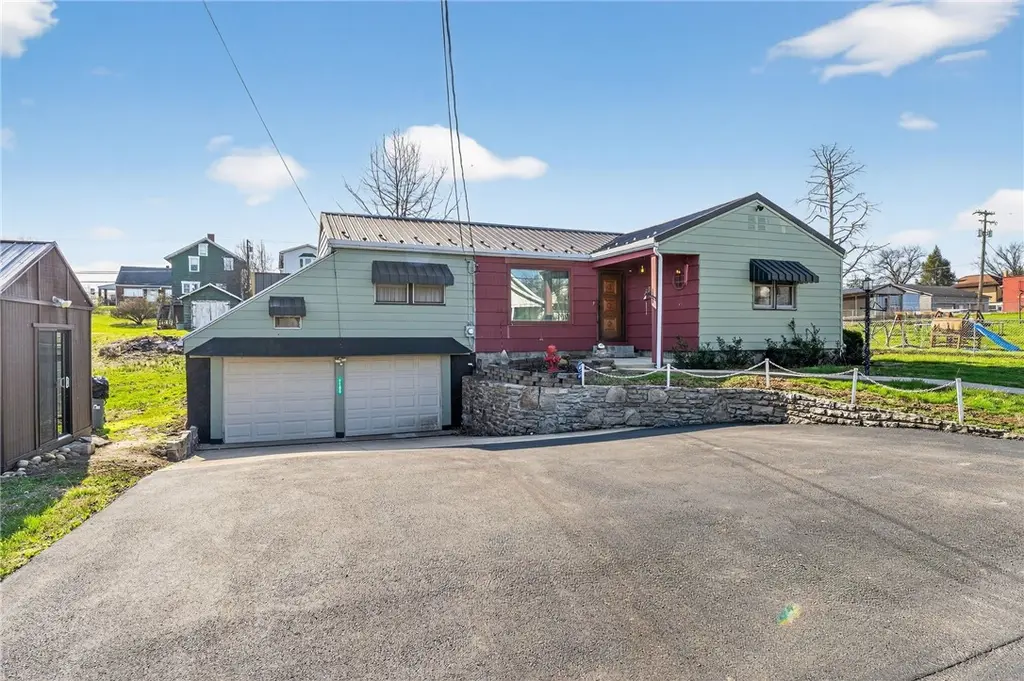
1109 1st St · Hiller, PA
Flood risk 1/10 · Minimal
- FEMA flood zone
- X (unshaded)
- Chance of flooding over 30 yrs
- 0.0%
- Est. flood insurance / yr
- $473 – $860
Fire risk 1/10 · Minimal
- Est. fire insurance / yr
- $511 – $949
Heat risk 4/10 · Minor
- Hot days now (above 98°F)
- 7 days/yr
- Hot days in 30 yrs
- 19 days/yr
Wind risk 2/10 · Minimal
- Chance of severe wind over 30 yrs
- —
Air-quality risk 2/10 · Minimal
- Unhealthy air days now
- 1 days/yr
- Unhealthy air days in 30 yrs
- 2 days/yr
Risk factors via First Street. Map © Google.
Why this score? — see what drove the C- grade
The composite is a weighted blend of 9 inputs, each scored 0–100. Each bar is that input's sub-score; the figure is the points it added to the 100-point composite (weight × sub-score).
- ARV discount +15.0/15.0
- Cash flow +12.9/30.0
- Appreciation +5.0/10.0
- DSCR +3.9/10.0
- Livability +3.8/5.0
- 1% rule +3.7/10.0
- Rent growth +2.5/5.0
- Condition / age +2.2/5.0
- Schools +2.1/10.0
$119,900
🖨 Deal sheet (PDF) 📄 Offer letter ✓ Due diligence
Listing remarks
Welcome to 1109 1st St in Hiller, PA — a place you can truly make your own. From the moment you arrive, you’ll see the potential this home has to become something special. With a spacious layout and multiple living areas, there’s plenty of room to create a space that fits your lifestyle. Whether you're envisioning cozy nights in the living room or hosting friends and family, this home gives you the flexibility to bring your vision to life. The bedrooms offer comfortable space to unwind, while the kitchen is ready for your personal touch — a perfect opportunity to design something that reflects your style. Throughout the home, you’ll find a solid foundation that
Key facts
- Generous yard
- Garage
- Off-street parking
Tags
Neighborhood map
What this means for you Summary
Snapshot
- This is a 3-bed/2.0-bath single-family listed at $120k. Condition is rated fair.
Deal economics
- At list price, monthly cash flow is $-9 ($-105/yr) — negative.
- To cash-flow at today's rent, offer at most $119k (1.1% below list).
- To meet the 1% rule (rent ≥ 1% of price), the offer needs to be $104k (13.4% below list).
- Recommended offer: $104k (13.4% below list) — sets the bar for 1% rule.
Location & tenants
- Location reads 76/100 on livability (#375 in PA, #3,312 nationally) — a middle-class / working-renter tenant base. Strengths: crime A+, employment A+, cost of living A+; Watch: amenities F, commute F.
- Brownsville Area SD (rural): math 17% / reading 34% proficiency, ranked #472 of 539 in PA (top 88%) — low school quality limits family demand, transient renter base, plan for 1-2y turnover.
- Zoned schools: Brownsville Area El Sch (math 16% / reading 37%, grade F, #1,169 of 1,518 statewide, top 77%, 700 students, 100% FRL); Brownsville Area Ms (math 7% / reading 32%, grade F, #444 of 512 statewide, top 87%, 352 students, 100% FRL); Brownsville Area Hs (math 64% / reading 24%, grade F, #196 of 437 statewide, top 47%, 434 students, 77% FRL) — zoned schools average 92% FRL vs 59% district-wide (33 pts higher); higher-poverty schools than district average — tighter screening recommended.
- Market conditions: 3 active listings in the ZIP; 201 units permitted in Fayette County in 2024 (10 in 5+ unit buildings).
Forward outlook
- In year one you build about $939 of equity ($829 loan paydown + $110 appreciation (0.1% local appreciation)).
- Fayette County population projected at -19% by 2050 — secular population decline; favor cash flow + early exit over multi-decade hold.
Negotiation context
- Only 14 days on market — expect competitive offers; lowballing is unlikely to land.
Risks & watch-outs
- Watch-outs: built in 1947 — expect roof / HVAC / electrical / plumbing capex.
Questions for the listing agent
- What do current leases actually rent for vs. the listed asking? Can we see a recent rent roll and the last 12 months of T-12 income?
- Have any recent inspections been done? Can we get a copy of the seller's disclosures and any deferred-maintenance estimates?
- Built in 1947 — when were the roof, HVAC, electrical panel, plumbing, and water heater last replaced?
- Is there a deadline driving the sale (1031 exchange, divorce, estate, relocation)? That informs how much negotiation room exists.
- Schools are D-rated, which usually means shorter tenancies and higher turnover. Who's the typical renter profile here, and what's been the actual vacancy rate?
- What's the average days-on-market for RENTAL listings here right now (not sales)? A rising rental-DOM trend means longer vacancies and softer asking-rent achievability than the comps imply.
- What's the recent tenant-quality profile in this submarket — average credit score on applications, eviction rate, late-payment / NSF rate, and stable-employment percentage? A property-management company in the area should have these aggregated.
- How much new for-sale + rental construction is in the pipeline within 1–3 miles? Heavy new supply typically softens prices + rents 12–24 months out; constrained supply supports both.
Investment metrics
- 1% rule
- 0.87% ✗
- Cap rate
- 6.21%
- Cash-on-cash
- -0.31%
- DSCR
- 0.99
- GRM
- 9.6
CMA / ARV
- ARV (on-the-fly)
- $158,080
- Comps found
- 8
Show comp detail 8 sales within ~0.75 mi
| Address | Dist | Beds/Ba | Sqft | Sold | Price | $/sf | Match |
|---|---|---|---|---|---|---|---|
| 816 High St | 0.22mi | 3/2.0 | 1,048 (+1%) | 3mo | $198,900 | $190 | 86 |
| 810 York St | 0.34mi | 3/1.0 | 990 (-5%) | 5mo | $150,000 | $152 | 68 |
| 1202 6th St | 0.32mi | 2/2.0 (-1) | 1,040 (0%) | 18mo | $160,000 | $154 | 65 |
| 538 Green St | 0.52mi | 2/1.0 (-1) | 1,040 (0%) | 16mo | $66,950 | $64 | 53 |
| 110 Raymond Ave | 0.69mi | 3/1.0 | 988 (-5%) | 8mo | $160,000 | $162 | 49 |
| 503 Pearl St | 0.60mi | 2/1.5 (-1) | 1,100 (+6%) | 8mo | $137,000 | $125 | 48 |
| 814 Howard St | 0.30mi | 2/1.0 (-1) | 920 (-12%) | 16mo | $42,500 | $46 | 44 |
| 1313 Sheridan | 0.66mi | 3/1.0 | 976 (-6%) | 18mo | $79,995 | $82 | 40 |
Match score weights: distance 35% · size 25% · config 20% · recency 20%. Top-matched comps best support the ARV.
Projected returns pro-forma
0.09% appreciation · 3.0% rent growth · sell at horizon
- IRR
- -2.2%
- Equity multiple
- 0.89×
- Total profit
- $-3,534
- Equity at exit
- $35,365
- IRR
- 3.4%
- Equity multiple
- 1.37×
- Total profit
- $12,582
- Equity at exit
- $42,952
Cash invested: $33,572 (down + closing). Projections, not guarantees.
Landlord ↔ Tenant lean methodology
- Overall (STATE)
- 62 Landlord-Friendly
- State Pennsylvania
- 62 Landlord-Friendly · EVEN
- County
- — inherits STATE
- City
- — inherits STATE
ZIP-level market 15444
- Home prices YoY
- 0.0%
- Active inventory
- 3
- Price-to-rent
- 9.6×
Monthly cashflow live
- Estimated rent
- $1,038 medium interval (Pro) →
- Mortgage (P&I)
- −$629
- Tax est. 1.5%
- −$150 /mo · $1,798/yr
- Insurance
- −$50
- HOA
- −$0
- Vacancy / Maint / Mgmt
- −$218
- Net cashflow
- $-9
Break-even live
Sensitivity live
| Price | -10% $74 | -5% $33 | +0% $-9 | +5% $-50 | +10% $-92 |
|---|---|---|---|---|---|
| Rent | -10% $-91 | -5% $-50 | +0% $-9 | +5% $32 | +10% $73 |
| Rate | -1.0pp $52 | -0.5pp $22 | base $-9 | +0.5pp $-40 | +1.0pp $-71 |
UW: 25.0% down · 7.5% · 30yr · 1.5% tax · 5.0% vac · 8.0% maint · 8.0% mgmt
Financing live
Cash to close
- Down payment
- $29,975
- Closing costs
- $3,597
- Reserves months
- —
- Total cash needed
- —
Loan-product check · same deal, 3 products live
Conventional
25% down · 7.5% · 30yr
- Down + closing
- —
- Monthly P&I
- —
- Monthly cashflow
- —
- DSCR
- —
- Eligible?
- —
Personal DTI + credit; lowest rate.
DSCR
20% down · 8.5% · 30yr
- Down + closing
- —
- Monthly P&I
- —
- Monthly cashflow
- —
- DSCR
- —
- Eligible?
- —
No personal income docs; deal must DSCR.
Hard money
10% down · 12.0% · 12mo
- Down + closing
- —
- Monthly P&I
- —
- Monthly cashflow
- —
- DSCR
- —
- Eligible?
- —
Short-term bridge; refi at stabilization.
Listing history 2 events
-
2026-04-08status Pending
-
2026-03-24$119,900 Active
ⓘ Source: listings_history table (triggers on properties + properties_extension) + one-shot
backfill from property_details.listing_events for pre-trigger history.
Climate risk First Street
- Flood 1/10 Low FEMA zone X (unshaded) · 0% chance over 30 yrs
- Wildfire 1/10 Low
- Heat 4/10 Moderate 7 d/yr ≥98°F today · 19 d/yr by 30 yrs out
- Wind 2/10 Low
- Air quality 2/10 Low 1 unhealthy d/yr today · 2 by 30 yrs out
Nearby sold comps map
Loading sold comps map…
Walkable amenities ~0.75 mi
Loading nearby amenities…
Taxation est. · year 1
- Rental income
- $12,453
- − Mortgage interest
- −$6,716
- − Property taxes
- −$1,798
- − Insurance
- −$600
- − Repairs & maintenance
- −$996
- − Management
- −$996
- − Depreciation
- −$3,488
- Taxable loss
- −$2,142
- Est. tax savings @ 24.0%
- +$514
- After-tax cash flow
- $409/yr
For passive investors: Depreciation is non-cash, so a rental often shows a tax loss while cash-flowing — sheltering income. Rental losses are passive: they offset passive income freely, and up to $25,000/yr can offset ordinary (W-2) income if you actively participate and your MAGI is under $100k (phasing out to $0 by $150k); unused losses carry forward. On sale, claimed depreciation is recaptured at up to 25%, and gains may owe capital-gains tax (a 1031 exchange can defer both). Figures are a year-1 estimate at your 24.0% rate — not tax advice; consult a CPA.
Condition & rehab AI · 13 photos
The home is in fair condition with significant repairs and maintenance needed, particularly to the exterior siding and paint, flooring, and interior walls and ceilings. Painting and replacing the flooring would significantly increase its resale and rental value.
Repairs flagged
- Major exterior siding and paint — The siding and paint are peeling and in need of repainting.
- Major flooring — The flooring in the living room and kitchen is in poor condition and needs replacement.
- Major interior walls and ceilings — The interior walls and ceilings show signs of wear and tear, with peeling paint and discoloration.
Value-add opportunities
- Both painting the exterior and interior — Painting the exterior and interior will improve the curb appeal and the overall condition of the home, making it more attractive to potential buyers and renters.
- Both replacing the flooring — Replacing the flooring will improve the condition of the living room and kitchen, making the home more attractive to potential buyers and renters.
Renovation cost estimate screening
| Repair item | Severity | Est. cost |
|---|---|---|
| exterior siding and paint · The siding and paint are peeling and in need of repainting. | Major | $15,000–50,000 |
| flooring · The flooring in the living room and kitchen is in poor condition and needs replacement. | Major | $15,000–50,000 |
| interior walls and ceilings · The interior walls and ceilings show signs of wear and tear, with peeling paint and discoloration. | Major | $15,000–50,000 |
| Total estimated repair cost · 3 items | $45,000–150,000 |
Value-add ROI direction
- Both painting the exterior and interior — Painting the exterior and interior will improve the curb appeal and the overall condition of the home, making it more attractive to potential buyers and renters. ↑
- Both replacing the flooring — Replacing the flooring will improve the condition of the living room and kitchen, making the home more attractive to potential buyers and renters. ↑
ⓘ Cost ranges are severity-bucket heuristics (US national rule-of-thumb). Get contractor quotes + a written scope before underwriting a rehab budget.
Schools (NCES district)
- District
- Brownsville Area SD
- NCES district ID
- 4204080
- Math proficiency
- 17% ▼ -3.00%
- Reading proficiency
- 34% ▼ -5.00%
- Median HH income
- $34,500
- Composite
- 20.93/100
- National rank
- #8481
- State rank
- #472 of 539 in PA
Livability — Hiller
- Score
- 76/100
- State rank
- #375
- US rank
- #3312
Category grades
Schools grade is shown separately in the Schools card above.
Census & demographics
- Census place
- Hiller, PA
- City population
- 8,543
- Population (ZIP)
- 834
Population outlook (Fayette County) Hauer SSP2
- Today (2025)
- 127,561 people
- By 2030
- 123,206 · -3.4%
- By 2040
- 113,232 · -11.2%
- By 2050
- 103,468 · -18.9%
- By 2075
- 83,185 · -34.8%
- By 2100
- 62,384 · -51.1%
Race, ethnicity, and origin ACS 2023
- Neighborhood character
- Predominantly White (73%)
- Race & ethnicity
- White 73% Black 16% Hispanic / Latino 11% Two or more races 7%
- Hispanic origin (detail)
- Common ancestry
- Romanian 48% Iranian 1%
Political lean MEDSL · Fayette
- 2024 margin
- Solid R (+37.9) · D 30.8% · R 68.7%
- 2008→2024 swing
- -37.5pp toward R · 2008: -0.4pp · 2024: -37.9pp
- All cycles
- 2024: R+37.9 2020: R+33.5 2016: R+31.0 2012: R+8.3 2008: R+0.4
Not yet ingested
- Civics
- —
Market trends
- HPI YoY
- ▲ 0.09%
- Current HPI
- 207.985
- Rent YoY
- —
- Metro
- —
- State GDP YoY
- ▲ 1.68%
- F500 in state
- 34
Industry mix (Fortune 500 HQ in PA)
| Industry | F500 HQs | Revenue |
|---|---|---|
| Healthcare | 2 | $309B |
|
||
| Insurance | 2 | $27B |
|
||
| Telecommunications / Media | 1 | $124B |
|
||
| Industrial Distribution | 1 | $22B |
|
||
| Financial Services | 1 | $20B |
|
||
| Chemicals / Materials | 1 | $18B |
|
||
Price history
2 events — show timeline
- 2026-04-08 Pending — West Penn MLS
- 2026-03-24 Listed $119,900 West Penn MLS
Cash-flow waterfall
monthlySold comps — $/sqft
last 12 mo · ≤1 miLoading sold comps…