9122 Riverside Dr #2 · Cienega Springs, AZ
Flood risk No data
- FEMA flood zone
- —
- Chance of flooding over 30 yrs
- —
- Est. flood insurance / yr
- —
Fire risk No data
- Est. fire insurance / yr
- —
Heat risk No data
- Hot days now (above threshold)
- —
- Hot days in 30 yrs
- —
Wind risk No data
- Chance of severe wind over 30 yrs
- —
Air-quality risk No data
- Unhealthy air days now
- —
- Unhealthy air days in 30 yrs
- —
Risk factors via First Street. Map © Google.
Why this score? — see what drove the C+ grade
The composite is a weighted blend of 9 inputs, each scored 0–100. Each bar is that input's sub-score; the figure is the points it added to the 100-point composite (weight × sub-score).
- Cash flow +28.4/30.0
- DSCR +10.0/10.0
- 1% rule +7.9/10.0
- ARV discount +7.5/15.0
- Livability +3.2/5.0
- Rent growth +2.5/5.0
- Condition / age +2.5/5.0
- Schools +1.5/10.0
- Appreciation +0.0/10.0
$119,000
🖨 Deal sheet (PDF) 📄 Offer letter ✓ Due diligence
Listing remarks MLS
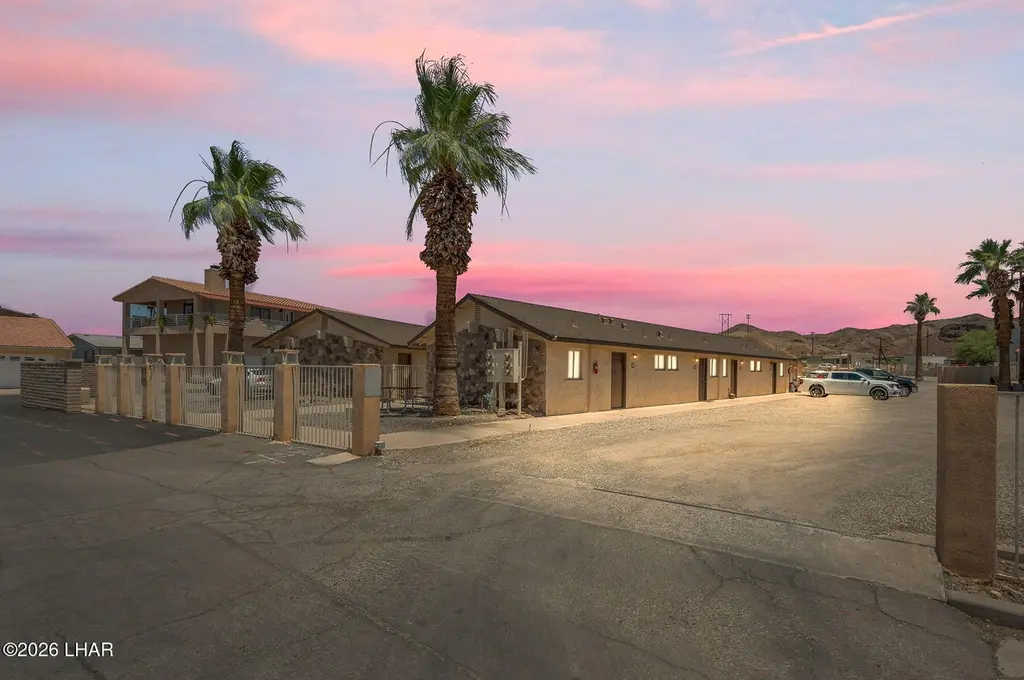
SPORTS VALLEY TOWNHOMES! Must See to Appreciate! Remodeled Nicer than most of the units in this Association! 2nd Unit- Closest to the River! Plenty of exterior parking for your Truck, Car or Boat. Located close to the Public Launch Ramp- Walk to convenience store or JA Johnny's Restaurant and Pizza Place!
Key facts
- Boat parking
- Open living area
- Common courtyard
Tags
Property features AI
Finance
- Other: Directions: Hwy 95 / Business Loop 95 - Riverside Dr. go about 1 mile Up Stream and townhomes will be on your left.; Subdivision: Sports Valley; Cross street: Moovalya Estates Dr
- HOA & community: Homeowners association with a $125 monthly fee; Sidewalks in the community
Exterior
- Parking: No designated parking listed
- Utilities: 200+ Amp electric service; Public sewer
- Home design: Residential townhouse; High-density residential zoning (PA-R-3)
- Construction: Block and stucco construction
- Exterior features: No additional exterior features listed; Block and wrought iron fencing; Shingle roof; Level lot; Has a view
Interior
- Kitchen: Breakfast bar; Electric water heater
- Flooring: Tile
- Bathrooms: 1 full bathroom
- Heating & cooling: Electric heating; Ceiling fan(s); Wall/window air conditioning units
- Interior features: Vaulted ceilings; Breakfast bar; Ceiling fans; Open floor plan; Window coverings; Furnished
Neighborhood map
What this means for you Summary
Snapshot
- This is a 1-bed/1.0-bath townhouse listed at $119k.
Deal economics
- At list price, monthly cash flow is $384 ($5k/yr) — positive.
- The deal already cash-flows at list — no discount required.
- Meets the 1% rule at list price ($2k rent vs $119k).
- Cap rate 10.2% vs local median 2.2% in Cienega Springs — top-decile yield for the area; either an underpriced asset or a hidden risk that comps aren't pricing in. Stress-test before assuming the spread holds.
Location & tenants
- Location reads 63/100 on livability (#107 in AZ) — a middle-class / working-renter tenant base. Strengths: crime A+, cost of living A+, housing A+; Watch: health & safety C-, schools F, amenities F.
- Parker Unified School District (4510) (town): math 18% / reading 18% proficiency, ranked #200 of 249 in AZ (top 80%) — low school quality limits family demand, transient renter base, plan for 1-2y turnover; 69% free/reduced lunch — lower-income household profile, screen leases tightly.
- Market conditions: 147 active listings in the ZIP; 92 units permitted in La Paz County in 2024 (0 in 5+ unit buildings).
Forward outlook
- Local home prices are declining (-3.0%/yr); year-one equity from $823 of loan paydown is wiped out by about $4k of value loss. Plan a longer hold.
- La Paz County population projected at -11% by 2050 — secular population decline; favor cash flow + early exit over multi-decade hold.
- At projected returns (-3.0% appreciation + 3.0% rent growth), your $33k cash investment doubles in ~9 years — after that, you're playing with house money.
Negotiation context
- Only 12 days on market — expect competitive offers; lowballing is unlikely to land.
- 3 sale attempts since 12y ago with the ask held roughly flat each time — persistent listings suggest the price (not the market) is what's stuck; bring a comps-based counter.
- Current owner paid $56k; list at $119k implies a 112% gain — meaningful room to come down on a strong offer.
Questions for the listing agent
- Built in 1961 — when were the roof, HVAC, electrical panel, plumbing, and water heater last replaced?
- What does the HOA fee cover, when was the last increase, and are there any pending special assessments or reserve-fund shortfalls?
- Is there a deadline driving the sale (1031 exchange, divorce, estate, relocation)? That informs how much negotiation room exists.
- Schools are F-rated, which usually means shorter tenancies and higher turnover. Who's the typical renter profile here, and what's been the actual vacancy rate?
- What's the average days-on-market for RENTAL listings here right now (not sales)? A rising rental-DOM trend means longer vacancies and softer asking-rent achievability than the comps imply.
- What's the recent tenant-quality profile in this submarket — average credit score on applications, eviction rate, late-payment / NSF rate, and stable-employment percentage? A property-management company in the area should have these aggregated.
- How much new for-sale + rental construction is in the pipeline within 1–3 miles? Heavy new supply typically softens prices + rents 12–24 months out; constrained supply supports both.
Investment metrics
- 1% rule
- 1.29% ✓
- Cap rate
- 10.17%
- Cash-on-cash
- 13.84%
- DSCR
- 1.62
- GRM
- 6.5
CMA / ARV
- ARV (on-the-fly)
- $60,000
- Comps found
- 1
Show comp detail 1 sale within ~0.75 mi
| Address | Dist | Beds/Ba | Sqft | Sold | Price | $/sf | Match |
|---|---|---|---|---|---|---|---|
| 9122 Riverside Dr #19 | 0.00mi | 1/1.0 | 420 (-12%) | 2mo | $52,500 | $125 | 78 |
Match score weights: distance 35% · size 25% · config 20% · recency 20%. Top-matched comps best support the ARV.
Projected returns pro-forma
-3.0% appreciation · 3.0% rent growth · sell at horizon
- IRR
- 4.1%
- Equity multiple
- 1.16×
- Total profit
- $5,215
- Equity at exit
- $17,743
- IRR
- 13.6%
- Equity multiple
- 2.09×
- Total profit
- $36,159
- Equity at exit
- $10,289
Cash invested: $33,320 (down + closing). Projections, not guarantees.
Landlord ↔ Tenant lean methodology
- Overall (STATE)
- 87 Strongly Landlord-Friendly
- State Arizona
- 87 Strongly Landlord-Friendly · R+3
- County
- — inherits STATE
- City
- — inherits STATE
ZIP-level market 85344
- Active inventory
- 147
- Price-to-rent
- 6.5×
Monthly cashflow live
- Estimated rent
- $1,534 medium interval (Pro) →
- Mortgage (P&I)
- −$624
- Tax from tax record
- −$29 /mo · $344/yr
- Insurance
- −$50
- HOA
- −$125
- Vacancy / Maint / Mgmt
- −$322
- Net cashflow
- $384
Break-even live
Sensitivity live
| Price | -10% $452 | -5% $418 | +0% $384 | +5% $351 | +10% $317 |
|---|---|---|---|---|---|
| Rent | -10% $263 | -5% $324 | +0% $384 | +5% $445 | +10% $505 |
| Rate | -1.0pp $444 | -0.5pp $415 | base $384 | +0.5pp $353 | +1.0pp $322 |
UW: 25.0% down · 7.5% · 30yr · 1.5% tax · 5.0% vac · 8.0% maint · 8.0% mgmt
Financing live
Cash to close
- Down payment
- $29,750
- Closing costs
- $3,570
- Reserves months
- —
- Total cash needed
- —
Loan-product check · same deal, 3 products live
Conventional
25% down · 7.5% · 30yr
- Down + closing
- —
- Monthly P&I
- —
- Monthly cashflow
- —
- DSCR
- —
- Eligible?
- —
Personal DTI + credit; lowest rate.
DSCR
20% down · 8.5% · 30yr
- Down + closing
- —
- Monthly P&I
- —
- Monthly cashflow
- —
- DSCR
- —
- Eligible?
- —
No personal income docs; deal must DSCR.
Hard money
10% down · 12.0% · 12mo
- Down + closing
- —
- Monthly P&I
- —
- Monthly cashflow
- —
- DSCR
- —
- Eligible?
- —
Short-term bridge; refi at stabilization.
HOA detail
- Monthly dues
- $125 · $1,500/yr
Listing history 9 events
-
2026-06-02status $119,000 Pending 12 DOM
-
2026-06-01days on market $119,000 Active 12 DOM
-
2026-05-31days on market $119,000 Active 11 DOM
-
2026-05-30days on market $119,000 Active 10 DOM
-
2026-05-20$119,000 Active
-
2020-06-03soldstatus $56,000 310-char remark
Show marketing remark (310 chars)
SPORTS VALLEY TOWNHOMES! Must See to Appreciate! Remodeled Nicer than most of the units in this Association! 2nd Unit- Closest to the River! Plenty of exterior parking for your Truck, Car or Boat. Located close to the Public Launch Ramp- Walk to convenience store or JA Johnny's Restaurant and Pizza Place!
-
2020-05-12$55,000 310-char remark
Show marketing remark (310 chars)
SPORTS VALLEY TOWNHOMES! Must See to Appreciate! Remodeled Nicer than most of the units in this Association! 2nd Unit- Closest to the River! Plenty of exterior parking for your Truck, Car or Boat. Located close to the Public Launch Ramp- Walk to convenience store or JA Johnny's Restaurant and Pizza Place!
-
2014-04-30$44,000
-
2012-11-28soldstatus $17,500
ⓘ Source: listings_history table (triggers on properties + properties_extension) + one-shot
backfill from property_details.listing_events for pre-trigger history.
Tax reassessment forecast AZ · Resets to sale price
- Current annual tax
- $344 · $29/mo
- Projected year-2 tax
- $785 · $65/mo
- Expected delta
- +$441/yr (+$37/mo · 128.4%)
ⓘ Screening estimate from a state-policy table — verify with the county assessor before closing.
Nearby sold comps map
Loading sold comps map…
Walkable amenities ~0.75 mi
Loading nearby amenities…
Taxation est. · year 1
- Rental income
- $18,403
- − Mortgage interest
- −$6,666
- − Property taxes
- −$344
- − Insurance
- −$595
- − Repairs & maintenance
- −$1,472
- − Management
- −$1,472
- − HOA
- −$1,500
- − Depreciation
- −$3,462
- Taxable income
- $2,892
- Est. tax owed @ 24.0%
- −$694
- After-tax cash flow
- $3,917/yr
For passive investors: Depreciation is non-cash, so a rental often shows a tax loss while cash-flowing — sheltering income. Rental losses are passive: they offset passive income freely, and up to $25,000/yr can offset ordinary (W-2) income if you actively participate and your MAGI is under $100k (phasing out to $0 by $150k); unused losses carry forward. On sale, claimed depreciation is recaptured at up to 25%, and gains may owe capital-gains tax (a 1031 exchange can defer both). Figures are a year-1 estimate at your 24.0% rate — not tax advice; consult a CPA.
Schools (NCES district)
- District
- Parker Unified School District (4510)
- NCES district ID
- 0405980
- Math proficiency
- 18% ▼ -10.00%
- Reading proficiency
- 18% ▼ -7.00%
- Median HH income
- $34,354
- Composite
- 14.76/100
- National rank
- #9392
- State rank
- #200 of 249 in AZ
Livability — Cienega Springs
- Score
- 63/100
- State rank
- #107
- US rank
- #14934
Category grades
Schools grade is shown separately in the Schools card above.
Census & demographics
- Census place
- Cienega Springs, AZ
- Population (ZIP)
- 9,069
Population outlook (La Paz County) Hauer SSP2
- Today (2025)
- 18,409 people
- By 2030
- 17,592 · -4.4%
- By 2040
- 16,600 · -9.8%
- By 2050
- 16,328 · -11.3%
- By 2075
- 17,075 · -7.2%
- By 2100
- 17,042 · -7.4%
Race, ethnicity, and origin ACS 2023
- Neighborhood character
- Highly diverse neighborhood (Simpson 0.72)
- Race & ethnicity
- White 40% Hispanic / Latino 34% Native American 23% Two or more races 19% Asian 2%
- Hispanic origin (detail)
- Mexican 32%
- Common ancestry
- Slovak 1% Lithuanian 1% Portuguese 1%
- Foreign-born
- 10% · Canada
- Languages at home
- 74% English-only · Spanish 21% Other Indo-European 1% Tagalog/Filipino 1%
Political lean MEDSL · La Paz
- 2024 margin
- Solid R (+44.2) · D 27.6% · R 71.8%
- 2008→2024 swing
- -15.7pp toward R · 2008: -28.5pp · 2024: -44.2pp
- All cycles
- 2024: R+44.2 2020: R+38.8 2016: R+41.8 2012: R+32.2 2008: R+28.5
Not yet ingested
- Civics
- —
Market trends
- HPI YoY
- ▼ -155.38%
- Current HPI
- 198.2271
- Rent YoY
- —
- Metro
- —
- State GDP YoY
- ▲ 4.54%
- F500 in state
- 20
Industry mix (Fortune 500 HQ in AZ)
| Industry | F500 HQs | Revenue |
|---|---|---|
| Technology | 2 | $13B |
|
||
| Mining / Metals | 1 | $23B |
|
||
| Environmental Services | 1 | $16B |
|
||
| Metals / Steel | 1 | $14B |
|
||
| Technology Distribution | 1 | $9B |
|
||
| Homebuilding | 1 | $8B |
|
||
Price history
+580.0% since first listed5 events — show timeline
- 2026-05-20 Listed $119,000 LHAR
- 2020-06-03 Sold (MLS) $56,000 LHAR
- 2020-05-12 Listed $55,000 LHAR
- 2014-04-30 Listed $44,000 WARDEX
- 2012-11-28 Sold (Public Records) $17,500 Public Records
Property tax history
+1.4%/yrLatest (2025): $344 · +5.1% YoY. Source: county tax records.
Cash-flow waterfall
monthlySold comps — $/sqft
last 12 mo · ≤1 miLoading sold comps…