204 W Sugarmaple Ln · Pine Ridge, FL
Flood risk 9/10 · Severe
- FEMA flood zone
- X (unshaded)
- Chance of flooding over 30 yrs
- 0.99%
- Est. flood insurance / yr
- $507 – $1,088
Fire risk 5/10 · Moderate
- Est. fire insurance / yr
- $947 – $1,759
Heat risk 9/10 · Severe
- Hot days now (above 108°F)
- 7 days/yr
- Hot days in 30 yrs
- 23 days/yr
Wind risk 9/10 · Severe
- Chance of severe wind over 30 yrs
- 99.0%
Air-quality risk 1/10 · Minimal
- Unhealthy air days now
- 0 days/yr
- Unhealthy air days in 30 yrs
- 0 days/yr
Risk factors via First Street. Map © Google.
Why this score? — see what drove the D+ grade
The composite is a weighted blend of 9 inputs, each scored 0–100. Each bar is that input's sub-score; the figure is the points it added to the 100-point composite (weight × sub-score).
- Cash flow +14.3/30.0
- ARV discount +13.4/15.0
- DSCR +4.4/10.0
- Schools +4.1/10.0
- 1% rule +3.6/10.0
- Livability +3.4/5.0
- Rent growth +2.5/5.0
- Condition / age +2.5/5.0
- Appreciation +0.0/10.0
$195,000
🖨 Deal sheet 📄 Offer letter ✓ Due diligence
Listing remarks MLS
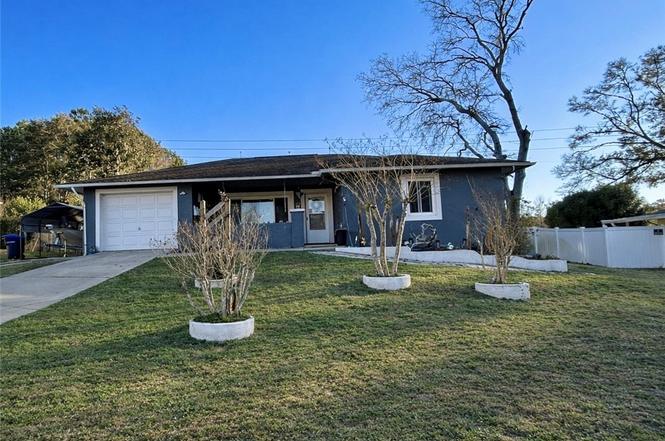
Well maintained one-owner home in wonderful neighborhood. 2 bedrooms, 2 baths, 1 car garage. Newer A/C with Heat pump newer roof. Recently painted. Eat in Kitchen with all appliances. Living Room Family Room. Peaceful private view in back yard. Desirable neighborhood.
Key facts
- Close to town
- Fenced backyard
- 0.24 acre lot
Tags
Property features AI
Exterior
- Parking: Attached garage with garage door opener; Concrete driveway; 1 garage space (total 1 parking space)
- Security: Smoke detector(s)
- Utilities: Public water; Public sewer
- Home design: Single-family residence; One level
- Construction: Stucco construction; Asphalt shingle roof; Block foundation; Built as residential single-family home
- Exterior features: Privacy, vinyl and wood fencing; Landscaped lot; Paved road access; Varied topography; No pool
Interior
- Kitchen: Dishwasher; Electric oven; Microwave; Refrigerator
- Flooring: Tile; Wood
- Bathrooms: 2 full bathrooms
- Heating & cooling: Heat pump heating; Central air conditioning
- Interior features: Eat-in kitchen; Open floor plan; High-speed internet access; Drapes and window coverings; Smoke detector(s)
- Laundry & utility: Washer; Dryer
Neighborhood map
What this means for you Summary
Snapshot
- This is a 2-bed/2.0-bath single-family listed at $195k.
Deal economics
- At list price, monthly cash flow is $-30 ($-365/yr) — negative.
- To cash-flow at today's rent, offer at most $190k (2.8% below list).
- To meet the 1% rule (rent ≥ 1% of price), the offer needs to be $167k (14.4% below list).
- Recommended offer: $167k (14.4% below list) — sets the bar for 1% rule.
- Cap rate 6.5% vs local median 3.4% in Pine Ridge — top-decile yield for the area; either an underpriced asset or a hidden risk that comps aren't pricing in. Stress-test before assuming the spread holds.
Location & tenants
- Location reads 67/100 on livability (#565 in FL) — a middle-class / working-renter tenant base. Strengths: crime A+, housing A+, cost of living A-; Watch: health & safety C-, amenities F, commute F.
- Citrus (rural): math 49% / reading 50% proficiency, ranked #44 of 73 in FL (top 60%) — families likely to look elsewhere, expect single-tenant / working-renter base with shorter leases.
- Zoned schools: Forest Ridge Elementary School (math 55% / reading 59%, grade C+, #781 of 2,144 statewide, top 38%, 708 students, 67% FRL); Citrus Springs Middle School (math 55% / reading 54%, grade B-, #183 of 571 statewide, top 34%, 821 students, 59% FRL); Lecanto High School (math 46% / reading 53%, grade D, #179 of 667 statewide, top 29%, 1,630 students, 46% FRL) — zoned schools at 57% FRL track the district average.
- Market conditions: 396 active listings in the ZIP; 16 comparable units currently listed for rent nearby; rentals at typical pace (median 21d on market — plan ~3-4 weeks tenant-placement turnaround); 2,443 units permitted in Citrus County in 2024 (0 in 5+ unit buildings).
- This rent runs 37% of the median local income ($55k/yr) — at the standard rent-burdened threshold; future hikes will face affordability resistance.
Forward outlook
- Local home prices are declining (-3.0%/yr); year-one equity from $1k of loan paydown is wiped out by about $6k of value loss. Plan a longer hold.
- Citrus County population projected to shrink 10% by 2050 — rents likely to lag national; underwrite the cash flow, not the appreciation.
Negotiation context
- It's been on market 104 days — a 9% lower offer ($177k) is reasonable based on typical stale-listing flexibility.
- 3 sale attempts since 24y ago; this cycle's ask has dropped $20k (9%) from the opening price — seller is motivated, your offer sets the floor, not the list.
- Current owner paid $72k; list at $195k implies a 171% gain — meaningful room to come down on a strong offer.
Risks & watch-outs
- Watch-outs: flood insurance adds $66/mo.
- Climate carrying-cost: severe flood risk; severe wind risk, 99% chance of damaging wind over 30y; moderate wildfire risk; extreme-heat days projected 7→23/yr by 2055 (HVAC capex compounding) — expect insurance premiums to compound above CPI over the hold.
Questions for the listing agent
- What do current leases actually rent for vs. the listed asking? Can we see a recent rent roll and the last 12 months of T-12 income?
- It's been on market 104 days. Have you received any prior offers? Is the seller open to a 14% concession, seller financing, or rate buy-down credit?
- What's the actual annual flood-insurance premium (NFIP or private), and is the property in a SFHA with mandatory coverage?
- Why hasn't it sold? Are there any deal-killer items the seller is aware of (foundation, flood, title, zoning, code violations)?
- Is there a deadline driving the sale (1031 exchange, divorce, estate, relocation)? That informs how much negotiation room exists.
- Schools are F-rated, which usually means shorter tenancies and higher turnover. Who's the typical renter profile here, and what's been the actual vacancy rate?
- The area grade is low — what's the realistic commute time and amenity access for the typical tenant pool here? Any planned neighborhood developments (good or bad) we should know about?
- What's the average days-on-market for RENTAL listings here right now (not sales)? A rising rental-DOM trend means longer vacancies and softer asking-rent achievability than the comps imply.
- What's the recent tenant-quality profile in this submarket — average credit score on applications, eviction rate, late-payment / NSF rate, and stable-employment percentage? A property-management company in the area should have these aggregated.
- How much new for-sale + rental construction is in the pipeline within 1–3 miles? Heavy new supply typically softens prices + rents 12–24 months out; constrained supply supports both.
Investment metrics
- 1% rule
- 0.86% ✗
- Cap rate
- 6.51%
- Cash-on-cash
- 0.79%
- DSCR
- 1.04
- GRM
- 9.7
CMA / ARV
- ARV (on-the-fly)
- $224,352
- Comps found
- 12
Show comp detail 12 sales within ~0.75 mi
| Address | Dist | Beds/Ba | Sqft | Sold | Price | $/sf | Match |
|---|---|---|---|---|---|---|---|
| 388 W Sugarmaple Ln | 0.19mi | 2/2.0 | 1,304 (-5%) | 1mo | $192,000 | $147 | 83 |
| 241 W Valerian Pl | 0.58mi | 2/2.0 | 1,344 (-2%) | 2mo | $219,999 | $164 | 68 |
| 377 W Sugarmaple Ln | 0.18mi | 2/2.5 | 1,547 (+13%) | 4mo | $237,000 | $153 | 64 |
| 3635 N Honeylocust Dr | 0.64mi | 2/2.0 | 1,326 (-3%) | 1mo | $233,000 | $176 | 64 |
| 146 W Seymeria Dr | 0.12mi | 2/1.5 | 1,170 (-14%) | 6mo | $219,000 | $187 | 63 |
| 3525 N Burroughs Path | 0.59mi | 3/2.0 (+1) | 1,388 (+2%) | 3mo | $223,500 | $161 | 63 |
| 2924 N Anthony Ave | 0.43mi | 3/2.0 (+1) | 1,512 (+10%) | 2mo | $349,000 | $231 | 56 |
| 785 W Toucan Loop | 0.58mi | 2/2.0 | 1,250 (-9%) | 4mo | $225,000 | $180 | 55 |
| 605 W Buttonbush Dr | 0.43mi | 2/1.5 | 1,184 (-14%) | 1mo | $132,000 | $111 | 55 |
| 246 W Valerian Pl | 0.55mi | 2/2.0 | 1,480 (+8%) | 8mo | $230,000 | $155 | 54 |
| 3579 N Tamarisk Ave | 0.59mi | 3/2.0 (+1) | 1,476 (+8%) | 2mo | $284,400 | $193 | 53 |
| 3509 N Honeylocust Dr | 0.51mi | 3/1.5 (+1) | 1,545 (+13%) | 5mo | $195,000 | $126 | 43 |
Match score weights: distance 35% · size 25% · config 20% · recency 20%. Top-matched comps best support the ARV.
Projected returns pro-forma
-3.0% appreciation · 3.0% rent growth · sell at horizon
- IRR
- -17.4%
- Equity multiple
- 0.39×
- Total profit
- $-33,508
- Equity at exit
- $29,075
- IRR
- -9.4%
- Equity multiple
- 0.42×
- Total profit
- $-31,564
- Equity at exit
- $16,860
Cash invested: $54,600 (down + closing). Projections, not guarantees.
Landlord ↔ Tenant lean methodology
- Overall (STATE)
- 87 Strongly Landlord-Friendly
- State Florida
- 87 Strongly Landlord-Friendly · R+3
- County
- — inherits STATE
- City
- — inherits STATE
ZIP-level market 34465
- Home prices YoY
- -33.1%
- Active inventory
- 396
- Price-to-rent
- 9.7×
Monthly cashflow live
- Estimated rent
- $1,670 high interval (Pro) →
- Mortgage (P&I)
- −$1,023
- Tax from tax record
- −$179 /mo · $2,148/yr
- Insurance
- −$81
- Flood insurance flood zone
- −$66 /mo · $798/yr
- HOA
- −$0
- Vacancy / Maint / Mgmt
- −$351
- Net cashflow
- $-30
Break-even live
UW: 25.0% down · 7.5% · 30yr · 1.5% tax · 5.0% vac · 8.0% maint · 8.0% mgmt
Financing live
Cash to close
- Down payment
- $48,750
- Closing costs
- $5,850
- Reserves months
- —
- Total cash needed
- —
Loan-product check · same deal, 3 products live
Conventional
25% down · 7.5% · 30yr
- Down + closing
- —
- Monthly P&I
- —
- Monthly cashflow
- —
- DSCR
- —
- Eligible?
- —
Personal DTI + credit; lowest rate.
DSCR
20% down · 8.5% · 30yr
- Down + closing
- —
- Monthly P&I
- —
- Monthly cashflow
- —
- DSCR
- —
- Eligible?
- —
No personal income docs; deal must DSCR.
Hard money
10% down · 12.0% · 12mo
- Down + closing
- —
- Monthly P&I
- —
- Monthly cashflow
- —
- DSCR
- —
- Eligible?
- —
Short-term bridge; refi at stabilization.
Rent comps 16 comps
| Address | Beds | Baths | Sqft | Rent | $/sqft | DOM | Units | Dist |
|---|---|---|---|---|---|---|---|---|
| 144 W Sugarmaple Ln Beverly Hills, FL | 3.0 | 2.0 | 1600 | $1,700 | $1.06 | 21d | 1 | 0.06mi |
| 229 W Casurina Pl Beverly Hills, FL | 3.0 | 2.0 | 1604 | $1,399 | $0.87 | 21d | 1 | 0.26mi |
| 3442 N Tamarisk Ave Unit NA Beverly Hills, FL | 3.0 | 2.0 | 1530 | $1,800 | $1.18 | 21d | 1 | 0.41mi |
| 703 W Sunbird Path Hernando, FL | 2.0 | 2.0 | 1298 | $1,700 | $1.31 | 21d | 1 | 0.52mi |
| 3660 N Laurelwood Loop Beverly Hills, FL | 2.0 | 2.5 | 1543 | $1,800 | $1.17 | 21d | 1 | 0.67mi |
| 3263 N Maidencane Dr Beverly Hills, FL | 2.0 | 1.0 | 1380 | $1,350 | $0.98 | 21d | 1 | 0.88mi |
| 2280 N Hardee Pt Hernando, FL | 2.0 | 2.0 | 1118 | $1,700 | $1.52 | 21d | 1 | 0.96mi |
| 877 W Silver Meadow Loop Hernando, FL | 3.0 | 2.0 | 1637 | $2,500 | $1.53 | 21d | 1 | 1.01mi |
| 95 S Desoto St Beverly Hills, FL | 2.0 | 2.0 | 1152 | $1,435 | $1.25 | 21d | 1 | 1.17mi |
| 17 N Davis St Beverly Hills, FL | 2.0 | 1.0 | 1108 | $1,000 | $0.90 | 21d | 1 | 1.17mi |
| 1240 W Diamond Shore Loop Hernando, FL | 2.0 | 2.0 | 1770 | $2,900 | $1.64 | 21d | 1 | 1.23mi |
| 23 N Lee St Beverly Hills, FL | 2.0 | 1.0 | 1416 | $1,350 | $0.95 | 21d | 1 | 1.24mi |
| 1281 W Diamond Shore Loop Hernando, FL | 2.0 | 2.0 | 1686 | $3,000 | $1.78 | 21d | 1 | 1.28mi |
| 42 Roosevelt Blvd Unit 1 Beverly Hills, FL | 3.0 | 1.5 | 1612 | $1,449 | $0.90 | 21d | 1 | 1.38mi |
| 95 S Fillmore St Beverly Hills, FL | 2.0 | 1.0 | 1056 | $1,300 | $1.23 | 21d | 1 | 1.38mi |
| 45 S Jackson St Beverly Hills, FL | 2.0 | 1.0 | 1108 | $1,275 | $1.15 | 21d | 1 | 1.46mi |
Listing history 25 events
-
2026-06-19days on market $195,000 Active 104 DOM
-
2026-06-18days on market $195,000 Active 103 DOM
-
2026-06-17days on market $195,000 Active 102 DOM
-
2026-06-17price $195,000 Active 101 DOM
-
2026-06-16days on market $199,900 Active 101 DOM
-
2026-06-15days on market $199,900 Active 100 DOM
-
2026-06-14days on market $199,900 Active 98 DOM
-
2026-06-13days on market $199,900 Active 97 DOM
-
2026-06-09days on market $199,900 Active 94 DOM
-
2026-06-08days on market $199,900 Active 93 DOM
-
2026-06-03days on market $199,900 Active 88 DOM
-
2026-06-02days on market $199,900 Active 87 DOM
-
2026-06-01days on market $199,900 Active 86 DOM
-
2026-05-31days on market $199,900 Active 85 DOM
-
2026-05-30days on market $199,900 Active 84 DOM
-
2026-05-16price $199,900
-
2026-04-28price $209,000
-
2026-04-06status Active
-
2026-03-08status Pending
-
2026-02-07$215,000 Active
-
2002-10-15soldstatus $72,000
-
2002-10-14soldstatus $72,000 273-char remark
Show marketing remark (273 chars)
Well maintained one-owner home in wonderful neighborhood. 2 bedrooms, 2 baths, 1 car garage. Newer A/C with Heat pump newer roof. Recently painted. Eat in Kitchen with all appliances. Living Room Family Room. Peaceful private view in back yard. Desirable neighborhood.
-
2002-07-22soldstatus $60,000
-
2002-07-18$73,000 273-char remark
Show marketing remark (273 chars)
Well maintained one-owner home in wonderful neighborhood. 2 bedrooms, 2 baths, 1 car garage. Newer A/C with Heat pump newer roof. Recently painted. Eat in Kitchen with all appliances. Living Room Family Room. Peaceful private view in back yard. Desirable neighborhood.
-
1987-07-01soldstatus $64,100
ⓘ Source: listings_history table (triggers on properties + properties_extension) + one-shot
backfill from property_details.listing_events for pre-trigger history.
Tax reassessment forecast FL · Resets to sale price
- Current annual tax
- $2,148 · $179/mo
- Projected year-2 tax
- $2,148 · $179/mo
- Expected delta
- $0/yr ($0/mo · 0.0%)
ⓘ Screening estimate from a state-policy table — verify with the county assessor before closing.
Climate risk First Street
- Flood 9/10 Extreme FEMA zone X (unshaded) · 99% chance over 30 yrs
- Wildfire 5/10 Major
- Heat 9/10 Extreme 7 d/yr ≥108°F today · 23 d/yr by 30 yrs out
- Wind 9/10 Extreme 99% chance of damaging wind over 30 yrs
- Air quality 1/10 Low 0 unhealthy d/yr today · 0 by 30 yrs out
Nearby sold comps map
Loading sold comps map…
Walkable amenities ~0.75 mi
Loading nearby amenities…
Taxation est. · year 1
- Rental income
- $20,034
- − Mortgage interest
- −$10,923
- − Property taxes
- −$2,148
- − Insurance
- −$1,772
- − Repairs & maintenance
- −$1,603
- − Management
- −$1,603
- − Depreciation
- −$5,673
- Taxable loss
- −$3,688
- Est. tax savings @ 24.0%
- +$885
- After-tax cash flow
- $520/yr
For passive investors: Depreciation is non-cash, so a rental often shows a tax loss while cash-flowing — sheltering income. Rental losses are passive: they offset passive income freely, and up to $25,000/yr can offset ordinary (W-2) income if you actively participate and your MAGI is under $100k (phasing out to $0 by $150k); unused losses carry forward. On sale, claimed depreciation is recaptured at up to 25%, and gains may owe capital-gains tax (a 1031 exchange can defer both). Figures are a year-1 estimate at your 24.0% rate — not tax advice; consult a CPA.
Schools (NCES district)
- District
- Citrus
- NCES district ID
- 1200270
- Math proficiency
- 49% ▼ -10.00%
- Reading proficiency
- 50% ▼ -6.00%
- Median HH income
- $38,618
- Composite
- 41.28/100
- National rank
- #3519
- State rank
- #44 of 73 in FL
Livability — Pine Ridge
- Score
- 67/100
- State rank
- #565
- US rank
- #10798
Category grades
Schools grade is shown separately in the Schools card above.
Census & demographics
- Census place
- Pine Ridge, FL
- County
- Citrus County · 111,314 people
- City population
- 18,514
- Metro
- Homosassa Springs, FL
- Population (ZIP)
- 18,879
- Household income
- $54,869
- Rent vs Own
- Severe rent burden
- 334.0
Population outlook (Citrus County) Hauer SSP2
- Today (2025)
- 138,622 people
- By 2030
- 136,886 · -1.3%
- By 2040
- 132,009 · -4.8%
- By 2050
- 125,196 · -9.7%
- By 2075
- 108,570 · -21.7%
- By 2100
- 84,454 · -39.1%
Race, ethnicity, and origin ACS 2023
- Neighborhood character
- Predominantly White (82%)
- Race & ethnicity
- White 82% Hispanic / Latino 8% Black 4% Two or more races 3% Asian 2%
- Hispanic origin (detail)
- Mexican 1% Puerto Rican 3%
- Common ancestry
- Romanian 4% Lithuanian 3% Slovak 2%
- Foreign-born
- 8% · Canada, Vietnam, Dominican Republic
- Languages at home
- 93% English-only · Spanish 4% French/Haitian/Cajun 1% Other Asian/Pacific 1%
Political lean MEDSL · Citrus
- 2024 margin
- Solid R (+45.9) · D 26.8% · R 72.6%
- 2008→2024 swing
- -29.8pp toward R · 2008: -16.1pp · 2024: -45.9pp
- All cycles
- 2024: R+45.9 2020: R+41.0 2016: R+39.7 2012: R+21.9 2008: R+16.1
Not yet ingested
- Civics
- —
Market trends
- HPI YoY
- ▼ -138.62%
- Current HPI
- 279.7183
- Rent YoY
- —
- Metro
- Homosassa Springs, FL
- State GDP YoY
- ▲ 3.28%
- F500 in state
- 36
Industry mix (Fortune 500 HQ in FL)
| Industry | F500 HQs | Revenue |
|---|---|---|
| Industrial Technology | 2 | $29B |
|
||
| Insurance | 2 | $17B |
|
||
| Retail | 1 | $60B |
|
||
| Technology Distribution | 1 | $58B |
|
||
| Homebuilding | 1 | $35B |
|
||
| Technology Manufacturing | 1 | $35B |
|
||
Price history
+211.9% since first listed10 events — show timeline
- 2026-05-16 Price Changed $199,900 RACC
- 2026-04-28 Price Changed $209,000 RACC
- 2026-04-06 Relisted — RACC
- 2026-03-08 Pending — RACC
- 2026-02-07 Listed $215,000 RACC
- 2002-10-15 Sold (Public Records) $72,000 Public Records
- 2002-10-14 Sold (MLS) $72,000 RACC
- 2002-07-22 Sold (Public Records) $60,000 Public Records
- 2002-07-18 Listed $73,000 RACC
- 1987-07-01 Sold (Public Records) $64,100 Public Records
Property tax history
+15.2%/yrLatest (2025): $2,148 · +2.7% YoY. Source: county tax records.
Cash-flow waterfall
monthlySold comps — $/sqft
last 12 mo · ≤1 miLoading sold comps…