20 Russel Rd #119 · Salinas, CA
Flood risk 4/10 · Minor
- FEMA flood zone
- X (shaded)
- Chance of flooding over 30 yrs
- 0.22%
- Est. flood insurance / yr
- $507 – $1,088
Fire risk 4/10 · Minor
- Est. fire insurance / yr
- $659 – $1,223
Heat risk 3/10 · Minor
- Hot days now (above 81°F)
- 6 days/yr
- Hot days in 30 yrs
- 13 days/yr
Wind risk 1/10 · Minimal
- Chance of severe wind over 30 yrs
- —
Air-quality risk 7/10 · Major
- Unhealthy air days now
- 11 days/yr
- Unhealthy air days in 30 yrs
- 11 days/yr
Risk factors via First Street. Map © Google.
Why this score? — see what drove the B- grade
The composite is a weighted blend of 9 inputs, each scored 0–100. Each bar is that input's sub-score; the figure is the points it added to the 100-point composite (weight × sub-score).
- Cash flow +30.0/30.0
- 1% rule +10.0/10.0
- DSCR +10.0/10.0
- ARV discount +5.4/15.0
- Rent growth +3.7/5.0
- Livability +3.2/5.0
- Schools +3.0/10.0
- Condition / age +2.0/5.0
- Appreciation +0.0/10.0
$151,000
🖨 Deal sheet 📄 Offer letter ✓ Due diligence
Listing remarks MLS
Welcome to Cal Hawaiian Mobile Home Park! Dont miss this opportunity at 20 Russell Rd #119 one of the lowest-priced homes in the area! This mobile home needs some work, but thats exactly where the value is Perfect for first-time buyers!!! Opportunities like this don't last!!!
Key facts
- Built 1965
- Listed 62 days
Property features AI
Finance
- Other: Park site identified as leased land; Property primary ID: 742975; Section serial number: C2250
- HOA & community: Community pool; Club house; Playground; Indoor half basketball court; Barbecue area; Common utility room
Exterior
- Parking: Carport (space #119, space rent $1,600)
- Utilities: Public water; Public sewer; Public utilities
- Home design: Leased land (park home site)
- Exterior features: Rolled composition roof; Living area approximately 936 (source: assessor)
Interior
- Kitchen: Microwave; Electric oven/range; Refrigerator
- Bedrooms: 3 bedrooms
- Bathrooms: 1 full bathroom
- Heating & cooling: Wall furnace heating
- Interior features: Laundry room with hookups
- Laundry & utility: Washer/dryer hookups
Neighborhood map
What this means for you Summary
Snapshot
- This is a 3-bed/1.0-bath manufactured listed at $151k. Condition is rated fair.
Deal economics
- At list price, monthly cash flow is $1k ($16k/yr) — positive.
- The deal already cash-flows at list — no discount required.
- Meets the 1% rule at list price ($3k rent vs $151k).
- Recommended offer: $142k (6.0% below list) — sets the bar for market timing.
- Cap rate 16.7% vs local median 2.7% in Salinas — top-decile yield for the area; either an underpriced asset or a hidden risk that comps aren't pricing in. Stress-test before assuming the spread holds.
Location & tenants
- Location reads 63/100 on livability (#465 in CA) — a middle-class / working-renter tenant base. Strengths: commute A+, health & safety A+, employment B+; Watch: schools F, crime D-, amenities F.
- Salinas Union High (urban): math 23% / reading 39% proficiency, ranked #998 of 1,400 in CA (top 71%) — families likely to look elsewhere, expect single-tenant / working-renter base with shorter leases; 66% free/reduced lunch — lower-income household profile, screen leases tightly.
- Market conditions: Rents rising fast (+4.9%/yr); 45 active listings in the ZIP; 8 comparable units currently listed for rent nearby; rentals at typical pace (median 14d on market — plan ~3-4 weeks tenant-placement turnaround); solid renter incomes; 530 units permitted in Monterey County in 2024 (50 in 5+ unit buildings).
- This rent runs 37% of the median local income ($98k/yr) — at the standard rent-burdened threshold; future hikes will face affordability resistance.
Forward outlook
- Local home prices are declining (-3.0%/yr); year-one equity from $1k of loan paydown is wiped out by about $5k of value loss. Plan a longer hold.
- Monterey County population projected at +10% by 2050 — modest demand growth; plan on rents tracking national, not racing it.
- At projected returns (-3.0% appreciation + 4.9% rent growth), your $42k cash investment doubles in ~4 years — after that, you're playing with house money.
Negotiation context
- It's been on market 62 days — a 6% lower offer ($142k) is reasonable based on typical stale-listing flexibility.
- 2 sale attempts with the ask held roughly flat each time — persistent listings suggest the price (not the market) is what's stuck; bring a comps-based counter.
Questions for the listing agent
- It's been on market 62 days. Have you received any prior offers? Is the seller open to a 6% concession, seller financing, or rate buy-down credit?
- Have any recent inspections been done? Can we get a copy of the seller's disclosures and any deferred-maintenance estimates?
- Built in 1965 — when were the roof, HVAC, electrical panel, plumbing, and water heater last replaced?
- Why hasn't it sold? Are there any deal-killer items the seller is aware of (foundation, flood, title, zoning, code violations)?
- Is there a deadline driving the sale (1031 exchange, divorce, estate, relocation)? That informs how much negotiation room exists.
- Schools are F-rated, which usually means shorter tenancies and higher turnover. Who's the typical renter profile here, and what's been the actual vacancy rate?
- Crime grade is D in this area — have there been break-ins, vandalism, or insurance claims at this property in the last 3 years? What carrier currently insures it and at what premium?
- What's the average days-on-market for RENTAL listings here right now (not sales)? A rising rental-DOM trend means longer vacancies and softer asking-rent achievability than the comps imply.
- What's the recent tenant-quality profile in this submarket — average credit score on applications, eviction rate, late-payment / NSF rate, and stable-employment percentage? A property-management company in the area should have these aggregated.
- How much new for-sale + rental construction is in the pipeline within 1–3 miles? Heavy new supply typically softens prices + rents 12–24 months out; constrained supply supports both.
Investment metrics
- 1% rule
- 1.97% ✓
- Cap rate
- 16.67%
- Cash-on-cash
- 37.07%
- DSCR
- 2.65
- GRM
- 4.2
CMA / ARV
- ARV (on-the-fly)
- $144,144
- Comps found
- 2
Show comp detail 2 sales within ~0.75 mi
| Address | Dist | Beds/Ba | Sqft | Sold | Price | $/sf | Match |
|---|---|---|---|---|---|---|---|
| 12350 Christensen Rd #75 | 0.69mi | 2/1.5 (-1) | 912 (-3%) | 9mo | $140,000 | $154 | 49 |
| 12350 Christensen Rd #104 | 0.69mi | 2/1.0 (-1) | 940 (+0%) | 19mo | $80,000 | $85 | 46 |
Match score weights: distance 35% · size 25% · config 20% · recency 20%. Top-matched comps best support the ARV.
Projected returns pro-forma
-3.0% appreciation · 4.87% rent growth · sell at horizon
- IRR
- 35.1%
- Equity multiple
- 2.52×
- Total profit
- $64,470
- Equity at exit
- $22,515
- IRR
- 42.9%
- Equity multiple
- 5.44×
- Total profit
- $187,749
- Equity at exit
- $13,056
Cash invested: $42,280 (down + closing). Projections, not guarantees.
Landlord ↔ Tenant lean methodology
- Overall (STATE)
- 18 Strongly Tenant-Friendly
- State California
- 18 Strongly Tenant-Friendly · D+13
- County
- — inherits STATE
- City
- — inherits STATE
ZIP-level market 93906
- Rents YoY
- 4.9%
- Active inventory
- 45
- Price-to-rent
- 4.2×
Monthly cashflow live
- Estimated rent
- $2,974 high interval (Pro) →
- Mortgage (P&I)
- −$792
- Tax est. 1.5%
- −$189 /mo · $2,265/yr
- Insurance
- −$63
- HOA
- −$0
- Vacancy / Maint / Mgmt
- −$625
- Net cashflow
- $1,306
Break-even live
UW: 25.0% down · 7.5% · 30yr · 1.5% tax · 5.0% vac · 8.0% maint · 8.0% mgmt
Financing live
Cash to close
- Down payment
- $37,750
- Closing costs
- $4,530
- Reserves months
- —
- Total cash needed
- —
Loan-product check · same deal, 3 products live
Conventional
25% down · 7.5% · 30yr
- Down + closing
- —
- Monthly P&I
- —
- Monthly cashflow
- —
- DSCR
- —
- Eligible?
- —
Personal DTI + credit; lowest rate.
DSCR
20% down · 8.5% · 30yr
- Down + closing
- —
- Monthly P&I
- —
- Monthly cashflow
- —
- DSCR
- —
- Eligible?
- —
No personal income docs; deal must DSCR.
Hard money
10% down · 12.0% · 12mo
- Down + closing
- —
- Monthly P&I
- —
- Monthly cashflow
- —
- DSCR
- —
- Eligible?
- —
Short-term bridge; refi at stabilization.
Rent comps 8 comps
| Address | Beds | Baths | Sqft | Rent | $/sqft | DOM | Units | Dist |
|---|---|---|---|---|---|---|---|---|
| 2402 N Main St Salinas, CA | 2.0 | 1.0 | 900 | $2,500 | $2.78 | 14d | 1 | 0.15mi |
| 2290 N Main St Salinas, CA | 1.0–3.0 | 1.0–2.0 | 985 | $3,611 | $3.67 | 2d | 13 | 0.26mi |
| 2198 Brutus St Salinas, CA | 1.0–2.0 | 1.0–1.5 | 893 | $2,645 | $2.96 | 8d | 2 | 0.43mi |
| 18854 Eisenhower St Unit 18854p Salinas, CA | 2.0 | 1.0 | 1000 | $2,700 | $2.70 | 14d | 1 | 0.58mi |
| 2073 Santa Rita St Salinas, CA | 2.0 | 1.0 | 492 | $2,593 | $5.26 | 3d | 13 | 0.61mi |
| 93 Castro St Salinas, CA | 2.0 | 1.0–2.0 | 828 | $2,400 | $2.90 | 12d | 3 | 0.63mi |
| 306 England Ave Salinas, CA | 3.0 | 2.0 | 1104 | $3,500 | $3.17 | 14d | 1 | 0.68mi |
| 1823 Cherokee Dr Salinas, CA | 3.0 | 1.5 | 952 | $3,295 | $3.46 | 14d | 1 | 1.35mi |
Listing history 17 events
-
2026-06-18days on market $151,000 Active 62 DOM
-
2026-06-17days on market $151,000 Active 61 DOM
-
2026-06-16days on market $151,000 Active 60 DOM
-
2026-06-15days on market $151,000 Active 59 DOM
-
2026-06-14days on market $151,000 Active 57 DOM
-
2026-06-13days on market $151,000 Active 56 DOM
-
2026-06-10days on market $151,000 Active 54 DOM
-
2026-06-09days on market $151,000 Active 53 DOM
-
2026-06-08days on market $151,000 Active 52 DOM
-
2026-06-07days on market $151,000 Active 51 DOM
-
2026-06-03days on market $151,000 Active 47 DOM
-
2026-06-02days on market $151,000 Active 46 DOM
-
2026-06-01days on market $151,000 Active 45 DOM
-
2026-05-31days on market $151,000 Active 44 DOM
-
2026-05-30days on market $151,000 Active 43 DOM
-
2026-04-17$151,000 Active 276-char remark
Show marketing remark (276 chars)
Welcome to Cal Hawaiian Mobile Home Park! Dont miss this opportunity at 20 Russell Rd #119 one of the lowest-priced homes in the area! This mobile home needs some work, but thats exactly where the value is Perfect for first-time buyers!!! Opportunities like this don't last!!!
ⓘ Source: listings_history table (triggers on properties + properties_extension) + one-shot
backfill from property_details.listing_events for pre-trigger history.
Climate risk First Street
- Flood 4/10 Moderate FEMA zone X (shaded) · 22% chance over 30 yrs
- Wildfire 4/10 Moderate
- Heat 3/10 Moderate 6 d/yr ≥81°F today · 13 d/yr by 30 yrs out
- Wind 1/10 Low
- Air quality 7/10 Severe 11 unhealthy d/yr today · 11 by 30 yrs out
Nearby sold comps map
Loading sold comps map…
Walkable amenities ~0.75 mi
Loading nearby amenities…
Taxation est. · year 1
- Rental income
- $35,692
- − Mortgage interest
- −$8,458
- − Property taxes
- −$2,265
- − Insurance
- −$755
- − Repairs & maintenance
- −$2,855
- − Management
- −$2,855
- − Depreciation
- −$4,393
- Taxable income
- $14,110
- Est. tax owed @ 24.0%
- −$3,386
- After-tax cash flow
- $12,288/yr
For passive investors: Depreciation is non-cash, so a rental often shows a tax loss while cash-flowing — sheltering income. Rental losses are passive: they offset passive income freely, and up to $25,000/yr can offset ordinary (W-2) income if you actively participate and your MAGI is under $100k (phasing out to $0 by $150k); unused losses carry forward. On sale, claimed depreciation is recaptured at up to 25%, and gains may owe capital-gains tax (a 1031 exchange can defer both). Figures are a year-1 estimate at your 24.0% rate — not tax advice; consult a CPA.
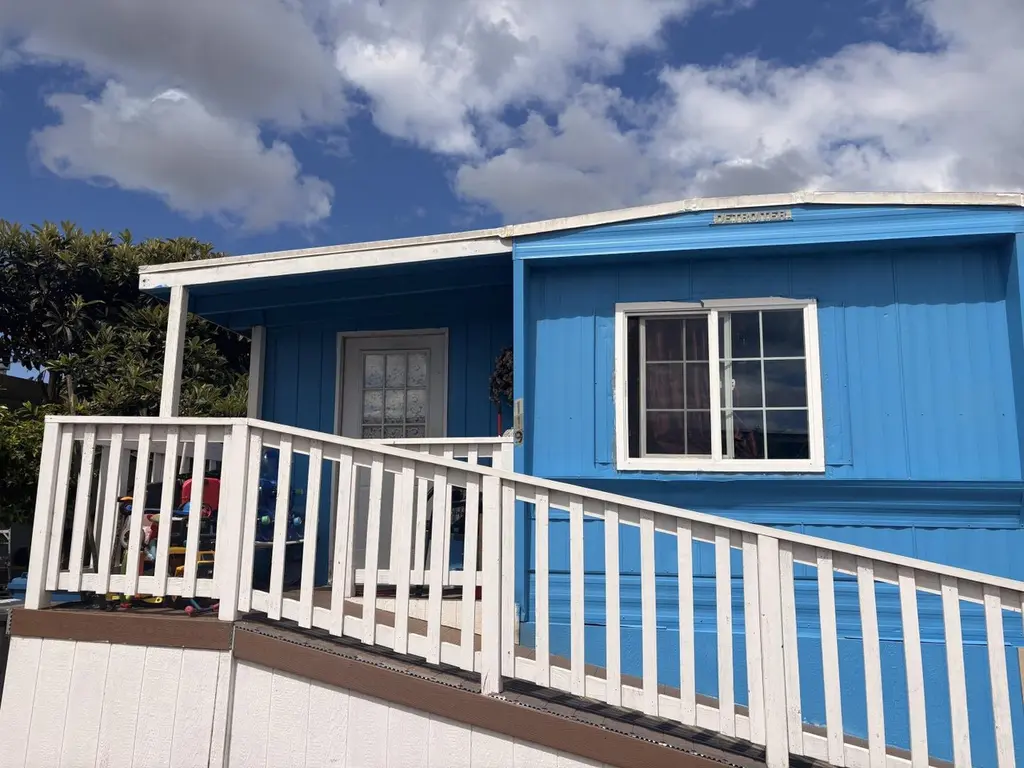
Condition & rehab AI · 1 photo
This manufactured home requires moderate repairs and maintenance to improve its condition and increase its resale and rental value.
Repairs flagged
- Major exterior siding — Severe weathering and peeling
- Major interior walls — Significant peeling paint
- Major landscaping — Overgrown vegetation
Value-add opportunities
- Both paint exterior — Enhances curb appeal and resale value
- Both paint interior walls — Improves interior appearance and resale value
- Both trim landscaping — Enhances curb appeal and rental value
Renovation cost estimate screening
| Repair item | Severity | Est. cost |
|---|---|---|
| exterior siding · Severe weathering and peeling | Major | $15,000–50,000 |
| interior walls · Significant peeling paint | Major | $15,000–50,000 |
| landscaping · Overgrown vegetation | Major | $15,000–50,000 |
| Total estimated repair cost · 3 items | $45,000–150,000 |
Value-add ROI direction
- Both paint exterior — Enhances curb appeal and resale value ↑
- Both paint interior walls — Improves interior appearance and resale value ↑
- Both trim landscaping — Enhances curb appeal and rental value ↑
ⓘ Cost ranges are severity-bucket heuristics (US national rule-of-thumb). Get contractor quotes + a written scope before underwriting a rehab budget.
Schools (NCES district)
- District
- Salinas Union High
- NCES district ID
- 0633980
- Math proficiency
- 23% ▲ 2.00%
- Reading proficiency
- 39% ▲ 1.00%
- Median HH income
- $50,670
- Composite
- 29.86/100
- National rank
- #11691
- State rank
- #998 of 1400 in CA
Livability — Salinas
- Score
- 63/100
- State rank
- #465
- US rank
- #15876
Category grades
Schools grade is shown separately in the Schools card above.
Census & demographics
- Census place
- Salinas, CA
- County
- Monterey County · 241,191 people
- City population
- 119,069
- Metro
- Salinas, CA
- Population (ZIP)
- 64,199
- Household income
- $97,555
- Rent vs Own
- Severe rent burden
- 1736.0
Population outlook (Monterey County) Hauer SSP2
- Today (2025)
- 458,436 people
- By 2030
- 469,418 · +2.4%
- By 2040
- 489,615 · +6.8%
- By 2050
- 506,696 · +10.5%
- By 2075
- 531,048 · +15.8%
- By 2100
- 519,153 · +13.2%
Race, ethnicity, and origin ACS 2023
- Neighborhood character
- Predominantly Hispanic (76%)
- Race & ethnicity
- Hispanic / Latino 76% Two or more races 13% White 13% Asian 7% Black 2%
- Hispanic origin (detail)
- Mexican 70% Salvadoran 1%
- Common ancestry
- Russian 1% Italian 1% Romanian 1%
- Foreign-born
- 33% · Canada, China
- Languages at home
- 33% English-only · Spanish 60% Tagalog/Filipino 2% Chinese 1%
Political lean MEDSL · Monterey
- 2024 margin
- Strong D (+29.9) · D 63.4% · R 33.5% · Other 3.0%
- 2008→2024 swing
- -8.4pp toward R · 2008: 38.3pp · 2024: 29.9pp
- All cycles
- 2024: D+29.9 2020: D+41.3 2016: D+39.7 2012: D+33.9 2008: D+38.3
Not yet ingested
- Civics
- —
Market trends
- HPI YoY
- ▼ -690.60%
- Current HPI
- 262.5003
- Rent YoY
- ▲ 4.87%
- Metro
- Salinas, CA
- State GDP YoY
- ▲ 3.21%
- F500 in state
- 116
Industry mix (Fortune 500 HQ in CA)
| Industry | F500 HQs | Revenue |
|---|---|---|
| Technology | 27 | $1,492B |
|
||
| Financial Services | 3 | $174B |
|
||
| Retail | 3 | $44B |
|
||
| Insurance | 3 | $26B |
|
||
| Media / Entertainment | 2 | $115B |
|
||
| Pharmaceuticals / Biotech | 2 | $62B |
|
||
Price history
+0.0% since first listed2 events — show timeline
- 2026-04-17 Listed $151,000 bridgeMLS, Bay East AOR, or Contra Costa AOR
- 2026-04-17 Listed $151,000 MLSListings
Cash-flow waterfall
monthlySold comps — $/sqft
last 12 mo · ≤1 miLoading sold comps…