3783 Sapphire Dr #3 · North Auburn, CA
Flood risk 6/10 · Moderate
- FEMA flood zone
- X (unshaded)
- Chance of flooding over 30 yrs
- 0.68%
- Est. flood insurance / yr
- $507 – $1,088
Fire risk 10/10 · Severe
- Est. fire insurance / yr
- $659 – $1,223
Heat risk 6/10 · Moderate
- Hot days now (above 99°F)
- 7 days/yr
- Hot days in 30 yrs
- 16 days/yr
Wind risk 1/10 · Minimal
- Chance of severe wind over 30 yrs
- —
Air-quality risk 10/10 · Severe
- Unhealthy air days now
- 34 days/yr
- Unhealthy air days in 30 yrs
- 41 days/yr
Risk factors via First Street. Map © Google.
Why this score? — see what drove the C- grade
The composite is a weighted blend of 9 inputs, each scored 0–100. Each bar is that input's sub-score; the figure is the points it added to the 100-point composite (weight × sub-score).
- Cash flow +17.2/30.0
- ARV discount +7.5/15.0
- 1% rule +7.2/10.0
- DSCR +5.3/10.0
- Schools +4.9/10.0
- Livability +3.1/5.0
- Rent growth +2.5/5.0
- Condition / age +2.5/5.0
- Appreciation +0.0/10.0
$149,000
🖨 Deal sheet 📄 Offer letter ✓ Due diligence
Listing remarks
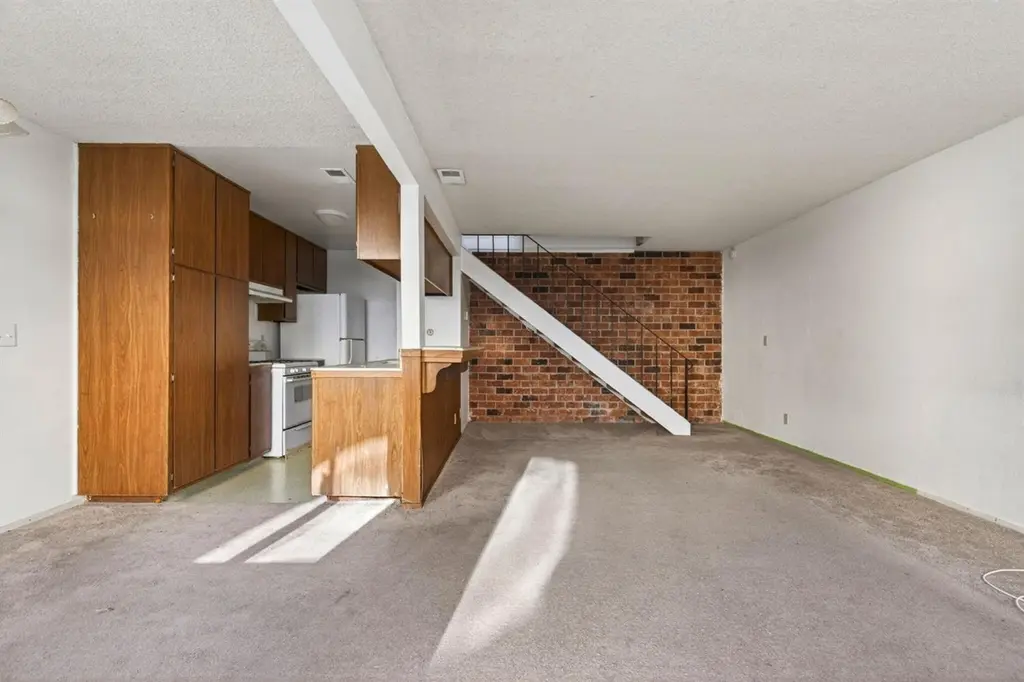
Bring your hammers and dreams! Opportunity knocks with this spacious 2-story fixer ready for your vision and creativity. Featuring an open living area with dramatic floor-to-ceiling brick accent wall, retro wet bar/pass-through kitchen, large bedrooms, and tons of potential throughout. This unit needs cosmetic updating but offers a solid layout and great upside for investors, flippers, or buyers looking to build sweat equity. Private patio entry, indoor laundry area, and community green space add to the appeal. Convenient location near shopping, dining, schools, and commuter access. Rare chance to transform this diamond in the rough into something special!
Key facts
- Retro wet bar
- Indoor laundry area
- Private patio entry
Tags
Property features AI
Finance
- HOA & community: Mandatory association with monthly fee (includes insurance, exterior maintenance, grounds maintenance, trash, and pool); Association amenities: Pool, free laundry
Exterior
- Parking: Attached garage (1 car), garage faces rear
- Utilities: Internet available; Natural gas connected; Public water; Public sewer; Electric: other
- Home design: Attached condominium; Single-story; Built in 1974
- Construction: Shingle roof; Fixer condition
- Exterior features: Private fenced pool; Lot with other/unspecified features
Interior
- Kitchen: Free-standing gas range; Pantry cabinets
- Bedrooms: 2 bedrooms
- Flooring: Carpet; Linoleum
- Bathrooms: 1 full bathroom with tub/shower over
- Heating & cooling: Central heating; Central air conditioning
- Interior features: Great room living area; Pantry cabinet; Kitchen open to family area; Breakfast nook
- Laundry & utility: Laundry details available in remarks / other (see seller remarks)
Neighborhood map
What this means for you Summary
Snapshot
- This is a 2-bed/1.0-bath condo listed at $149k.
Deal economics
- At list price, monthly cash flow is $105 ($1k/yr) — positive.
- The deal already cash-flows at list — no discount required.
- Meets the 1% rule at list price ($2k rent vs $149k).
- Recommended offer: $147k (1.5% below list) — sets the bar for market timing.
- Cap rate 7.1% vs local median 2.6% in North Auburn — top-decile yield for the area; either an underpriced asset or a hidden risk that comps aren't pricing in. Stress-test before assuming the spread holds.
Location & tenants
- Location reads 61/100 on livability (#519 in CA) — a middle-class / working-renter tenant base. Strengths: employment A-, housing A-; Watch: schools F, crime D-, amenities F.
- Placer Union High (suburban): math 39% / reading 72% proficiency, ranked #98 of 517 in CA (top 19%) — acceptable for families but not a draw, mixed tenant base, ~2y average lease.
- Market conditions: 186 active listings in the ZIP; 10 comparable units currently listed for rent nearby; rentals leasing fast (median 7d on market — plan ~1-2 weeks tenant-placement turnaround); solid renter incomes; 3,535 units permitted in Placer County in 2024 (689 in 5+ unit buildings).
Forward outlook
- Local home prices are declining (-3.0%/yr); year-one equity from $1k of loan paydown is wiped out by about $4k of value loss. Plan a longer hold.
- Placer County population projected at +20% by 2050 — long-run rental-demand tailwind backs the buy-and-hold thesis.
Negotiation context
- It's been on market 17 days — a 2% lower offer ($147k) is reasonable based on typical stale-listing flexibility.
Risks & watch-outs
- Climate carrying-cost: major flood risk; severe wildfire risk; extreme-heat days projected 7→16/yr by 2055 (HVAC capex compounding) — expect insurance premiums to compound above CPI over the hold.
Questions for the listing agent
- Built in 1974 — when were the roof, HVAC, electrical panel, plumbing, and water heater last replaced?
- What does the HOA fee cover, when was the last increase, and are there any pending special assessments or reserve-fund shortfalls?
- Any open or pending special assessments — roof, HVAC, plumbing, elevator, façade? What's the per-unit balance and payoff schedule, and is the seller paying it off at close or rolling it to the buyer?
- Is there a deadline driving the sale (1031 exchange, divorce, estate, relocation)? That informs how much negotiation room exists.
- Schools are F-rated, which usually means shorter tenancies and higher turnover. Who's the typical renter profile here, and what's been the actual vacancy rate?
- Crime grade is D in this area — have there been break-ins, vandalism, or insurance claims at this property in the last 3 years? What carrier currently insures it and at what premium?
- What's the average days-on-market for RENTAL listings here right now (not sales)? A rising rental-DOM trend means longer vacancies and softer asking-rent achievability than the comps imply.
- What's the recent tenant-quality profile in this submarket — average credit score on applications, eviction rate, late-payment / NSF rate, and stable-employment percentage? A property-management company in the area should have these aggregated.
- How much new apartment / multifamily construction is in the pipeline within 1–3 miles? Heavy new supply (>2% of stock underway) typically softens rents 12–24 months out; light construction supports rent growth.
Investment metrics
- 1% rule
- 1.22% ✓
- Cap rate
- 7.14%
- Cash-on-cash
- 3.03%
- DSCR
- 1.13
- GRM
- 6.8
CMA / ARV
No comps found within radius.
Projected returns pro-forma
-3.0% appreciation · 3.0% rent growth · sell at horizon
- IRR
- -11.4%
- Equity multiple
- 0.59×
- Total profit
- $-17,230
- Equity at exit
- $22,216
- IRR
- -1.9%
- Equity multiple
- 0.87×
- Total profit
- $-5,511
- Equity at exit
- $12,883
Cash invested: $41,720 (down + closing). Projections, not guarantees.
Landlord ↔ Tenant lean methodology
- Overall (STATE)
- 18 Strongly Tenant-Friendly
- State California
- 18 Strongly Tenant-Friendly · D+13
- County
- — inherits STATE
- City
- — inherits STATE
ZIP-level market 95602
- Active inventory
- 186
- Price-to-rent
- 6.8×
Monthly cashflow live
- Estimated rent
- $1,817 high interval (Pro) →
- Mortgage (P&I)
- −$781
- Tax from tax record
- −$134 /mo · $1,612/yr
- Insurance
- −$62
- HOA
- −$352
- Vacancy / Maint / Mgmt
- −$381
- Net cashflow
- $105
Break-even live
UW: 25.0% down · 7.5% · 30yr · 1.5% tax · 5.0% vac · 8.0% maint · 8.0% mgmt
Financing live
Cash to close
- Down payment
- $37,250
- Closing costs
- $4,470
- Reserves months
- —
- Total cash needed
- —
Loan-product check · same deal, 3 products live
Conventional
25% down · 7.5% · 30yr
- Down + closing
- —
- Monthly P&I
- —
- Monthly cashflow
- —
- DSCR
- —
- Eligible?
- —
Personal DTI + credit; lowest rate.
DSCR
20% down · 8.5% · 30yr
- Down + closing
- —
- Monthly P&I
- —
- Monthly cashflow
- —
- DSCR
- —
- Eligible?
- —
No personal income docs; deal must DSCR.
Hard money
10% down · 12.0% · 12mo
- Down + closing
- —
- Monthly P&I
- —
- Monthly cashflow
- —
- DSCR
- —
- Eligible?
- —
Short-term bridge; refi at stabilization.
Rent comps 10 comps
| Address | Beds | Baths | Sqft | Rent | $/sqft | DOM | Units | Dist |
|---|---|---|---|---|---|---|---|---|
| 3711 Galena Dr #3 Auburn, CA | 2.0 | 1.5 | 991 | $1,850 | $1.87 | 1d | 1 | 0.01mi |
| 3681 Galena Dr #2 Auburn, CA | 2.0 | 1.5 | 991 | $1,800 | $1.82 | 7d | 1 | 0.03mi |
| 3713 Park Dr #4 Auburn, CA | 1.0 | 1.0 | 900 | $1,675 | $1.86 | 11d | 1 | 0.13mi |
| 11325 Quartz Dr Auburn, CA | 1.0–2.0 | 1.0 | 775 | $2,069 | $2.67 | 1d | 10 | 0.14mi |
| 3633 Park Dr #2 Auburn, CA | 2.0 | 1.0 | 922 | $1,699 | $1.84 | 1d | 1 | 0.17mi |
| 3585 Sapphire Dr #4 Auburn, CA | 2.0 | 1.0 | 900 | $1,375 | $1.53 | 1d | 1 | 0.18mi |
| 11550 Garnet Way #2 Auburn, CA | 2.0 | 1.5 | 966 | $1,725 | $1.79 | 7d | 1 | 0.21mi |
| 11700 Garnet Way #4 Auburn, CA | 2.0 | 1.0 | 840 | $1,695 | $2.02 | 17d | 1 | 0.31mi |
| 11752 Jones St Unit 11752 Auburn, CA | 2.0 | 1.0 | 815 | $1,795 | $2.20 | 10d | 1 | 1.00mi |
| 11754 Jones St Unit 11754 Auburn, CA | 1.0 | 1.0 | 700 | $1,595 | $2.28 | 3d | 1 | 1.01mi |
HOA detail condo
- Monthly dues
- $352 · $4,224/yr
- Assessments
- None detected in remarks — confirm with the listing agent.
Listing history 10 events
-
2026-06-15statusdays on market $149,000 Pending 17 DOM
-
2026-06-13days on market $149,000 Active 16 DOM
-
2026-06-13days on market $149,000 Active 15 DOM
-
2026-06-09days on market $149,000 Active 12 DOM
-
2026-06-08days on market $149,000 Active 11 DOM
-
2026-06-07days on market $149,000 Active 10 DOM
-
2026-06-03days on market $149,000 Active 7 DOM
-
2026-06-02days on market $149,000 Active 6 DOM
-
2026-06-01days on market $149,000 Active 5 DOM
-
2026-05-31days on market $149,000 Active 4 DOM
ⓘ Source: listings_history table (triggers on properties + properties_extension) + one-shot
backfill from property_details.listing_events for pre-trigger history.
Tax reassessment forecast CA · Resets to sale price
- Current annual tax
- $1,612 · $134/mo
- Projected year-2 tax
- $1,612 · $134/mo
- Expected delta
- $0/yr ($0/mo · 0.0%)
ⓘ Screening estimate from a state-policy table — verify with the county assessor before closing.
Climate risk First Street
- Flood 6/10 Major FEMA zone X (unshaded) · 68% chance over 30 yrs
- Wildfire 10/10 Extreme
- Heat 6/10 Major 7 d/yr ≥99°F today · 16 d/yr by 30 yrs out
- Wind 1/10 Low
- Air quality 10/10 Extreme 34 unhealthy d/yr today · 41 by 30 yrs out
Nearby sold comps map
Loading sold comps map…
Walkable amenities ~0.75 mi
Loading nearby amenities…
Taxation est. · year 1
- Rental income
- $21,798
- − Mortgage interest
- −$8,346
- − Property taxes
- −$1,612
- − Insurance
- −$745
- − Repairs & maintenance
- −$1,744
- − Management
- −$1,744
- − HOA
- −$4,224
- − Depreciation
- −$4,335
- Taxable loss
- −$952
- Est. tax savings @ 24.0%
- +$228
- After-tax cash flow
- $1,491/yr
For passive investors: Depreciation is non-cash, so a rental often shows a tax loss while cash-flowing — sheltering income. Rental losses are passive: they offset passive income freely, and up to $25,000/yr can offset ordinary (W-2) income if you actively participate and your MAGI is under $100k (phasing out to $0 by $150k); unused losses carry forward. On sale, claimed depreciation is recaptured at up to 25%, and gains may owe capital-gains tax (a 1031 exchange can defer both). Figures are a year-1 estimate at your 24.0% rate — not tax advice; consult a CPA.
Schools (NCES district)
- District
- Placer Union High
- NCES district ID
- 0630750
- Math proficiency
- 39% ▲ 1.00%
- Reading proficiency
- 72% ▲ 3.00%
- Median HH income
- $69,119
- Composite
- 49.04/100
- National rank
- #2060
- State rank
- #98 of 517 in CA
Livability — North Auburn
- Score
- 61/100
- State rank
- #519
- US rank
- #17512
Category grades
Schools grade is shown separately in the Schools card above.
Census & demographics
- Census place
- North Auburn, CA
- County
- Placer County · 390,510 people
- City population
- 28,195
- Metro
- Sacramento-Roseville-Folsom, CA
- Population (ZIP)
- 19,701
- Household income
- $97,466
- Rent vs Own
- Severe rent burden
- 521.0
Population outlook (Placer County) Hauer SSP2
- Today (2025)
- 422,709 people
- By 2030
- 444,249 · +5.1%
- By 2040
- 480,192 · +13.6%
- By 2050
- 506,390 · +19.8%
- By 2075
- 550,219 · +30.2%
- By 2100
- 547,760 · +29.6%
Race, ethnicity, and origin ACS 2023
- Neighborhood character
- Predominantly White (78%)
- Race & ethnicity
- White 78% Hispanic / Latino 14% Two or more races 7% Asian 1%
- Hispanic origin (detail)
- Mexican 10%
- Common ancestry
- Italian 6% Portuguese 3% Lithuanian 3%
- Foreign-born
- 8% · Canada
- Languages at home
- 90% English-only · Spanish 7% Other Indo-European 1% German/W. Germanic 0%
Political lean MEDSL · Placer
- 2024 margin
- Lean R (+8.5) · D 44.3% · R 52.8% · Other 2.9%
- 2008→2024 swing
- +2.8pp toward D · 2008: -11.3pp · 2024: -8.5pp
- All cycles
- 2024: R+8.5 2020: R+6.7 2016: R+11.3 2012: R+20.1 2008: R+11.3
Not yet ingested
- Civics
- —
Market trends
- HPI YoY
- ▼ -426.11%
- Current HPI
- 257.0087
- Rent YoY
- —
- Metro
- Sacramento-Roseville-Folsom, CA
- State GDP YoY
- ▲ 3.21%
- F500 in state
- 116
Industry mix (Fortune 500 HQ in CA)
| Industry | F500 HQs | Revenue |
|---|---|---|
| Technology | 27 | $1,492B |
|
||
| Financial Services | 3 | $174B |
|
||
| Retail | 3 | $44B |
|
||
| Insurance | 3 | $26B |
|
||
| Media / Entertainment | 2 | $115B |
|
||
| Pharmaceuticals / Biotech | 2 | $62B |
|
||
Property tax history
+2.5%/yrLatest (2025): $1,612 · +2.9% YoY. Source: county tax records.
Cash-flow waterfall
monthlySold comps — $/sqft
last 12 mo · ≤1 miLoading sold comps…