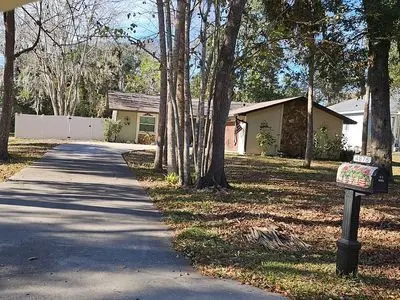
4876 S Driftwood Way · Homosassa, FL
Flood risk 10/10 · Severe
- FEMA flood zone
- AE
- Chance of flooding over 30 yrs
- 0.99%
- Est. flood insurance / yr
- $1,737 – $8,500
Fire risk 4/10 · Minor
- Est. fire insurance / yr
- $947 – $1,759
Heat risk 10/10 · Severe
- Hot days now (above 110°F)
- 7 days/yr
- Hot days in 30 yrs
- 26 days/yr
Wind risk 9/10 · Severe
- Chance of severe wind over 30 yrs
- 99.0%
Air-quality risk 1/10 · Minimal
- Unhealthy air days now
- 0 days/yr
- Unhealthy air days in 30 yrs
- 0 days/yr
Risk factors via First Street. Map © Google.
Why this score? — see what drove the C grade
The composite is a weighted blend of 9 inputs, each scored 0–100. Each bar is that input's sub-score; the figure is the points it added to the 100-point composite (weight × sub-score).
- Cash flow +20.4/30.0
- ARV discount +15.0/15.0
- DSCR +6.5/10.0
- 1% rule +4.9/10.0
- Schools +4.1/10.0
- Livability +3.1/5.0
- Rent growth +2.5/5.0
- Condition / age +2.5/5.0
- Appreciation +0.0/10.0
$283,000
🖨 Deal sheet 📄 Offer letter ✓ Due diligence
Listing remarks
Looking for a comfortable place to call home? Look no further than Riverhaven Village in Homosassa, FL. Walking distance to the Homosassa River & amp; marina & amp; boat ramp & amp; waterfront restaurant. Community offers a spacious park and separate RV/boat storage lot. You may enjoy the optional clubhouse membership that offers playground, dog park, large heated pool, numerous social activities, lighted tennis courts, pickleball court, and more. Home has 3 bedrooms, 2 baths, 2 car garage. The neighbors are friendly and the livin& apos; is easy. Call for an appointment today.
Key facts
- Rv boat storage lot
- Spacious park
- Marina
Tags
Neighborhood map
What this means for you Summary
Snapshot
- This is a 3-bed/2.0-bath single-family listed at $283k.
Deal economics
- At list price, monthly cash flow is $-60 ($-718/yr) — negative.
- To cash-flow at today's rent, offer at most $272k (3.7% below list).
- To meet the 1% rule (rent ≥ 1% of price), the offer needs to be $280k (0.9% below list).
- Recommended offer: $272k (3.7% below list) — sets the bar for cash-flow.
- Cap rate 7.8% vs local median 1.8% in Homosassa — top-decile yield for the area; either an underpriced asset or a hidden risk that comps aren't pricing in. Stress-test before assuming the spread holds.
Location & tenants
- Location reads 62/100 on livability (#749 in FL) — a middle-class / working-renter tenant base. Strengths: crime A+; Watch: health & safety C-, employment D+, amenities F.
- Citrus (rural): math 49% / reading 50% proficiency, ranked #44 of 73 in FL (top 60%) — families likely to look elsewhere, expect single-tenant / working-renter base with shorter leases.
- Market conditions: 307 active listings in the ZIP; 7 comparable units currently listed for rent nearby; rentals at typical pace (median 21d on market — plan ~3-4 weeks tenant-placement turnaround); 2,443 units permitted in Citrus County in 2024 (0 in 5+ unit buildings).
- At $2,805/mo this rent would consume 73% of the median local household income ($46k/yr) (locally 113% of renters already pay >50% of income on rent) — very limited rent-growth headroom before tenants either downsize or default.
Forward outlook
- Local home prices are declining (-3.0%/yr); year-one equity from $2k of loan paydown is wiped out by about $8k of value loss. Plan a longer hold.
- Citrus County population projected to shrink 10% by 2050 — rents likely to lag national; underwrite the cash flow, not the appreciation.
Negotiation context
- It's been on market 38 days — a 3% lower offer ($275k) is reasonable based on typical stale-listing flexibility.
- Current owner paid $178k; list at $283k implies a 59% gain — meaningful room to come down on a strong offer.
Risks & watch-outs
- Watch-outs: flood insurance adds $427/mo.
- Climate carrying-cost: in FEMA flood zone AE (mandatory federal flood insurance); severe wind risk, 99% chance of damaging wind over 30y; extreme-heat days projected 7→26/yr by 2055 (HVAC capex compounding) — expect insurance premiums to compound above CPI over the hold.
Questions for the listing agent
- What do current leases actually rent for vs. the listed asking? Can we see a recent rent roll and the last 12 months of T-12 income?
- It's been on market 38 days. Have you received any prior offers? Is the seller open to a 4% concession, seller financing, or rate buy-down credit?
- What's the actual annual flood-insurance premium (NFIP or private), and is the property in a SFHA with mandatory coverage?
- Is there a deadline driving the sale (1031 exchange, divorce, estate, relocation)? That informs how much negotiation room exists.
- What's the average days-on-market for RENTAL listings here right now (not sales)? A rising rental-DOM trend means longer vacancies and softer asking-rent achievability than the comps imply.
- What's the recent tenant-quality profile in this submarket — average credit score on applications, eviction rate, late-payment / NSF rate, and stable-employment percentage? A property-management company in the area should have these aggregated.
- How much new for-sale + rental construction is in the pipeline within 1–3 miles? Heavy new supply typically softens prices + rents 12–24 months out; constrained supply supports both.
Investment metrics
- 1% rule
- 0.99% ✗
- Cap rate
- 7.85%
- Cash-on-cash
- 5.55%
- DSCR
- 1.25
- GRM
- 8.4
CMA / ARV
- ARV (on-the-fly)
- $370,656
- Comps found
- 12
Show comp detail 12 sales within ~0.75 mi
| Address | Dist | Beds/Ba | Sqft | Sold | Price | $/sf | Match |
|---|---|---|---|---|---|---|---|
| 11583 W Riverhaven Dr | 0.14mi | 3/2.5 | 1,552 (-2%) | 1mo | $400,000 | $258 | 88 |
| 4951 S Driftwood Way | 0.09mi | 3/2.0 | 1,498 (-5%) | 10mo | $250,000 | $167 | 78 |
| 11830 W Fisherman Ln | 0.39mi | 3/2.0 | 1,610 (+2%) | 2mo | $299,000 | $186 | 77 |
| 11600 W Waterway Dr | 0.11mi | 2/2.0 (-1) | 1,498 (-5%) | 6mo | $350,000 | $234 | 75 |
| 11511 W Riverhaven Dr | 0.17mi | 2/2.0 (-1) | 1,493 (-6%) | 10mo | $220,000 | $147 | 69 |
| 11517 W Riverhaven Dr | 0.17mi | 3/2.0 | 1,374 (-13%) | 1mo | $375,000 | $273 | 69 |
| 11464 W Clubview Dr | 0.34mi | 2/2.0 (-1) | 1,493 (-6%) | 3mo | $420,000 | $281 | 67 |
| 11702 W Fisherman Ln | 0.25mi | 3/2.0 | 1,427 (-10%) | 8mo | $287,500 | $201 | 65 |
| 11673 W Riverhaven Dr | 0.18mi | 2/2.0 (-1) | 1,811 (+14%) | 6mo | $405,000 | $224 | 58 |
| 5500 S Cedar Mill Path | 0.69mi | 3/3.0 | 1,672 (+6%) | 5mo | $950,000 | $568 | 51 |
| 5264 S Spy Glass Pt | 0.56mi | 3/2.0 | 1,758 (+11%) | 6mo | $595,000 | $338 | 50 |
| 11784 W Timberlane Dr | 0.38mi | 2/3.0 (-1) | 1,392 (-12%) | 8mo | $270,000 | $194 | 46 |
Match score weights: distance 35% · size 25% · config 20% · recency 20%. Top-matched comps best support the ARV.
Projected returns pro-forma
-3.0% appreciation · 3.0% rent growth · sell at horizon
- IRR
- -17.7%
- Equity multiple
- 0.38×
- Total profit
- $-49,432
- Equity at exit
- $42,196
- IRR
- -9.6%
- Equity multiple
- 0.41×
- Total profit
- $-46,983
- Equity at exit
- $24,469
Cash invested: $79,240 (down + closing). Projections, not guarantees.
Landlord ↔ Tenant lean methodology
- Overall (STATE)
- 87 Strongly Landlord-Friendly
- State Florida
- 87 Strongly Landlord-Friendly · R+3
- County
- — inherits STATE
- City
- — inherits STATE
ZIP-level market 34448
- Home prices YoY
- -26.1%
- Active inventory
- 307
- Price-to-rent
- 8.4×
Monthly cashflow live
- Estimated rent
- $2,805 high interval (Pro) →
- Mortgage (P&I)
- −$1,484
- Tax from tax record
- −$247 /mo · $2,963/yr
- Insurance
- −$118
- Flood insurance flood zone
- −$427 /mo · $5,118/yr
- HOA
- −$0
- Vacancy / Maint / Mgmt
- −$589
- Net cashflow
- $-60
Break-even live
UW: 25.0% down · 7.5% · 30yr · 1.5% tax · 5.0% vac · 8.0% maint · 8.0% mgmt
Financing live
Cash to close
- Down payment
- $70,750
- Closing costs
- $8,490
- Reserves months
- —
- Total cash needed
- —
Loan-product check · same deal, 3 products live
Conventional
25% down · 7.5% · 30yr
- Down + closing
- —
- Monthly P&I
- —
- Monthly cashflow
- —
- DSCR
- —
- Eligible?
- —
Personal DTI + credit; lowest rate.
DSCR
20% down · 8.5% · 30yr
- Down + closing
- —
- Monthly P&I
- —
- Monthly cashflow
- —
- DSCR
- —
- Eligible?
- —
No personal income docs; deal must DSCR.
Hard money
10% down · 12.0% · 12mo
- Down + closing
- —
- Monthly P&I
- —
- Monthly cashflow
- —
- DSCR
- —
- Eligible?
- —
Short-term bridge; refi at stabilization.
Rent comps 7 comps
| Address | Beds | Baths | Sqft | Rent | $/sqft | DOM | Units | Dist |
|---|---|---|---|---|---|---|---|---|
| 11639 W Riverhaven Dr Homosassa, FL | 3.0 | 2.0 | 1925 | $2,900 | $1.51 | 21d | 1 | 0.14mi |
| 11643 W Riverhaven Dr Homosassa, FL | 3.0 | 2.5 | 1821 | $2,900 | $1.59 | 21d | 1 | 0.14mi |
| 11481 W Riverhaven Dr Homosassa, FL | 2.0 | 2.0 | 1149 | $3,000 | $2.61 | 21d | 1 | 0.18mi |
| 11459 W Riverhaven Dr Homosassa, FL | 2.0 | 2.0 | 1699 | $3,000 | $1.77 | 21d | 1 | 0.19mi |
| 11445 W Riverhaven Dr Homosassa, FL | 2.0 | 2.0 | 1493 | $2,900 | $1.94 | 21d | 1 | 0.20mi |
| 5230 S View Pt Homosassa, FL | 2.0 | 2.0 | 1149 | $2,800 | $2.44 | 21d | 1 | 0.36mi |
| 5111 S Gray Pelican Way Unit 5111 Homosassa, FL | 2.0 | 2.0 | 1543 | $3,200 | $2.07 | 21d | 1 | 0.40mi |
Listing history 18 events
-
2026-06-19days on market $283,000 Active 38 DOM
-
2026-06-18days on market $283,000 Active 37 DOM
-
2026-06-17days on market $283,000 Active 36 DOM
-
2026-06-16days on market $283,000 Active 35 DOM
-
2026-06-15days on market $283,000 Active 34 DOM
-
2026-06-14days on market $283,000 Active 32 DOM
-
2026-06-13days on market $283,000 Active 31 DOM
-
2026-06-09days on market $283,000 Active 28 DOM
-
2026-06-08days on market $283,000 Active 27 DOM
-
2026-06-03days on market $283,000 Active 22 DOM
-
2026-06-02days on market $283,000 Active 21 DOM
-
2026-06-01days on market $283,000 Active 20 DOM
-
2026-05-31days on market $283,000 Active 19 DOM
-
2026-05-30days on market $283,000 Active 18 DOM
-
2026-05-13$283,000 Active
-
2020-10-22soldstatus $177,900
-
1983-05-01soldstatus $70,000
-
1981-11-01soldstatus $14,200
ⓘ Source: listings_history table (triggers on properties + properties_extension) + one-shot
backfill from property_details.listing_events for pre-trigger history.
Tax reassessment forecast FL · Resets to sale price
- Current annual tax
- $2,963 · $247/mo
- Projected year-2 tax
- $2,963 · $247/mo
- Expected delta
- $0/yr ($0/mo · 0.0%)
ⓘ Screening estimate from a state-policy table — verify with the county assessor before closing.
Climate risk First Street
- Flood 10/10 Extreme FEMA zone AE · 99% chance over 30 yrs
- Wildfire 4/10 Moderate
- Heat 10/10 Extreme 7 d/yr ≥110°F today · 26 d/yr by 30 yrs out
- Wind 9/10 Extreme 99% chance of damaging wind over 30 yrs
- Air quality 1/10 Low 0 unhealthy d/yr today · 0 by 30 yrs out
Nearby sold comps map
Loading sold comps map…
Walkable amenities ~0.75 mi
Loading nearby amenities…
Taxation est. · year 1
- Rental income
- $33,655
- − Mortgage interest
- −$15,852
- − Property taxes
- −$2,963
- − Insurance
- −$6,534
- − Repairs & maintenance
- −$2,692
- − Management
- −$2,692
- − Depreciation
- −$8,233
- Taxable loss
- −$5,312
- Est. tax savings @ 24.0%
- +$1,275
- After-tax cash flow
- $556/yr
For passive investors: Depreciation is non-cash, so a rental often shows a tax loss while cash-flowing — sheltering income. Rental losses are passive: they offset passive income freely, and up to $25,000/yr can offset ordinary (W-2) income if you actively participate and your MAGI is under $100k (phasing out to $0 by $150k); unused losses carry forward. On sale, claimed depreciation is recaptured at up to 25%, and gains may owe capital-gains tax (a 1031 exchange can defer both). Figures are a year-1 estimate at your 24.0% rate — not tax advice; consult a CPA.
Schools (NCES district)
- District
- Citrus
- NCES district ID
- 1200270
- Math proficiency
- 49% ▼ -10.00%
- Reading proficiency
- 50% ▼ -6.00%
- Median HH income
- $38,618
- Composite
- 41.28/100
- National rank
- #3519
- State rank
- #44 of 73 in FL
Livability — Homosassa
- Score
- 62/100
- State rank
- #749
- US rank
- #16240
Category grades
Schools grade is shown separately in the Schools card above.
Census & demographics
- Census place
- Homosassa, FL
- County
- Citrus County · 111,314 people
- City population
- 29,919
- Metro
- Homosassa Springs, FL
- Population (ZIP)
- 10,817
- Household income
- $45,916
- Rent vs Own
- Severe rent burden
- 113.0
Population outlook (Citrus County) Hauer SSP2
- Today (2025)
- 138,622 people
- By 2030
- 136,886 · -1.3%
- By 2040
- 132,009 · -4.8%
- By 2050
- 125,196 · -9.7%
- By 2075
- 108,570 · -21.7%
- By 2100
- 84,454 · -39.1%
Race, ethnicity, and origin ACS 2023
- Neighborhood character
- Predominantly White (94%)
- Race & ethnicity
- White 94% Two or more races 3% Hispanic / Latino 3% Black 1%
- Common ancestry
- Slovak 3% Scotch-Irish 2% Lithuanian 2%
- Foreign-born
- 2% · Canada
- Languages at home
- 96% English-only · Spanish 2% Russian/Polish/Slavic 1%
Political lean MEDSL · Citrus
- 2024 margin
- Solid R (+45.9) · D 26.8% · R 72.6%
- 2008→2024 swing
- -29.8pp toward R · 2008: -16.1pp · 2024: -45.9pp
- All cycles
- 2024: R+45.9 2020: R+41.0 2016: R+39.7 2012: R+21.9 2008: R+16.1
Not yet ingested
- Civics
- —
Market trends
- HPI YoY
- ▼ -110.27%
- Current HPI
- 312.4302
- Rent YoY
- —
- Metro
- Homosassa Springs, FL
- State GDP YoY
- ▲ 3.28%
- F500 in state
- 36
Industry mix (Fortune 500 HQ in FL)
| Industry | F500 HQs | Revenue |
|---|---|---|
| Industrial Technology | 2 | $29B |
|
||
| Insurance | 2 | $17B |
|
||
| Retail | 1 | $60B |
|
||
| Technology Distribution | 1 | $58B |
|
||
| Homebuilding | 1 | $35B |
|
||
| Technology Manufacturing | 1 | $35B |
|
||
Price history
+1893.0% since first listed4 events — show timeline
- 2026-05-13 Listed $283,000 FSBO.com
- 2020-10-22 Sold (Public Records) $177,900 Public Records
- 1983-05-01 Sold (Public Records) $70,000 Public Records
- 1981-11-01 Sold (Public Records) $14,200 Public Records
Property tax history
+8.1%/yrLatest (2025): $2,963 · -27.2% YoY. Source: county tax records.
Cash-flow waterfall
monthlySold comps — $/sqft
last 12 mo · ≤1 miLoading sold comps…