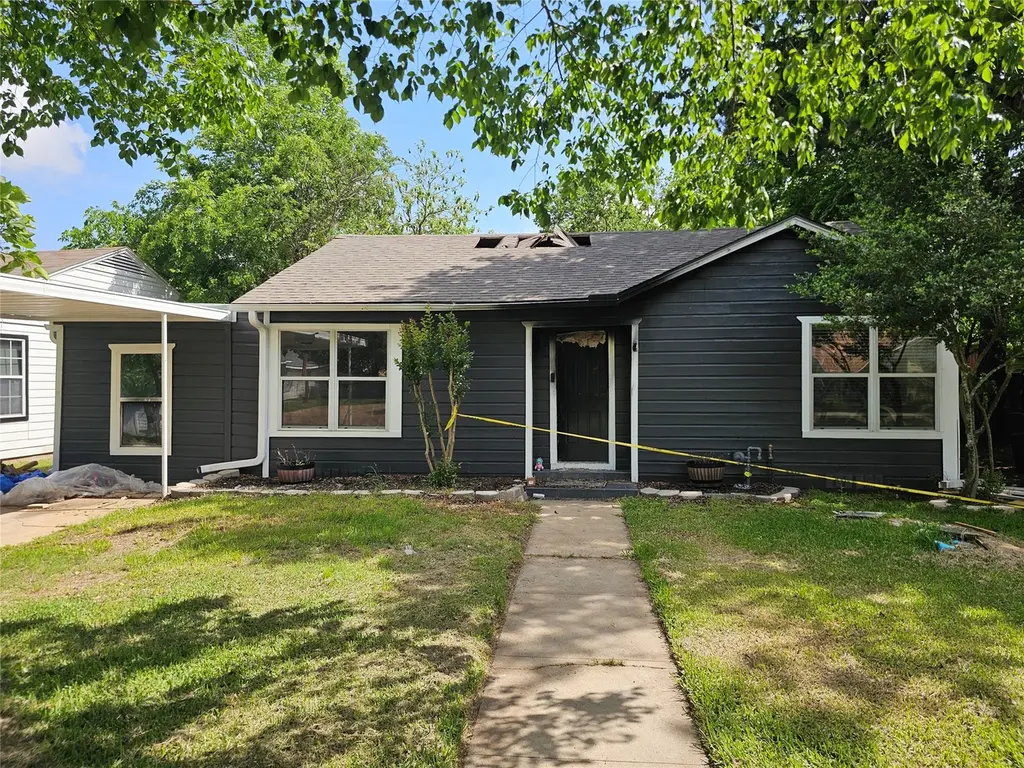
1506 E 28th St · Bryan, TX
Flood risk 1/10 · Minimal
- FEMA flood zone
- X (unshaded)
- Chance of flooding over 30 yrs
- 0.0%
- Est. flood insurance / yr
- $507 – $1,088
Fire risk 1/10 · Minimal
- Est. fire insurance / yr
- $1,222 – $2,270
Heat risk 8/10 · Major
- Hot days now (above 110°F)
- 7 days/yr
- Hot days in 30 yrs
- 24 days/yr
Wind risk 8/10 · Major
- Chance of severe wind over 30 yrs
- 80.0%
Air-quality risk 1/10 · Minimal
- Unhealthy air days now
- 0 days/yr
- Unhealthy air days in 30 yrs
- 0 days/yr
Risk factors via First Street. Map © Google.
Why this score? — see what drove the B- grade
The composite is a weighted blend of 9 inputs, each scored 0–100. Each bar is that input's sub-score; the figure is the points it added to the 100-point composite (weight × sub-score).
- Cash flow +30.0/30.0
- 1% rule +10.0/10.0
- DSCR +10.0/10.0
- ARV discount +7.5/15.0
- Livability +3.8/5.0
- Rent growth +3.0/5.0
- Schools +2.6/10.0
- Condition / age +2.5/5.0
- Appreciation +0.0/10.0
$84,410
🖨 Deal sheet 📄 Offer letter ✓ Due diligence
Listing remarks
INVESTOR OPPORTUNITY!! Calling all Investors. Located couple of blocks from Blinn College and just 3 miles from Texas A & M University, 2025 county appraised value is at 265,686. This is a fire damaged property, the structure and the roof trusses are in good condition. Offers a unique opportunity for those with a vision and a passion for transformation. Sold as-is, this property is a blank canvas waiting for your personal touch and creative flair. Whether you're an experienced renovator or a first-time homebuyer with a dream, this is your chance to make this house a home. Embrace the challenge, and watch your investment grow! Do not call listing office, please call listing agent for ap
Key facts
- 7,466 sq ft lot
- Built 1952
- Listed 31 days
Tags
Property features AI
Exterior
- Utilities: Public water; Public sewer
- Home design: Residential property; Built in 1952; Single-level entry (first floor living areas indicated)
- Construction: Vinyl siding and wood siding; Composition roof; Pillar/post/pier foundation
- Exterior features: Lot approximately 0.1714 acres (about 7,466 sq ft); Lot features: Other
Interior
- Bedrooms: Primary bedroom on the first floor (approx. 15x15); Bedroom on the first floor (approx. 12x12); Bedroom on the first floor (approx. 10x10); Bedroom on the first floor (approx. 10x10)
- Bathrooms: 2 full bathrooms
- Heating & cooling: Central heating (electric); Central air conditioning (electric)
- Interior features: 4 total rooms
Neighborhood map
What this means for you Summary
Snapshot
- This is a 3-bed/2.0-bath single-family listed at $84k.
Deal economics
- At list price, monthly cash flow is $801 ($10k/yr) — positive.
- The deal already cash-flows at list — no discount required.
- Meets the 1% rule at list price ($2k rent vs $84k).
- Recommended offer: $82k (3.0% below list) — sets the bar for market timing.
- Cap rate 17.7% vs local median 4.0% in Bryan — top-decile yield for the area; either an underpriced asset or a hidden risk that comps aren't pricing in. Stress-test before assuming the spread holds.
Location & tenants
- Location reads 76/100 on livability (#99 in TX, #3,341 nationally) — a middle-class / working-renter tenant base. Strengths: cost of living A+, housing A+, health & safety A+; Watch: crime C-, amenities C-, employment D+.
- Bryan ISD (urban): math 30% / reading 32% proficiency, ranked #608 of 826 in TX (top 74%) — families likely to look elsewhere, expect single-tenant / working-renter base with shorter leases; 68% free/reduced lunch — lower-income household profile, screen leases tightly.
- Zoned schools: Stephen F Austin (math 25% / reading 36%, grade F, #1,036 of 1,662 statewide, top 63%, 1,206 students, 76% FRL).
- Market conditions: Rents rising (+1.8%/yr); 278 active listings in the ZIP; 25 comparable units currently listed for rent nearby; rentals at typical pace (median 21d on market — plan ~3-4 weeks tenant-placement turnaround); 2,211 units permitted in Brazos County in 2024 (768 in 5+ unit buildings).
Forward outlook
- Local home prices are declining (-3.0%/yr); year-one equity from $584 of loan paydown is wiped out by about $3k of value loss. Plan a longer hold.
- Brazos County population projected at +55% by 2050 — long-run rental-demand tailwind backs the buy-and-hold thesis.
- At projected returns (-3.0% appreciation + 1.8% rent growth), your $24k cash investment doubles in ~3 years — after that, you're playing with house money.
Negotiation context
- It's been on market 32 days — a 3% lower offer ($82k) is reasonable based on typical stale-listing flexibility.
- 6 sale attempts since 13y ago with the ask held roughly flat each time — persistent listings suggest the price (not the market) is what's stuck; bring a comps-based counter.
Risks & watch-outs
- Watch-outs: built in 1952 — expect roof / HVAC / electrical / plumbing capex.
- Climate carrying-cost: severe wind risk, 80% chance of damaging wind over 30y; extreme-heat days projected 7→24/yr by 2055 (HVAC capex compounding) — expect insurance premiums to compound above CPI over the hold.
Questions for the listing agent
- It's been on market 32 days. Have you received any prior offers? Is the seller open to a 3% concession, seller financing, or rate buy-down credit?
- Built in 1952 — when were the roof, HVAC, electrical panel, plumbing, and water heater last replaced?
- Is there a deadline driving the sale (1031 exchange, divorce, estate, relocation)? That informs how much negotiation room exists.
- What's the average days-on-market for RENTAL listings here right now (not sales)? A rising rental-DOM trend means longer vacancies and softer asking-rent achievability than the comps imply.
- What's the recent tenant-quality profile in this submarket — average credit score on applications, eviction rate, late-payment / NSF rate, and stable-employment percentage? A property-management company in the area should have these aggregated.
- How much new for-sale + rental construction is in the pipeline within 1–3 miles? Heavy new supply typically softens prices + rents 12–24 months out; constrained supply supports both.
Investment metrics
- 1% rule
- 2.08% ✓
- Cap rate
- 17.68%
- Cash-on-cash
- 40.67%
- DSCR
- 2.81
- GRM
- 4.0
CMA / ARV
- ARV (median comp)
- $255,489
- List price
- $84,410
- Delta
- -66.96%
- Verdict
- UNDERPRICED
- Comps
- 20 within 1.0 mi
Show comp detail 5 sales within ~0.75 mi
| Address | Dist | Beds/Ba | Sqft | Sold | Price | $/sf | Match |
|---|---|---|---|---|---|---|---|
| 1506 E 28th St | 0.00mi | 4/2.0 (+1) | 1,850 (+6%) | 0mo | $84,410 | $46 | 85 |
| 1317 Garden Ln | 0.46mi | 3/2.0 | 1,716 (-2%) | 2mo | $299,900 | $175 | 74 |
| 709 S Coulter Dr | 0.43mi | 3/2.0 | 1,600 (-8%) | 8mo | $250,000 | $156 | 60 |
| 406 Leslie Dr | 0.55mi | 3/2.0 | 1,574 (-10%) | 15mo | $229,900 | $146 | 45 |
| 1908 Carter Creek Pkwy | 0.61mi | 4/3.0 (+1) | 1,978 (+13%) | 13mo | $425,000 | $215 | 30 |
Match score weights: distance 35% · size 25% · config 20% · recency 20%. Top-matched comps best support the ARV.
Projected returns pro-forma
-3.0% appreciation · 1.82% rent growth · sell at horizon
- IRR
- 35.8%
- Equity multiple
- 2.49×
- Total profit
- $35,309
- Equity at exit
- $12,586
- IRR
- 41.9%
- Equity multiple
- 4.74×
- Total profit
- $88,307
- Equity at exit
- $7,298
Cash invested: $23,635 (down + closing). Projections, not guarantees.
Landlord ↔ Tenant lean methodology
- Overall (STATE)
- 87 Strongly Landlord-Friendly
- State Texas
- 87 Strongly Landlord-Friendly · R+5
- County
- — inherits STATE
- City
- — inherits STATE
ZIP-level market 77802
- Rents YoY
- 1.8%
- Active inventory
- 278
- Price-to-rent
- 4.0×
Monthly cashflow live
- Estimated rent
- $1,752 high interval (Pro) →
- Mortgage (P&I)
- −$443
- Tax est. 1.5%
- −$106 /mo · $1,266/yr
- Insurance
- −$35
- HOA
- −$0
- Vacancy / Maint / Mgmt
- −$368
- Net cashflow
- $801
Break-even live
UW: 25.0% down · 7.5% · 30yr · 1.5% tax · 5.0% vac · 8.0% maint · 8.0% mgmt
Financing live
Cash to close
- Down payment
- $21,102
- Closing costs
- $2,532
- Reserves months
- —
- Total cash needed
- —
Loan-product check · same deal, 3 products live
Conventional
25% down · 7.5% · 30yr
- Down + closing
- —
- Monthly P&I
- —
- Monthly cashflow
- —
- DSCR
- —
- Eligible?
- —
Personal DTI + credit; lowest rate.
DSCR
20% down · 8.5% · 30yr
- Down + closing
- —
- Monthly P&I
- —
- Monthly cashflow
- —
- DSCR
- —
- Eligible?
- —
No personal income docs; deal must DSCR.
Hard money
10% down · 12.0% · 12mo
- Down + closing
- —
- Monthly P&I
- —
- Monthly cashflow
- —
- DSCR
- —
- Eligible?
- —
Short-term bridge; refi at stabilization.
Rent comps 25 comps
| Address | Beds | Baths | Sqft | Rent | $/sqft | DOM | Units | Dist |
|---|---|---|---|---|---|---|---|---|
| 1503 Hollow Hill Dr Unit A Bryan, TX | 3.0 | 3.0 | 1364 | $1,550 | $1.14 | 13d | 1 | 0.20mi |
| 1503 Hollow Hill Dr Unit A Bryan, TX | 3.0 | 3.0 | 1364 | $1,550 | $1.14 | 43d | 1 | 0.20mi |
| 1512 Hollowhill Dr Bryan, TX | 1.0–4.0 | 1.0–2.0 | 905 | $1,322 | $1.46 | 13d | 10 | 0.26mi |
| 1815 Gettysburg Ln Unit 1328085P Bryan, TX | 3.0 | 2.0 | 1603 | $3,721 | $2.32 | 20d | 1 | 0.28mi |
| 1318 Antone St Bryan, TX | 2.0 | 1.0 | 1132 | $900 | $0.80 | 43d | 1 | 0.42mi |
| 1316 Antone St Unit B Bryan, TX | 2.0 | 1.0 | 1132 | $850 | $0.75 | 43d | 1 | 0.42mi |
| 807 S Coulter Dr Bryan, TX | 4.0 | 3.0 | 2154 | $2,250 | $1.04 | 43d | 1 | 0.49mi |
| 611 S Ennis St Apt 37 Bryan, TX | 2.0 | 1.5 | 1052 | $995 | $0.95 | 43d | 1 | 0.51mi |
| 814 E 28th St Bryan, TX | 2.0 | 2.0 | 1777 | $1,550 | $0.87 | 43d | 1 | 0.60mi |
| 2812 Village Dr Bryan, TX | 2.0 | 2.0 | 1244 | $1,400 | $1.13 | 43d | 1 | 0.89mi |
| 3130 E Villa Maria Rd Bryan, TX | 1.0–3.0 | 1.0 | 810 | $1,169 | $1.44 | 13d | 10 | 0.92mi |
| 207 N Preston Ave Bryan, TX | 2.0 | 2.0 | 1100 | $1,650 | $1.50 | 20d | 1 | 0.93mi |
| 104 W 33rd St Bryan, TX | 2.0 | 2.5 | 1204 | $1,850 | $1.54 | 43d | 1 | 0.97mi |
| 106 W 33rd St Bryan, TX | 2.0 | 2.5 | 1204 | $1,850 | $1.54 | 20d | 1 | 0.97mi |
| 1803 S College Ave Bryan, TX | 3.0 | 3.0 | 1760 | $1,800 | $1.02 | 13d | 1 | 0.98mi |
| 1326 Prairie Dr Bryan, TX | 2.0–3.0 | 2.0–3.0 | 1167 | $1,745 | $1.50 | 20d | 1 | 0.99mi |
| 200 Rebecca St Bryan, TX | 2.0 | 1.0–2.0 | 950 | $830 | $0.87 | 13d | 8 | 1.10mi |
| 509 E Pruitt St Bryan, TX | 4.0 | 4.0 | 2052 | $2,200 | $1.07 | 13d | 1 | 1.14mi |
| 1621 Enloe Ct Bryan, TX | 3.0 | 2.0 | 1158 | $1,525 | $1.32 | 20d | 1 | 1.20mi |
| 1209 N Houston Ave Bryan, TX | 3.0 | 2.0 | 1236 | $1,500 | $1.21 | 13d | 1 | 1.32mi |
| 1409 Broadmoor Dr Bryan, TX | 4.0 | 2.0 | 1141 | $2,000 | $1.75 | 13d | 1 | 1.33mi |
| 601 W 24th St Unit 112 Bryan, TX | 2.0 | 2.0 | 1165 | $1,600 | $1.37 | 43d | 1 | 1.46mi |
| 2702 Apple Creek Cir Bryan, TX | 4.0 | 3.0 | 2198 | $2,800 | $1.27 | 13d | 1 | 1.47mi |
| 908 Water Locust Dr Bryan, TX | 3.0 | 3.0 | 1658 | $1,800 | $1.09 | 13d | 1 | 1.49mi |
| 2902 Chaparral Cir Bryan, TX | 4.0 | 3.0 | 2181 | $3,000 | $1.38 | 20d | 1 | 1.50mi |
Listing history 33 events
-
2026-06-15days on market $84,410 Active 32 DOM
-
2026-06-14days on market $84,410 Active 30 DOM
-
2026-06-13days on market $84,410 Active 29 DOM
-
2026-06-10days on market $84,410 Active 27 DOM
-
2026-06-09days on market $84,410 Active 26 DOM
-
2026-06-08days on market $84,410 Active 25 DOM
-
2026-06-07days on market $84,410 Active 24 DOM
-
2026-06-03days on market $84,410 Active 20 DOM
-
2026-06-02days on market $84,410 Active 19 DOM
-
2026-06-01days on market $84,410 Active 18 DOM
-
2026-05-31days on market $84,410 Active 17 DOM
-
2026-05-30days on market $84,410 Active 16 DOM
-
2026-05-14$84,410 Active 708-char remark
-
2025-10-30historical
-
2025-10-06price $235,000
-
2025-10-06price $235,000
-
2025-09-29price $239,900
-
2025-09-29price $239,900
-
2025-09-12$249,900 Active
-
2025-09-04$249,900 Active
-
2023-03-13soldstatus
-
2023-03-10soldstatus Closed
-
2023-01-26status Pending
-
2023-01-25historical Active Under Contract
-
2023-01-21$216,000 Active
-
2019-12-26soldstatus
-
2019-12-20soldstatus
-
2019-05-27$158,500
-
2013-12-04soldstatus
-
2013-12-03soldstatus
-
2013-10-14$125,000
-
2008-10-23soldstatus
-
2007-05-23soldstatus
ⓘ Source: listings_history table (triggers on properties + properties_extension) + one-shot
backfill from property_details.listing_events for pre-trigger history.
Climate risk First Street
- Flood 1/10 Low FEMA zone X (unshaded) · 0% chance over 30 yrs
- Wildfire 1/10 Low
- Heat 8/10 Severe 7 d/yr ≥110°F today · 24 d/yr by 30 yrs out
- Wind 8/10 Severe 80% chance of damaging wind over 30 yrs
- Air quality 1/10 Low 0 unhealthy d/yr today · 0 by 30 yrs out
Nearby sold comps map
Loading sold comps map…
Walkable amenities ~0.75 mi
Loading nearby amenities…
Taxation est. · year 1
- Rental income
- $21,028
- − Mortgage interest
- −$4,728
- − Property taxes
- −$1,266
- − Insurance
- −$422
- − Repairs & maintenance
- −$1,682
- − Management
- −$1,682
- − Depreciation
- −$2,456
- Taxable income
- $8,792
- Est. tax owed @ 24.0%
- −$2,110
- After-tax cash flow
- $7,502/yr
For passive investors: Depreciation is non-cash, so a rental often shows a tax loss while cash-flowing — sheltering income. Rental losses are passive: they offset passive income freely, and up to $25,000/yr can offset ordinary (W-2) income if you actively participate and your MAGI is under $100k (phasing out to $0 by $150k); unused losses carry forward. On sale, claimed depreciation is recaptured at up to 25%, and gains may owe capital-gains tax (a 1031 exchange can defer both). Figures are a year-1 estimate at your 24.0% rate — not tax advice; consult a CPA.
Schools (NCES district)
- District
- Bryan ISD
- NCES district ID
- 4811790
- Math proficiency
- 30% ▼ -8.00%
- Reading proficiency
- 32% ▼ -3.00%
- Median HH income
- $41,895
- Composite
- 26.26/100
- National rank
- #7253
- State rank
- #608 of 826 in TX
Livability — Bryan
- Score
- 76/100
- State rank
- #99
- US rank
- #3341
Category grades
Schools grade is shown separately in the Schools card above.
Census & demographics
- Census place
- Bryan, TX
- County
- Brazos County · 233,400 people
- City population
- 101,772
- Metro
- College Station-Bryan, TX
- Population (ZIP)
- 25,762
- Household income
- $70,666
- Rent vs Own
- Severe rent burden
- 1559.0
Population outlook (Brazos County) Hauer SSP2
- Today (2025)
- 267,942 people
- By 2030
- 296,630 · +10.7%
- By 2040
- 354,560 · +32.3%
- By 2050
- 414,616 · +54.7%
- By 2075
- 562,158 · +109.8%
- By 2100
- 678,828 · +153.3%
Race, ethnicity, and origin ACS 2023
- Neighborhood character
- Diverse neighborhood (Simpson 0.58)
- Race & ethnicity
- White 59% Hispanic / Latino 26% Two or more races 12% Black 11% Asian 2%
- Hispanic origin (detail)
- Mexican 23%
- Common ancestry
- Lithuanian 3% Slovak 2% Italian 2%
- Foreign-born
- 7% · Canada, South Korea
- Languages at home
- 82% English-only · Spanish 15% Korean 1% Russian/Polish/Slavic 1%
Political lean MEDSL · Brazos
- 2024 margin
- Strong R (+24.9) · D 36.9% · R 61.7% · Other 1.4%
- 2008→2024 swing
- +4.1pp toward D · 2008: -28.9pp · 2024: -24.9pp
- All cycles
- 2024: R+24.9 2020: R+14.3 2016: R+23.7 2012: R+35.3 2008: R+28.9
Not yet ingested
- Civics
- —
Market trends
- HPI YoY
- ▼ -148.67%
- Current HPI
- 202.0858
- Rent YoY
- ▲ 1.82%
- Metro
- College Station-Bryan, TX
- State GDP YoY
- ▲ 3.95%
- F500 in state
- 110
Industry mix (Fortune 500 HQ in TX)
| Industry | F500 HQs | Revenue |
|---|---|---|
| Energy | 16 | $1,198B |
|
||
| Technology | 5 | $198B |
|
||
| Engineering / Construction | 4 | $72B |
|
||
| Energy Services | 3 | $60B |
|
||
| Utilities | 3 | $41B |
|
||
| Healthcare | 2 | $330B |
|
||
Price history
-32.5% since first listed24 events — show timeline
- 2026-06-15 Pending — HARMLS
- 2026-06-15 Sold (MLS) — HARMLS
- 2026-05-14 Sold (Public Records) — Public Records
- 2026-05-14 Listed $84,410 HARMLS
- 2025-10-30 Listing Removed — HARMLS
- 2025-10-06 Price Changed $235,000 BCSRMLS
- 2025-10-06 Price Changed $235,000 HARMLS
- 2025-09-29 Price Changed $239,900 BCSRMLS
- 2025-09-29 Price Changed $239,900 HARMLS
- 2025-09-12 Listed $249,900 HARMLS
- 2025-09-04 Listed $249,900 BCSRMLS
- 2023-03-13 Sold (Public Records) — Public Records
- 2023-03-10 Sold (MLS) — BCSRMLS
- 2023-01-26 Pending — BCSRMLS
- 2023-01-25 Contingent — BCSRMLS
- 2023-01-21 Listed $216,000 BCSRMLS
- 2019-12-26 Sold (Public Records) — Public Records
- 2019-12-20 Sold (MLS) — BCSRMLS
- 2019-05-27 Listed $158,500 BCSRMLS
- 2013-12-04 Sold (Public Records) — Public Records
- 2013-12-03 Sold (MLS) — BCSRMLS
- 2013-10-14 Listed $125,000 BCSRMLS
- 2008-10-23 Sold (Public Records) — Public Records
- 2007-05-23 Sold (Public Records) — Public Records
Property tax history
+6.0%/yrLatest (2025): $5,071 · +10.0% YoY. Source: county tax records.
Cash-flow waterfall
monthlySold comps — $/sqft
last 12 mo · ≤1 miLoading sold comps…