 Duplex
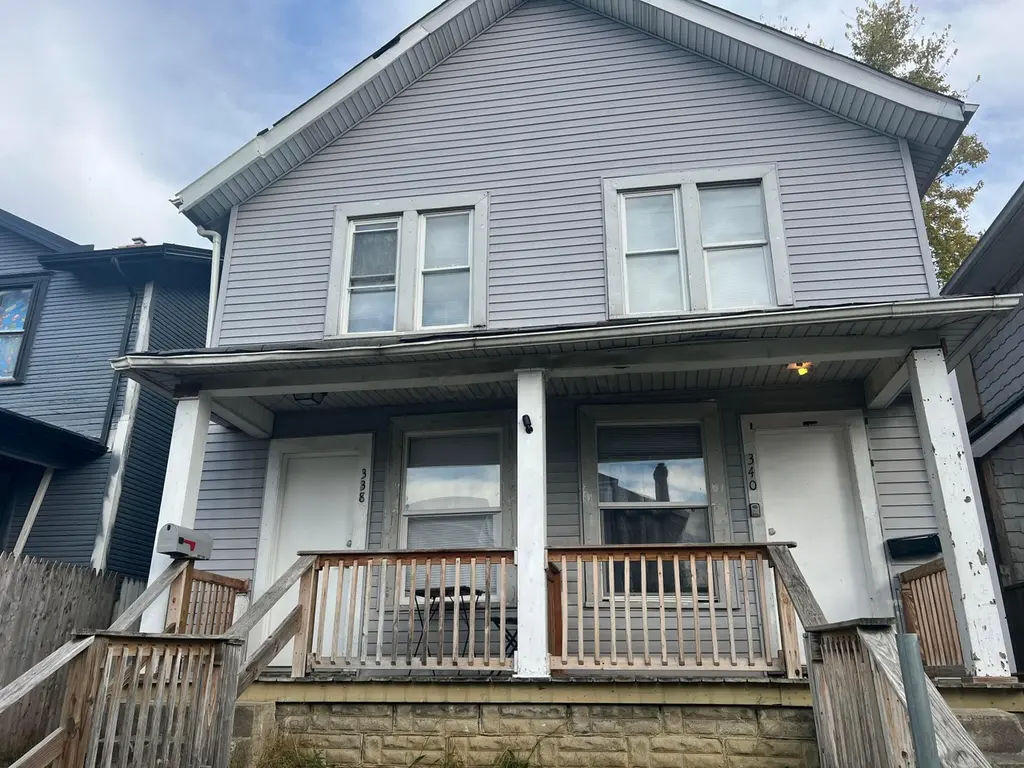
338-340 S Harris Ave · Columbus, OH
Flood risk 1/10 · Minimal
- FEMA flood zone
- X (unshaded)
- Chance of flooding over 30 yrs
- 0.0%
- Est. flood insurance / yr
- $473 – $860
Fire risk 1/10 · Minimal
- Est. fire insurance / yr
- $713 – $1,323
Heat risk 4/10 · Minor
- Hot days now (above 100°F)
- 7 days/yr
- Hot days in 30 yrs
- 18 days/yr
Wind risk 2/10 · Minimal
- Chance of severe wind over 30 yrs
- 1.0%
Air-quality risk 2/10 · Minimal
- Unhealthy air days now
- 1 days/yr
- Unhealthy air days in 30 yrs
- 2 days/yr
Risk factors via First Street. Map © Google.
Why this score? — see what drove the C+ grade
The composite is a weighted blend of 9 inputs, each scored 0–100. Each bar is that input's sub-score; the figure is the points it added to the 100-point composite (weight × sub-score).
- Cash flow +23.8/30.0
- ARV discount +13.5/15.0
- DSCR +7.6/10.0
- 1% rule +5.4/10.0
- Livability +4.0/5.0
- Rent growth +3.6/5.0
- Condition / age +2.5/5.0
- Schools +1.7/10.0
- Appreciation +0.0/10.0
$199,000
🖨 Deal sheet (PDF) 📄 Offer letter ✓ Due diligence
Multi-family units
County records classify this as Multi-Family (2-4 Unit). Listing-text estimate: 2 units. confirmed
Listing remarks MLS
· Fully occupied duplex For Sale · Curb Offers only · 100% Occupancy of the Duplex · Investment property located in Columbus' Hilltop Region -$29,400 for income per year. · Please do not disturb tenants
Key facts
- Hilltop region
- Investment property
- 4,356 sq ft lot
Tags
Neighborhood map
What this means for you Summary
Snapshot
- This is a 2 × 1-bed/1-bath units multifamily listed at $199k.
Deal economics
- At list price, monthly cash flow is $381 ($5k/yr) — positive. Per door: $190/mo.
- The deal already cash-flows at list — no discount required.
- Meets the 1% rule at list price ($2k rent vs $199k).
- Recommended offer: $175k (12.0% below list) — sets the bar for market timing.
- Cap rate 8.6% vs local median 3.8% in Columbus — top-decile yield for the area; either an underpriced asset or a hidden risk that comps aren't pricing in. Stress-test before assuming the spread holds.
Location & tenants
- Location reads 81/100 on livability (#97 in OH, #1,491 nationally) — a professional / high-income tenant draw. Strengths: commute A+, cost of living A+, housing A+; Watch: employment C-, crime F.
- Columbus City School District (urban): math 15% / reading 26% proficiency, ranked #626 of 656 in OH (top 95%) — low school quality limits family demand, transient renter base, plan for 1-2y turnover; 72% free/reduced lunch — lower-income household profile, screen leases tightly.
- Zoned schools: Indianola Informal K-8 School (math 43% / reading 58%, grade D+, #896 of 1,584 statewide, top 57%, 684 students, 0% FRL); Arts Impact Middle School (Aims) (math 17% / reading 25%, grade F, #608 of 654 statewide, top 93%, 532 students, 0% FRL); Briggs High School (math 2% / reading 22%, grade F, #726 of 781 statewide, top 94%, 980 students, 0% FRL) — zoned schools average 0% FRL vs 72% district-wide (72 pts lower); this property's tenant base skews higher-income than the district average.
- Market conditions: Rents rising fast (+4.5%/yr); 187 active listings in the ZIP; 37 comparable units currently listed for rent nearby; rentals at typical pace (median 21d on market — plan ~3-4 weeks tenant-placement turnaround); 8,139 units permitted in Franklin County in 2024 (5,940 in 5+ unit buildings).
- This rent runs 42% of the median local income ($59k/yr) — at the standard rent-burdened threshold; future hikes will face affordability resistance.
Forward outlook
- Local home prices are declining (-3.0%/yr); year-one equity from $1k of loan paydown is wiped out by about $6k of value loss. Plan a longer hold.
- Franklin County population projected at +34% by 2050 — long-run rental-demand tailwind backs the buy-and-hold thesis.
Negotiation context
- It's been on market 122 days — a 12% lower offer ($175k) is reasonable based on typical stale-listing flexibility.
- 7 sale attempts since 10y ago with the ask held roughly flat each time — persistent listings suggest the price (not the market) is what's stuck; bring a comps-based counter.
- Current owner paid $22k; list at $199k implies a 805% gain — meaningful room to come down on a strong offer.
Risks & watch-outs
- Watch-outs: built in 1920 — expect roof / HVAC / electrical / plumbing capex.
Questions for the listing agent
- It's been on market 122 days. Have you received any prior offers? Is the seller open to a 12% concession, seller financing, or rate buy-down credit?
- Can we see the unit-by-unit rent roll, current vacancy, and any below-market leases? What's the average tenancy length?
- What capital expenditures (roof, boiler, parking lot, exteriors) have been made in the last 5 years, and what's planned in the next 2?
- Built in 1920 — when were the roof, HVAC, electrical panel, plumbing, and water heater last replaced?
- Why hasn't it sold? Are there any deal-killer items the seller is aware of (foundation, flood, title, zoning, code violations)?
- Is there a deadline driving the sale (1031 exchange, divorce, estate, relocation)? That informs how much negotiation room exists.
- Crime grade is F in this area — have there been break-ins, vandalism, or insurance claims at this property in the last 3 years? What carrier currently insures it and at what premium?
- What's the average days-on-market for RENTAL listings here right now (not sales)? A rising rental-DOM trend means longer vacancies and softer asking-rent achievability than the comps imply.
- What's the recent tenant-quality profile in this submarket — average credit score on applications, eviction rate, late-payment / NSF rate, and stable-employment percentage? A property-management company in the area should have these aggregated.
- How much new apartment / multifamily construction is in the pipeline within 1–3 miles? Heavy new supply (>2% of stock underway) typically softens rents 12–24 months out; light construction supports rent growth.
Investment metrics
- 1% rule
- 1.04% ✓
- Cap rate
- 8.59%
- Cash-on-cash
- 8.20%
- DSCR
- 1.36
- GRM
- 8.0
CMA / ARV
- ARV (median comp)
- $229,841
- List price
- $199,000
- Delta
- -13.42%
- Verdict
- UNDERPRICED
- Comps
- 20 within 1.0 mi
Show comp detail 12 sales within ~0.75 mi
| Address | Dist | Beds/Ba | Sqft | Sold | Price | $/sf | Match |
|---|---|---|---|---|---|---|---|
| 423 S Hague Ave | 0.16mi | 3/— (-1) | 1,594 (-4%) | 4mo | $168,000 | $105 | 77 |
| 361 S Harris Ave #361 | 0.05mi | 5/— (+1) | 1,890 (+14%) | 1mo | $180,000 | $95 | 69 |
| 23-25 N Warren Ave | 0.53mi | 3/— (-1) | 1,616 (-3%) | 15mo | $120,000 | $74 | 53 |
| 570 S Roys Ave | 0.43mi | 4/— | 1,770 (+6%) | 20mo | $255,000 | $144 | 52 |
| 388 S Powell Ave | 0.15mi | 4/— | 1,427 (-14%) | 24mo | $235,000 | $165 | 50 |
| 46-48 Haldy Ave | 0.66mi | 4/— | 1,716 (+3%) | 19mo | $265,000 | $154 | 48 |
| 2748 Vanderberg Ave | 0.74mi | 4/— | 1,581 (-5%) | 12mo | $160,000 | $101 | 47 |
| 839-841 S Ogden Ave | 0.72mi | 4/— | 1,457 (-12%) | 1mo | $173,000 | $119 | 45 |
| 223 S Wayne Ave | 0.45mi | 4/— | 1,860 (+12%) | 24mo | $263,000 | $141 | 39 |
| 2703-2705 Eakin Rd | 0.71mi | 4/— | 1,457 (-12%) | 14mo | $227,000 | $156 | 34 |
| 2736-2738 Grace St | 0.63mi | 4/— | 1,848 (+11%) | 24mo | $130,000 | $70 | 32 |
| 19 S Wheatland Ave | 0.71mi | 3/— (-1) | 1,456 (-12%) | 18mo | $199,000 | $137 | 27 |
Match score weights: distance 35% · size 25% · config 20% · recency 20%. Top-matched comps best support the ARV.
Projected returns pro-forma
-3.0% appreciation · 4.49% rent growth · sell at horizon
- IRR
- -2.3%
- Equity multiple
- 0.91×
- Total profit
- $-4,910
- Equity at exit
- $29,672
- IRR
- 8.8%
- Equity multiple
- 1.72×
- Total profit
- $40,026
- Equity at exit
- $17,206
Cash invested: $55,720 (down + closing). Projections, not guarantees.
Landlord ↔ Tenant lean methodology
- Overall (STATE)
- 73 Landlord-Friendly
- State Ohio
- 73 Landlord-Friendly · R+6
- County
- — inherits STATE
- City
- — inherits STATE
ZIP-level market 43204
- Rents YoY
- 4.5%
- Active inventory
- 187
- Price-to-rent
- 16.1×
Monthly cashflow live
- Estimated rent
- $2,062 high interval (Pro) →
- Mortgage (P&I)
- −$1,044
- Tax from tax record
- −$122 /mo · $1,461/yr
- Insurance
- −$83
- HOA
- −$0
- Vacancy / Maint / Mgmt
- −$433
- Net cashflow
- $381
Break-even live
Sensitivity live
| Price | -10% $493 | -5% $437 | +0% $381 | +5% $324 | +10% $268 |
|---|---|---|---|---|---|
| Rent | -10% $218 | -5% $299 | +0% $381 | +5% $462 | +10% $544 |
| Rate | -1.0pp $481 | -0.5pp $431 | base $381 | +0.5pp $329 | +1.0pp $277 |
2-unit breakdown (identical units grouped — click to expand)
| Units | Beds | Baths | Est. rent |
|---|---|---|---|
| 2× units | 1 | 1 | $2,062 |
| #1 | 1 | 1 | $1,031 |
| #2 | 1 | 1 | $1,031 |
| Total (2 units) | $2,062 | ||
UW: 25.0% down · 7.5% · 30yr · 1.5% tax · 5.0% vac · 8.0% maint · 8.0% mgmt
Financing live
Cash to close
- Down payment
- $49,750
- Closing costs
- $5,970
- Reserves months
- —
- Total cash needed
- —
Loan-product check · same deal, 3 products live
Conventional
25% down · 7.5% · 30yr
- Down + closing
- —
- Monthly P&I
- —
- Monthly cashflow
- —
- DSCR
- —
- Eligible?
- —
Personal DTI + credit; lowest rate.
DSCR
20% down · 8.5% · 30yr
- Down + closing
- —
- Monthly P&I
- —
- Monthly cashflow
- —
- DSCR
- —
- Eligible?
- —
No personal income docs; deal must DSCR.
Hard money
10% down · 12.0% · 12mo
- Down + closing
- —
- Monthly P&I
- —
- Monthly cashflow
- —
- DSCR
- —
- Eligible?
- —
Short-term bridge; refi at stabilization.
Rent comps 37 comps
| Address | Beds | Baths | Sqft | Rent | $/sqft | DOM | Units | Dist |
|---|---|---|---|---|---|---|---|---|
| 2676 Sullivant Ave Columbus, OH | 3.0 | 1.0 | 1524 | $1,200 | $0.79 | 45d | 1 | 0.27mi |
| 2709-2711 Sullivant Ave Unit 2709 Columbus, OH | 3.0 | 2.0 | 1344 | $1,380 | $1.03 | 4d | 1 | 0.30mi |
| 2709-2711 Sullivant Ave Columbus, OH | 3.0 | 2.0 | 1344 | $1,380 | $1.03 | 4d | 1 | 0.30mi |
| 92 S Hague Ave Columbus, OH | 3.0 | 2.0 | 1456 | $1,400 | $0.96 | 25d | 1 | 0.36mi |
| 2545-2547 Sullivant Ave Columbus, OH | 3.0 | 1.0 | 1064 | $1,100 | $1.03 | 12d | 1 | 0.37mi |
| 80 S Warren Ave Columbus, OH | 3.0 | 1.0 | 1258 | $1,345 | $1.07 | 5d | 1 | 0.37mi |
| 80 S Warren Ave Columbus, OH | 3.0 | 1.0 | 1258 | $1,345 | $1.07 | 45d | 1 | 0.37mi |
| 608 Racine Ave #610 Columbus, OH | 3.0 | 1.0 | 1168 | $1,195 | $1.02 | 45d | 1 | 0.39mi |
| 329 S Wayne Ave Columbus, OH | 3.0 | 1.0 | 1120 | $1,425 | $1.27 | 4d | 1 | 0.42mi |
| 616-618 S Ogden Ave Columbus, OH | 3.0 | 1.0 | 1100 | $1,125 | $1.02 | 45d | 1 | 0.42mi |
| 252-254 S Wayne Ave Unit 254 Columbus, OH | 3.0 | 1.0 | 1120 | $1,300 | $1.16 | 18d | 1 | 0.47mi |
| 661-663 S Burgess Ave Columbus, OH | 3.0 | 1.0 | 1100 | $1,028 | $0.93 | 45d | 1 | 0.50mi |
| 521-523 S Wayne Ave Columbus, OH | 3.0 | 1.0 | 1092 | $1,195 | $1.09 | 5d | 1 | 0.50mi |
| 29 S Terrace Ave Columbus, OH | 3.0 | 1.0 | 1144 | $1,260 | $1.10 | 25d | 1 | 0.52mi |
| 27-29 N Terrace Ave Unit 29 Columbus, OH | 3.0 | 1.0 | 1144 | $1,260 | $1.10 | 25d | 1 | 0.52mi |
| 54 N Ogden Ave Columbus, OH | 3.0 | 1.0 | 1176 | $950 | $0.81 | 3d | 1 | 0.58mi |
| 43-45 N Chase Ave Unit 43 Columbus, OH | 3.0 | 1.0 | 1200 | $1,400 | $1.17 | 12d | 1 | 0.60mi |
| 43 N Chase Ave Columbus, OH | 3.0 | 1.0 | 1200 | $1,400 | $1.17 | 12d | 1 | 0.60mi |
| 43 N Roys Ave Columbus, OH | 3.0 | 1.5 | 1332 | $1,599 | $1.20 | 25d | 1 | 0.63mi |
| 41 S Oakley Ave Columbus, OH | 3.0 | 1.5 | 1428 | $1,550 | $1.09 | 45d | 1 | 0.65mi |
| 695 S Eureka Ave Columbus, OH | 3.0 | 1.0 | 1344 | $1,425 | $1.06 | 22d | 1 | 0.66mi |
| 41-43 N Huron Ave Unit 41 Columbus, OH | 3.0 | 1.0 | 1176 | $1,400 | $1.19 | 9d | 1 | 0.71mi |
| 2745-2747 Steele Ave Columbus, OH | 3.0 | 1.0 | 2128 | $1,200 | $0.56 | 45d | 1 | 0.72mi |
| 130 N Roys Ave Columbus, OH | 3.0 | 1.0 | 1380 | $1,595 | $1.16 | 3d | 1 | 0.73mi |
| 2205 Sullivant Ave Columbus, OH | 3.0 | 1.0 | 1275 | $1,200 | $0.94 | 45d | 1 | 0.76mi |
| 133 N Eureka Ave Columbus, OH | 3.0 | 1.0 | 1484 | $1,350 | $0.91 | 14d | 1 | 0.77mi |
| 2735 Sutton Ave Columbus, OH | 3.0 | 1.0 | 1099 | $1,175 | $1.07 | 5d | 1 | 0.79mi |
| 692 S Wheatland Ave Columbus, OH | 3.0 | 1.0 | 1608 | $1,547 | $0.96 | 45d | 1 | 0.81mi |
| 95-97 Whitethorne Ave Columbus, OH | 3.0 | 1.5 | 1260 | $1,475 | $1.17 | 21d | 1 | 0.89mi |
| 95-97 Whitethorne Ave Columbus, OH | 3.0 | 1.5 | 1260 | $1,375 | $1.09 | 5d | 1 | 0.89mi |
| 945 Hodges Dr Columbus, OH | 3.0 | 1.0 | 1078 | $1,640 | $1.52 | 25d | 1 | 0.89mi |
| 179 N Sylvan Ave Unit 179 Columbus, OH | 3.0 | 2.0 | 1152 | $2,000 | $1.74 | 18d | 1 | 1.06mi |
| 1964 Sullivant Ave Columbus, OH | 4.0 | 2.0 | 1580 | $1,650 | $1.04 | 25d | 1 | 1.10mi |
| 2730 Elliott Ave Columbus, OH | 3.0 | 1.0 | 1332 | $1,803 | $1.35 | 45d | 1 | 1.13mi |
| 488 Woodbury Ave Columbus, OH | 3.0 | 1.5 | 1222 | $1,250 | $1.02 | 45d | 1 | 1.31mi |
| 543 Woodbury Ave Unit NA Columbus, OH | 3.0 | 1.0 | 1308 | $1,645 | $1.26 | 16d | 1 | 1.31mi |
| 1241 Riegelwood Ln Columbus, OH | 4.0 | 3.0 | 1868 | $2,480 | $1.33 | 3d | 1 | 1.48mi |
Listing history 36 events
-
2026-06-18days on market $199,000 Active 122 DOM
-
2026-06-17days on market $199,000 Active 121 DOM
-
2026-06-16days on market $199,000 Active 120 DOM
-
2026-06-15days on market $199,000 Active 119 DOM
-
2026-06-13days on market $199,000 Active 117 DOM
-
2026-06-13days on market $199,000 Active 116 DOM
-
2026-06-09days on market $199,000 Active 113 DOM
-
2026-06-08days on market $199,000 Active 112 DOM
-
2026-06-07days on market $199,000 Active 111 DOM
-
2026-06-05days on market $199,000 Active 108 DOM
-
2026-06-03days on market $199,000 Active 107 DOM
-
2026-06-02days on market $199,000 Active 106 DOM
-
2026-06-01days on market $199,000 Active 105 DOM
-
2026-05-31days on market $199,000 Active 104 DOM
-
2026-02-16$199,000 Active 241-char remark
Show marketing remark (241 chars)
· Fully occupied duplex For Sale · Curb Offers only · 100% Occupancy of the Duplex · Investment property located in Columbus' Hilltop Region -$29,400 for income per year. · Please do not disturb tenants
-
2025-12-18historical $1,250
-
2025-11-09$1,250
-
2024-07-02historical $1,100
-
2024-05-24$1,100
-
2024-02-01historical
-
2023-11-07historical
-
2023-11-06
-
2023-10-14historical
-
2023-08-24
-
2017-06-12soldstatus $22,000
-
2017-06-09soldstatus $22,000 Closed 83-char remark
Show marketing remark (83 chars)
Investor property. Sold AS IS Rents in the area are good so ROI works. No lowballs.
-
2017-05-04status Pending 83-char remark
Show marketing remark (83 chars)
Investor property. Sold AS IS Rents in the area are good so ROI works. No lowballs.
-
2017-04-21$35,000 Active 83-char remark
Show marketing remark (83 chars)
Investor property. Sold AS IS Rents in the area are good so ROI works. No lowballs.
-
2017-01-25soldstatus $25,000
-
2017-01-20soldstatus $25,000 Closed
-
2017-01-16status Pending
-
2016-12-13$25,000 Active
-
2014-01-21soldstatus $132,500
-
2007-10-01soldstatus $25,000
-
1990-09-28soldstatus $98,000
-
1990-09-28soldstatus $98,000
ⓘ Source: listings_history table (triggers on properties + properties_extension) + one-shot
backfill from property_details.listing_events for pre-trigger history.
Tax reassessment forecast OH · Partial reset (capped growth)
- Current annual tax
- $1,461 · $122/mo
- Projected year-2 tax
- $2,283 · $190/mo
- Expected delta
- +$821/yr (+$68/mo · 56.2%)
ⓘ Screening estimate from a state-policy table — verify with the county assessor before closing.
Climate risk First Street
- Flood 1/10 Low FEMA zone X (unshaded) · 0% chance over 30 yrs
- Wildfire 1/10 Low
- Heat 4/10 Moderate 7 d/yr ≥100°F today · 18 d/yr by 30 yrs out
- Wind 2/10 Low 100% chance of damaging wind over 30 yrs
- Air quality 2/10 Low 1 unhealthy d/yr today · 2 by 30 yrs out
Nearby sold comps map
Loading sold comps map…
Walkable amenities ~0.75 mi
Loading nearby amenities…
Taxation est. · year 1
- Rental income
- $24,744
- − Mortgage interest
- −$11,147
- − Property taxes
- −$1,461
- − Insurance
- −$995
- − Repairs & maintenance
- −$1,980
- − Management
- −$1,980
- − Depreciation
- −$5,789
- Taxable income
- $1,392
- Est. tax owed @ 24.0%
- −$334
- After-tax cash flow
- $4,234/yr
For passive investors: Depreciation is non-cash, so a rental often shows a tax loss while cash-flowing — sheltering income. Rental losses are passive: they offset passive income freely, and up to $25,000/yr can offset ordinary (W-2) income if you actively participate and your MAGI is under $100k (phasing out to $0 by $150k); unused losses carry forward. On sale, claimed depreciation is recaptured at up to 25%, and gains may owe capital-gains tax (a 1031 exchange can defer both). Figures are a year-1 estimate at your 24.0% rate — not tax advice; consult a CPA.
Schools (NCES district)
- District
- Columbus City School District
- NCES district ID
- 3904380
- Math proficiency
- 15% ▼ -17.00%
- Reading proficiency
- 26% ▼ -12.00%
- Median HH income
- $38,483
- Composite
- 17.19/100
- National rank
- #9105
- State rank
- #626 of 656 in OH
Livability — Columbus
- Score
- 81/100
- State rank
- #97
- US rank
- #1491
Category grades
Schools grade is shown separately in the Schools card above.
Census & demographics
- Census place
- Columbus, OH
- County
- Franklin County · 1,351,780 people
- City population
- 612,189
- Metro
- Columbus, OH
- Population (ZIP)
- 42,962
- Household income
- $59,266
- Rent vs Own
- Severe rent burden
- 2290.0
Population outlook (Franklin County) Hauer SSP2
- Today (2025)
- 1,456,139 people
- By 2030
- 1,556,890 · +6.9%
- By 2040
- 1,757,349 · +20.7%
- By 2050
- 1,950,539 · +34.0%
- By 2075
- 2,376,171 · +63.2%
- By 2100
- 2,636,796 · +81.1%
Race, ethnicity, and origin ACS 2023
- Neighborhood character
- Diverse neighborhood (Simpson 0.58)
- Race & ethnicity
- White 61% Hispanic / Latino 16% Black 13% Two or more races 12% Asian 3%
- Hispanic origin (detail)
- Mexican 9%
- Common ancestry
- Lithuanian 1% Slovak 1% Romanian 1%
- Foreign-born
- 13% · Canada
- Languages at home
- 81% English-only · Spanish 13% Arabic 2% Other Asian/Pacific 1%
Political lean MEDSL · Franklin
- 2024 margin
- Strong D (+28.4) · D 63.7% · R 35.3% · Other 1.0%
- 2008→2024 swing
- +7.7pp toward D · 2008: 20.7pp · 2024: 28.4pp
- All cycles
- 2024: D+28.4 2020: D+31.4 2016: D+25.9 2012: D+21.7 2008: D+20.7
Not yet ingested
- Civics
- —
Market trends
- HPI YoY
- ▼ -220.67%
- Current HPI
- 265.7711
- Rent YoY
- ▲ 4.49%
- Metro
- Columbus, OH
- State GDP YoY
- ▲ 1.98%
- F500 in state
- 48
Industry mix (Fortune 500 HQ in OH)
| Industry | F500 HQs | Revenue |
|---|---|---|
| Insurance | 3 | $145B |
|
||
| Industrial Machinery | 3 | $49B |
|
||
| Financial Services | 3 | $24B |
|
||
| Consumer Goods | 2 | $93B |
|
||
| Aerospace / Defense | 2 | $47B |
|
||
| Utilities | 2 | $33B |
|
||
Price history
+103.1% since first listed22 events — show timeline
- 2026-02-16 Listed $199,000 CBRMLS
- 2025-12-18 Rental Removed $1,250 BUILDIUM
- 2025-11-09 Listed for Rent $1,250 BUILDIUM
- 2024-07-02 Rental Removed $1,100 BUILDIUM
- 2024-05-24 Listed for Rent $1,100 BUILDIUM
- 2024-02-01 Rental Removed — BUILDIUM
- 2023-11-07 Rental Removed — BUILDIUM
- 2023-11-06 Listed for Rent — BUILDIUM
- 2023-10-14 Rental Removed — BUILDIUM
- 2023-08-24 Listed for Rent — BUILDIUM
- 2017-06-12 Sold (Public Records) $22,000 Public Records
- 2017-06-09 Sold (MLS) $22,000 CBRMLS
- 2017-05-04 Pending — CBRMLS
- 2017-04-21 Listed $35,000 CBRMLS
- 2017-01-25 Sold (Public Records) $25,000 Public Records
- 2017-01-20 Sold (MLS) $25,000 CBRMLS
- 2017-01-16 Pending — CBRMLS
- 2016-12-13 Listed $25,000 CBRMLS
- 2014-01-21 Sold (Public Records) $132,500 Public Records
- 2007-10-01 Sold (Public Records) $25,000 Public Records
- 1990-09-28 Sold (Public Records) $98,000 Public Records
- 1990-09-28 Sold (Public Records) $98,000 Public Records
Property tax history
-1.7%/yrLatest (2024): $1,461 · +1.3% YoY. Source: county tax records.
Cash-flow waterfall
monthlySold comps — $/sqft
last 12 mo · ≤1 miLoading sold comps…