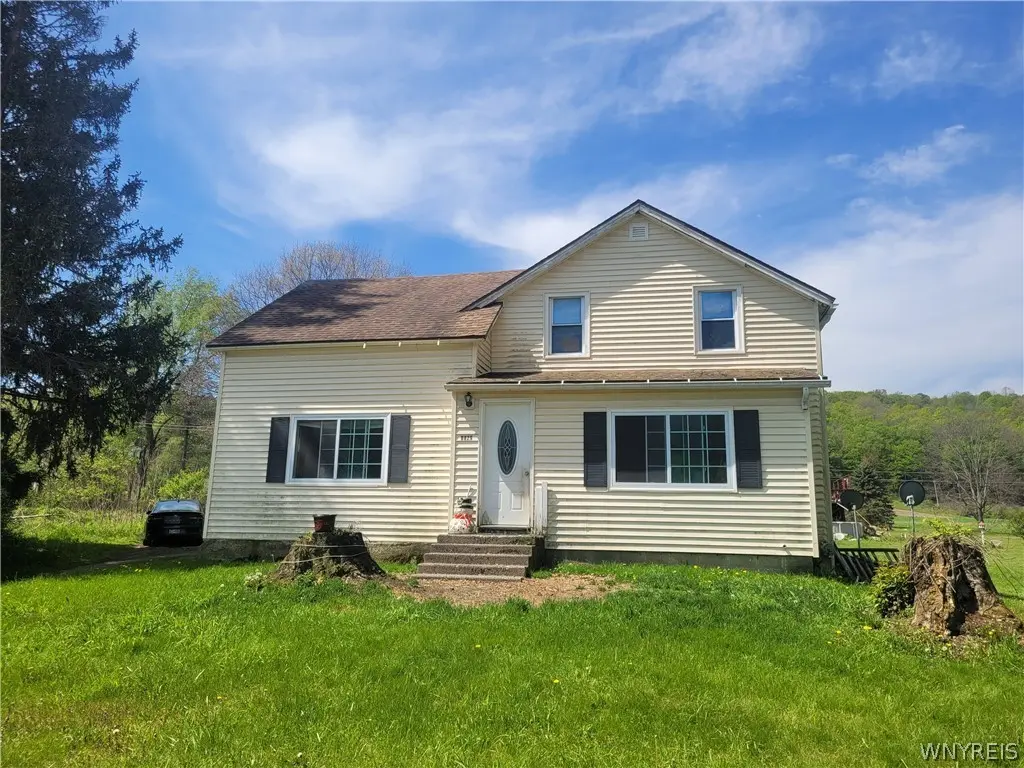
6829 Nys Route 353 · Cattaraugus, NY
Flood risk 1/10 · Minimal
- FEMA flood zone
- X
- Chance of flooding over 30 yrs
- 0.0%
- Est. flood insurance / yr
- $473 – $860
Fire risk 1/10 · Minimal
- Est. fire insurance / yr
- $691 – $1,283
Heat risk 1/10 · Minimal
- Hot days now (above 89°F)
- 8 days/yr
- Hot days in 30 yrs
- 18 days/yr
Wind risk 1/10 · Minimal
- Chance of severe wind over 30 yrs
- —
Air-quality risk 2/10 · Minimal
- Unhealthy air days now
- 0 days/yr
- Unhealthy air days in 30 yrs
- 1 days/yr
Risk factors via First Street. Map © Google.
Why this score? — see what drove the D grade
The composite is a weighted blend of 9 inputs, each scored 0–100. Each bar is that input's sub-score; the figure is the points it added to the 100-point composite (weight × sub-score).
- Appreciation +10.0/10.0
- Cash flow +8.3/30.0
- ARV discount +7.5/15.0
- Schools +3.9/10.0
- Livability +3.0/5.0
- 1% rule +2.6/10.0
- Rent growth +2.5/5.0
- Condition / age +2.5/5.0
- DSCR +2.3/10.0
$149,900
🖨 Deal sheet 📄 Offer letter ✓ Due diligence
Listing remarks
Welcome to this beautifully remodeled home updated from top to bottom, inside and out! The first floor offers a spacious living room filled with natural light, a formal dining room perfect for holiday gatherings, and a large kitchen with plenty of cabinetry and workspace for preparing your favorite meals. A convenient first-floor laundry area and full bathroom add everyday practicality, while the second story features three bedrooms and an additional full bathroom. The oversized primary bedroom offers incredible flexibility and could easily function as a private retreat, studio-style suite, hobby space, or spacious home office. The property is being subdivided from a larger parcel, with the
Key facts
- 0.6 acre lot
- Parking
- Built 1900
Property features AI
Exterior
- Parking: No garage; Shared driveway
- Utilities: Electricity connected with circuit breakers; Public water connected; Septic tank; High-speed internet available
- Home design: Two-story home; Existing/resale property
- Construction: Vinyl siding; Stone foundation
- Exterior features: Gravel driveway; Rectangular lot; Road frontage on a main thoroughfare
Interior
- Kitchen: Kitchen on the first floor; Electric water heater
- Bedrooms: Three bedrooms on the second floor
- Flooring: Carpet; Laminate; Varies
- Bathrooms: Two full bathrooms, one on the main level
- Heating & cooling: Gas forced-air heating
- Interior features: Ceiling fan(s); Separate/formal dining room; Separate/formal living room; Full basement
- Laundry & utility: Main-level laundry
Neighborhood map
What this means for you Summary
Snapshot
- This is a 3-bed/2.0-bath single-family listed at $150k.
Deal economics
- At list price, monthly cash flow is $-137 ($-2k/yr) — negative.
- To cash-flow at today's rent, offer at most $130k (13.3% below list).
- To meet the 1% rule (rent ≥ 1% of price), the offer needs to be $114k (24.1% below list).
- Recommended offer: $114k (24.1% below list) — sets the bar for 1% rule.
Location & tenants
- Location reads 60/100 on livability (#973 in NY) — a middle-class / working-renter tenant base. Strengths: cost of living A+, housing A; Watch: employment C-, crime F, amenities F.
- Cattaraugus-Little Valley Central School District (rural): math 42% / reading 49% proficiency, ranked #460 of 590 in NY (top 78%) — families likely to look elsewhere, expect single-tenant / working-renter base with shorter leases.
- Market conditions: 21 active listings in the ZIP; 128 units permitted in Cattaraugus County in 2024 (21 in 5+ unit buildings).
Forward outlook
- In year one you build about $16k of equity ($1k loan paydown + $15k appreciation (10.0% local appreciation)).
- Cattaraugus County population projected at -28% by 2050 — secular population decline; favor cash flow + early exit over multi-decade hold.
- By year 3, paydown + projected appreciation supports a ~$41k cash-out refi (75% LTV) — recoverable capital for the next deal without selling this one.
Negotiation context
- It's been on market 23 days — a 2% lower offer ($148k) is reasonable based on typical stale-listing flexibility.
Risks & watch-outs
- Watch-outs: built in 1900 — expect roof / HVAC / electrical / plumbing capex.
Questions for the listing agent
- What do current leases actually rent for vs. the listed asking? Can we see a recent rent roll and the last 12 months of T-12 income?
- Built in 1900 — when were the roof, HVAC, electrical panel, plumbing, and water heater last replaced?
- Is there a deadline driving the sale (1031 exchange, divorce, estate, relocation)? That informs how much negotiation room exists.
- Crime grade is F in this area — have there been break-ins, vandalism, or insurance claims at this property in the last 3 years? What carrier currently insures it and at what premium?
- The area grade is low — what's the realistic commute time and amenity access for the typical tenant pool here? Any planned neighborhood developments (good or bad) we should know about?
- What's the average days-on-market for RENTAL listings here right now (not sales)? A rising rental-DOM trend means longer vacancies and softer asking-rent achievability than the comps imply.
- What's the recent tenant-quality profile in this submarket — average credit score on applications, eviction rate, late-payment / NSF rate, and stable-employment percentage? A property-management company in the area should have these aggregated.
- How much new for-sale + rental construction is in the pipeline within 1–3 miles? Heavy new supply typically softens prices + rents 12–24 months out; constrained supply supports both.
Investment metrics
- 1% rule
- 0.76% ✗
- Cap rate
- 5.19%
- Cash-on-cash
- -3.93%
- DSCR
- 0.83
- GRM
- 11.0
CMA / ARV
No comps found within radius.
Projected returns pro-forma
10.0% appreciation · 3.0% rent growth · sell at horizon
- IRR
- 21.5%
- Equity multiple
- 2.74×
- Total profit
- $72,905
- Equity at exit
- $135,042
- IRR
- 19.4%
- Equity multiple
- 6.28×
- Total profit
- $221,610
- Equity at exit
- $291,223
Cash invested: $41,972 (down + closing). Projections, not guarantees.
Landlord ↔ Tenant lean methodology
- Overall (STATE)
- 15 Strongly Tenant-Friendly
- State New York
- 15 Strongly Tenant-Friendly · D+10
- County
- — inherits STATE
- City
- — inherits STATE
ZIP-level market 14719
- Home prices YoY
- 3.4%
- Active inventory
- 21
- Price-to-rent
- 11.0×
Monthly cashflow live
- Estimated rent
- $1,137 medium interval (Pro) →
- Mortgage (P&I)
- −$786
- Tax est. 1.5%
- −$187 /mo · $2,248/yr
- Insurance
- −$62
- HOA
- −$0
- Vacancy / Maint / Mgmt
- −$239
- Net cashflow
- $-137
Break-even live
UW: 25.0% down · 7.5% · 30yr · 1.5% tax · 5.0% vac · 8.0% maint · 8.0% mgmt
Financing live
Cash to close
- Down payment
- $37,475
- Closing costs
- $4,497
- Reserves months
- —
- Total cash needed
- —
Loan-product check · same deal, 3 products live
Conventional
25% down · 7.5% · 30yr
- Down + closing
- —
- Monthly P&I
- —
- Monthly cashflow
- —
- DSCR
- —
- Eligible?
- —
Personal DTI + credit; lowest rate.
DSCR
20% down · 8.5% · 30yr
- Down + closing
- —
- Monthly P&I
- —
- Monthly cashflow
- —
- DSCR
- —
- Eligible?
- —
No personal income docs; deal must DSCR.
Hard money
10% down · 12.0% · 12mo
- Down + closing
- —
- Monthly P&I
- —
- Monthly cashflow
- —
- DSCR
- —
- Eligible?
- —
Short-term bridge; refi at stabilization.
Listing history 15 events
-
2026-06-18days on market $149,900 Active 23 DOM
-
2026-06-17days on market $149,900 Active 22 DOM
-
2026-06-16days on market $149,900 Active 21 DOM
-
2026-06-15days on market $149,900 Active 20 DOM
-
2026-06-13days on market $149,900 Active 18 DOM
-
2026-06-12days on market $149,900 Active 17 DOM
-
2026-06-09days on market $149,900 Active 14 DOM
-
2026-06-08days on market $149,900 Active 13 DOM
-
2026-06-07days on market $149,900 Active 12 DOM
-
2026-06-07days on market $149,900 Active 11 DOM
-
2026-06-04days on market $149,900 Active 8 DOM
-
2026-06-02days on market $149,900 Active 7 DOM
-
2026-06-01days on market $149,900 Active 6 DOM
-
2026-05-31days on market $149,900 Active 5 DOM
-
2026-05-25$149,900 Active
ⓘ Source: listings_history table (triggers on properties + properties_extension) + one-shot
backfill from property_details.listing_events for pre-trigger history.
Climate risk First Street
- Flood 1/10 Low FEMA zone X · 0% chance over 30 yrs
- Wildfire 1/10 Low
- Heat 1/10 Low 8 d/yr ≥89°F today · 18 d/yr by 30 yrs out
- Wind 1/10 Low
- Air quality 2/10 Low 0 unhealthy d/yr today · 1 by 30 yrs out
Nearby sold comps map
Loading sold comps map…
Walkable amenities ~0.75 mi
Loading nearby amenities…
Taxation est. · year 1
- Rental income
- $13,648
- − Mortgage interest
- −$8,397
- − Property taxes
- −$2,248
- − Insurance
- −$750
- − Repairs & maintenance
- −$1,092
- − Management
- −$1,092
- − Depreciation
- −$4,361
- Taxable loss
- −$4,291
- Est. tax savings @ 24.0%
- +$1,030
- After-tax cash flow
- $-619/yr
For passive investors: Depreciation is non-cash, so a rental often shows a tax loss while cash-flowing — sheltering income. Rental losses are passive: they offset passive income freely, and up to $25,000/yr can offset ordinary (W-2) income if you actively participate and your MAGI is under $100k (phasing out to $0 by $150k); unused losses carry forward. On sale, claimed depreciation is recaptured at up to 25%, and gains may owe capital-gains tax (a 1031 exchange can defer both). Figures are a year-1 estimate at your 24.0% rate — not tax advice; consult a CPA.
Schools (NCES district)
- District
- Cattaraugus-Little Valley Central School District
- NCES district ID
- 3600024
- Math proficiency
- 42% ▼ -15.00%
- Reading proficiency
- 49% ▲ 3.00%
- Median HH income
- $45,623
- Composite
- 38.61/100
- National rank
- #4159
- State rank
- #460 of 590 in NY
Livability — Cattaraugus
- Score
- 60/100
- State rank
- #973
- US rank
- #19013
Category grades
Schools grade is shown separately in the Schools card above.
Census & demographics
- Population (ZIP)
- 3,334
Population outlook (Cattaraugus County) Hauer SSP2
- Today (2025)
- 71,623 people
- By 2030
- 67,751 · -5.4%
- By 2040
- 59,488 · -16.9%
- By 2050
- 51,601 · -28.0%
- By 2075
- 35,025 · -51.1%
- By 2100
- 21,243 · -70.3%
Race, ethnicity, and origin ACS 2023
- Neighborhood character
- Predominantly White (94%)
- Race & ethnicity
- White 94% Hispanic / Latino 3% Two or more races 3%
- Common ancestry
- Romanian 9% Lithuanian 2% Slovak 1%
- Foreign-born
- 1% · Canada
- Languages at home
- 96% English-only · German/W. Germanic 3% Spanish 1%
Political lean MEDSL · Cattaraugus
- 2024 margin
- Solid R (+32.8) · D 33.6% · R 66.4%
- 2008→2024 swing
- -22.2pp toward R · 2008: -10.6pp · 2024: -32.8pp
- All cycles
- 2024: R+32.8 2020: R+29.5 2016: R+34.4 2012: R+13.4 2008: R+10.6
Not yet ingested
- Civics
- —
Market trends
- HPI YoY
- ▲ 10.94%
- Current HPI
- 331.9433
- Rent YoY
- —
- Metro
- —
- State GDP YoY
- ▲ 2.60%
- F500 in state
- 92
Industry mix (Fortune 500 HQ in NY)
| Industry | F500 HQs | Revenue |
|---|---|---|
| Financial Services | 10 | $950B |
|
||
| Consumer Goods | 9 | $162B |
|
||
| Insurance | 4 | $225B |
|
||
| Telecommunications | 2 | $144B |
|
||
| Pharmaceuticals | 2 | $112B |
|
||
| Media / Entertainment | 2 | $69B |
|
||
Price history
1 event — show timeline
- 2026-05-25 Listed $149,900 WNYREIS
Cash-flow waterfall
monthlySold comps — $/sqft
last 12 mo · ≤1 miLoading sold comps…