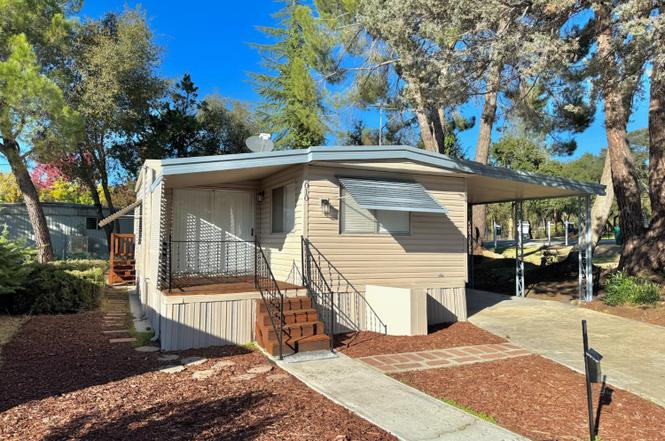
6010 Nob Hill Dr · Newcastle, CA
Flood risk 7/10 · Major
- FEMA flood zone
- X (unshaded)
- Chance of flooding over 30 yrs
- 0.99%
- Est. flood insurance / yr
- $507 – $1,088
Fire risk 10/10 · Severe
- Est. fire insurance / yr
- $659 – $1,223
Heat risk 6/10 · Moderate
- Hot days now (above 100°F)
- 6 days/yr
- Hot days in 30 yrs
- 14 days/yr
Wind risk 1/10 · Minimal
- Chance of severe wind over 30 yrs
- —
Air-quality risk 10/10 · Severe
- Unhealthy air days now
- 34 days/yr
- Unhealthy air days in 30 yrs
- 41 days/yr
Risk factors via First Street. Map © Google.
Why this score? — see what drove the B+ grade
The composite is a weighted blend of 9 inputs, each scored 0–100. Each bar is that input's sub-score; the figure is the points it added to the 100-point composite (weight × sub-score).
- Cash flow +30.0/30.0
- ARV discount +15.0/15.0
- 1% rule +10.0/10.0
- DSCR +10.0/10.0
- Schools +4.9/10.0
- Livability +2.8/5.0
- Rent growth +2.5/5.0
- Condition / age +2.5/5.0
- Appreciation +0.0/10.0
$109,950
🖨 Deal sheet (PDF) 📄 Offer letter ✓ Due diligence
Listing remarks
Nestled at 6010 Nob Hill Dr in the charming city of Newcastle, California, this inviting home is ready for you to move in and begin creating lasting memories. Imagine stepping into a kitchen designed for both culinary exploration and social gatherings, featuring sleek stone countertops that offer ample space for meal preparation, complemented by the classic elegance of shaker cabinets, providing a stylish and functional heart to the home. The bathroom offers a luxurious escape, with a tiled walk-in shower promising a spa-like experience every day. The property includes a sunroom, offering a bright and welcoming space to relax and enjoy the natural light, whatever the weather. Stepping outsi
Key facts
- Tiled walk-in shower
- Sunroom
- Shaker cabinets
Tags
Property features AI
Finance
- Other: Lot is not land-lease (land lease amount listed separately)
- HOA & community: No association; Senior community
Exterior
- Parking: Attached covered parking; Guest parking available
- Utilities: Public water; Public sewer; Natural gas connected; Cable available; Internet available; Electric service: Other
- Home design: Manufactured in park; Single wide; Built in 1971
- Construction: Composition roof; Vinyl skirting; Skyline (manufacturer)
- Exterior features: Corner lot
Interior
- Kitchen: Free standing gas range; Free standing gas oven; Free standing refrigerator; Hood over range; Dishwasher; Stone counters
- Bedrooms: 2 bedrooms
- Flooring: Carpet; Simulated wood
- Bathrooms: 1 full bathroom; Bathroom with tile finishes
- Heating & cooling: Central heating; Heat pump; Central cooling; Evaporative cooler
- Interior features: Accessible full bath; Accessible kitchen; Railed porch; Porch; Great room; Stone countertops; Dining space in kitchen; Pets allowed
- Laundry & utility: Washer included; Dryer included; Washer/dryer hookups inside
Neighborhood map
What this means for you Summary
Snapshot
- This is a 2-bed/1.0-bath manufactured listed at $110k.
Deal economics
- At list price, monthly cash flow is $1k ($14k/yr) — positive.
- The deal already cash-flows at list — no discount required.
- Meets the 1% rule at list price ($3k rent vs $110k).
- Recommended offer: $97k (12.0% below list) — sets the bar for market timing.
- Cap rate 19.8% vs local median 1.9% in Newcastle — top-decile yield for the area; either an underpriced asset or a hidden risk that comps aren't pricing in. Stress-test before assuming the spread holds.
Location & tenants
- Location reads 56/100 on livability (#792 in CA) — a working-class tenant base; expect higher turnover. Strengths: crime A+, employment A+, housing A+; Watch: amenities F, commute F, cost of living F.
- Placer Union High (suburban): math 39% / reading 72% proficiency, ranked #98 of 517 in CA (top 19%) — acceptable for families but not a draw, mixed tenant base, ~2y average lease.
- Market conditions: 56 active listings in the ZIP; 3,535 units permitted in Placer County in 2024 (689 in 5+ unit buildings).
Forward outlook
- Local home prices are declining (-3.0%/yr); year-one equity from $760 of loan paydown is wiped out by about $3k of value loss. Plan a longer hold.
- Placer County population projected at +20% by 2050 — long-run rental-demand tailwind backs the buy-and-hold thesis.
- At projected returns (-3.0% appreciation + 3.0% rent growth), your $31k cash investment doubles in ~3 years — after that, you're playing with house money.
Negotiation context
- It's been on market 227 days — a 12% lower offer ($97k) is reasonable based on typical stale-listing flexibility.
Risks & watch-outs
- Watch-outs: flood insurance adds $66/mo.
- Climate carrying-cost: major flood risk; severe wildfire risk; extreme-heat days projected 6→14/yr by 2055 (HVAC capex compounding) — expect insurance premiums to compound above CPI over the hold.
Questions for the listing agent
- It's been on market 227 days. Have you received any prior offers? Is the seller open to a 12% concession, seller financing, or rate buy-down credit?
- Built in 1971 — when were the roof, HVAC, electrical panel, plumbing, and water heater last replaced?
- What's the actual annual flood-insurance premium (NFIP or private), and is the property in a SFHA with mandatory coverage?
- Why hasn't it sold? Are there any deal-killer items the seller is aware of (foundation, flood, title, zoning, code violations)?
- Is there a deadline driving the sale (1031 exchange, divorce, estate, relocation)? That informs how much negotiation room exists.
- Schools are A-rated — typically a magnet for longer-tenancy family renters. What's the average tenant stay here, and is there a school-zone premium baked into asking?
- What's the average days-on-market for RENTAL listings here right now (not sales)? A rising rental-DOM trend means longer vacancies and softer asking-rent achievability than the comps imply.
- What's the recent tenant-quality profile in this submarket — average credit score on applications, eviction rate, late-payment / NSF rate, and stable-employment percentage? A property-management company in the area should have these aggregated.
- How much new for-sale + rental construction is in the pipeline within 1–3 miles? Heavy new supply typically softens prices + rents 12–24 months out; constrained supply supports both.
Investment metrics
- 1% rule
- 2.30% ✓
- Cap rate
- 19.78%
- Cash-on-cash
- 48.16%
- DSCR
- 3.14
- GRM
- 3.6
CMA / ARV
- ARV (on-the-fly)
- $145,800
- Comps found
- 6
Show comp detail 6 sales within ~0.75 mi
| Address | Dist | Beds/Ba | Sqft | Sold | Price | $/sf | Match |
|---|---|---|---|---|---|---|---|
| 6052 Chad | 0.05mi | 2/2.0 | 1,040 (-4%) | 7mo | $138,000 | $133 | 82 |
| 6170 Nob Hill Dr | 0.13mi | 3/2.0 (+1) | 1,065 (-1%) | 2mo | $195,000 | $183 | 81 |
| 6100 Nob Hill Dr #137 | 0.08mi | 2/2.0 | 1,100 (+2%) | 17mo | $80,500 | $73 | 75 |
| 6074 Coleman Dr | 0.11mi | 2/2.0 | 1,180 (+9%) | 3mo | $185,000 | $157 | 73 |
| 1755 Sunset Dr | 0.20mi | 2/2.0 | 1,200 (+11%) | 14mo | $130,000 | $108 | 56 |
| 6556 Crest Dr | 0.31mi | 2/2.0 | 1,200 (+11%) | 22mo | $162,500 | $135 | 45 |
Match score weights: distance 35% · size 25% · config 20% · recency 20%. Top-matched comps best support the ARV.
Projected returns pro-forma
-3.0% appreciation · 3.0% rent growth · sell at horizon
- IRR
- 42.8%
- Equity multiple
- 2.84×
- Total profit
- $56,729
- Equity at exit
- $16,394
- IRR
- 48.9%
- Equity multiple
- 5.73×
- Total profit
- $145,607
- Equity at exit
- $9,506
Cash invested: $30,786 (down + closing). Projections, not guarantees.
Landlord ↔ Tenant lean methodology
- Overall (STATE)
- 18 Strongly Tenant-Friendly
- State California
- 18 Strongly Tenant-Friendly · D+13
- County
- — inherits STATE
- City
- — inherits STATE
ZIP-level market 95658
- Active inventory
- 56
- Price-to-rent
- 3.6×
Monthly cashflow live
- Estimated rent
- $2,526 medium interval (Pro) →
- Mortgage (P&I)
- −$577
- Tax est. 1.5%
- −$137 /mo · $1,649/yr
- Insurance
- −$46
- Flood insurance flood zone
- −$66 /mo · $798/yr
- HOA
- −$0
- Vacancy / Maint / Mgmt
- −$530
- Net cashflow
- $1,169
Break-even live
Sensitivity live
| Price | -10% $1,245 | -5% $1,207 | +0% $1,169 | +5% $1,131 | +10% $1,093 |
|---|---|---|---|---|---|
| Rent | -10% $970 | -5% $1,069 | +0% $1,169 | +5% $1,269 | +10% $1,369 |
| Rate | -1.0pp $1,225 | -0.5pp $1,197 | base $1,169 | +0.5pp $1,141 | +1.0pp $1,112 |
UW: 25.0% down · 7.5% · 30yr · 1.5% tax · 5.0% vac · 8.0% maint · 8.0% mgmt
Financing live
Cash to close
- Down payment
- $27,488
- Closing costs
- $3,298
- Reserves months
- —
- Total cash needed
- —
Loan-product check · same deal, 3 products live
Conventional
25% down · 7.5% · 30yr
- Down + closing
- —
- Monthly P&I
- —
- Monthly cashflow
- —
- DSCR
- —
- Eligible?
- —
Personal DTI + credit; lowest rate.
DSCR
20% down · 8.5% · 30yr
- Down + closing
- —
- Monthly P&I
- —
- Monthly cashflow
- —
- DSCR
- —
- Eligible?
- —
No personal income docs; deal must DSCR.
Hard money
10% down · 12.0% · 12mo
- Down + closing
- —
- Monthly P&I
- —
- Monthly cashflow
- —
- DSCR
- —
- Eligible?
- —
Short-term bridge; refi at stabilization.
Listing history 15 events
-
2026-06-21days on market $109,950 Active 227 DOM
-
2026-06-18days on market $109,950 Active 224 DOM
-
2026-06-17days on market $109,950 Active 223 DOM
-
2026-06-16days on market $109,950 Active 222 DOM
-
2026-06-15days on market $109,950 Active 221 DOM
-
2026-06-13days on market $109,950 Active 219 DOM
-
2026-06-13days on market $109,950 Active 218 DOM
-
2026-06-09days on market $109,950 Active 215 DOM
-
2026-06-08days on market $109,950 Active 214 DOM
-
2026-06-07days on market $109,950 Active 213 DOM
-
2026-06-03days on market $109,950 Active 209 DOM
-
2026-06-02days on market $109,950 Active 208 DOM
-
2026-06-01days on market $109,950 Active 207 DOM
-
2026-06-01price $109,950 Active 206 DOM
-
2026-05-31days on market $125,000 Active 206 DOM
ⓘ Source: listings_history table (triggers on properties + properties_extension) + one-shot
backfill from property_details.listing_events for pre-trigger history.
Climate risk First Street
- Flood 7/10 Severe FEMA zone X (unshaded) · 99% chance over 30 yrs
- Wildfire 10/10 Extreme
- Heat 6/10 Major 6 d/yr ≥100°F today · 14 d/yr by 30 yrs out
- Wind 1/10 Low
- Air quality 10/10 Extreme 34 unhealthy d/yr today · 41 by 30 yrs out
Nearby sold comps map
Loading sold comps map…
Walkable amenities ~0.75 mi
Loading nearby amenities…
Taxation est. · year 1
- Rental income
- $30,311
- − Mortgage interest
- −$6,159
- − Property taxes
- −$1,649
- − Insurance
- −$1,347
- − Repairs & maintenance
- −$2,425
- − Management
- −$2,425
- − Depreciation
- −$3,199
- Taxable income
- $13,108
- Est. tax owed @ 24.0%
- −$3,146
- After-tax cash flow
- $10,885/yr
For passive investors: Depreciation is non-cash, so a rental often shows a tax loss while cash-flowing — sheltering income. Rental losses are passive: they offset passive income freely, and up to $25,000/yr can offset ordinary (W-2) income if you actively participate and your MAGI is under $100k (phasing out to $0 by $150k); unused losses carry forward. On sale, claimed depreciation is recaptured at up to 25%, and gains may owe capital-gains tax (a 1031 exchange can defer both). Figures are a year-1 estimate at your 24.0% rate — not tax advice; consult a CPA.
Schools (NCES district)
- District
- Placer Union High
- NCES district ID
- 0630750
- Math proficiency
- 39% ▲ 1.00%
- Reading proficiency
- 72% ▲ 3.00%
- Median HH income
- $69,119
- Composite
- 49.04/100
- National rank
- #2060
- State rank
- #98 of 517 in CA
Livability — Newcastle
- Score
- 56/100
- State rank
- #792
- US rank
- #22660
Category grades
Schools grade is shown separately in the Schools card above.
Census & demographics
- Census place
- Newcastle, CA
- Population (ZIP)
- 6,197
Population outlook (Placer County) Hauer SSP2
- Today (2025)
- 422,709 people
- By 2030
- 444,249 · +5.1%
- By 2040
- 480,192 · +13.6%
- By 2050
- 506,390 · +19.8%
- By 2075
- 550,219 · +30.2%
- By 2100
- 547,760 · +29.6%
Race, ethnicity, and origin ACS 2023
- Neighborhood character
- Predominantly White (80%)
- Race & ethnicity
- White 80% Hispanic / Latino 9% Two or more races 7% Black 3% Native American 2% Asian 1%
- Hispanic origin (detail)
- Mexican 8%
- Common ancestry
- Italian 5% Slovak 4% Russian 3%
- Foreign-born
- 4% · Canada
- Languages at home
- 93% English-only · German/W. Germanic 2% Spanish 1% Other Asian/Pacific 1%
Political lean MEDSL · Placer
- 2024 margin
- Lean R (+8.5) · D 44.3% · R 52.8% · Other 2.9%
- 2008→2024 swing
- +2.8pp toward D · 2008: -11.3pp · 2024: -8.5pp
- All cycles
- 2024: R+8.5 2020: R+6.7 2016: R+11.3 2012: R+20.1 2008: R+11.3
Not yet ingested
- Civics
- —
Market trends
- HPI YoY
- ▼ -292.40%
- Current HPI
- 288.3247
- Rent YoY
- —
- Metro
- —
- State GDP YoY
- ▲ 3.21%
- F500 in state
- 116
Industry mix (Fortune 500 HQ in CA)
| Industry | F500 HQs | Revenue |
|---|---|---|
| Technology | 27 | $1,492B |
|
||
| Financial Services | 3 | $174B |
|
||
| Retail | 3 | $44B |
|
||
| Insurance | 3 | $26B |
|
||
| Media / Entertainment | 2 | $115B |
|
||
| Pharmaceuticals / Biotech | 2 | $62B |
|
||
Cash-flow waterfall
monthlySold comps — $/sqft
last 12 mo · ≤1 miLoading sold comps…