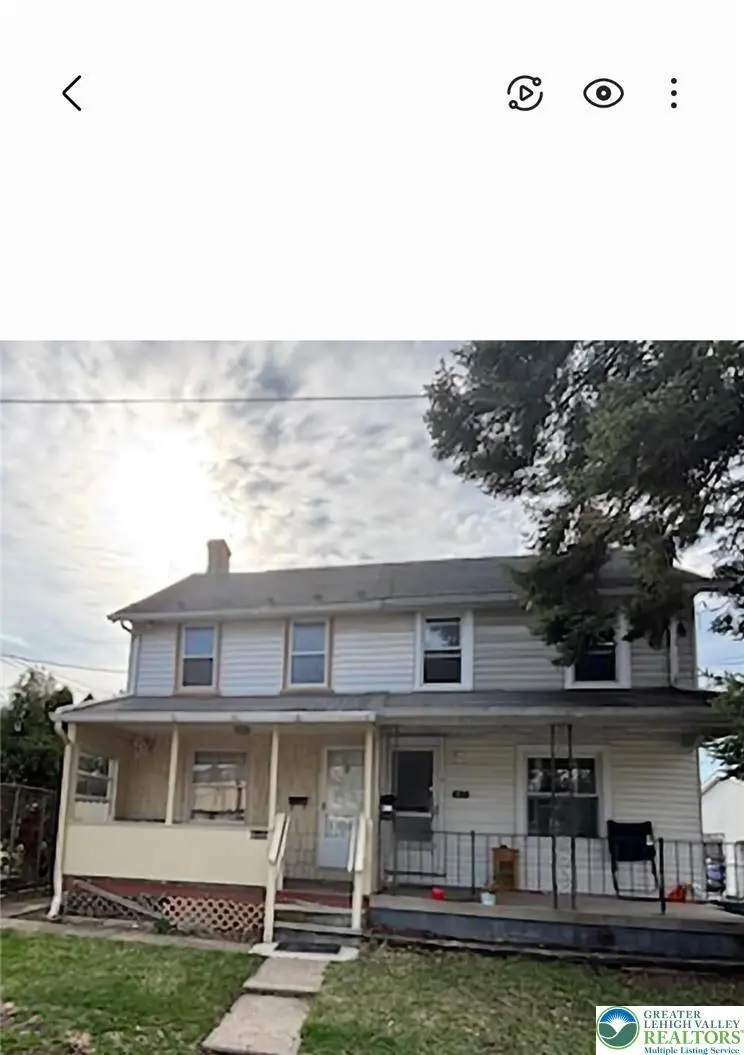
810 Reed St · Allentown, PA
Flood risk 1/10 · Minimal
- FEMA flood zone
- X (unshaded)
- Chance of flooding over 30 yrs
- 0.0%
- Est. flood insurance / yr
- $473 – $860
Fire risk 3/10 · Minor
- Est. fire insurance / yr
- $511 – $949
Heat risk 5/10 · Moderate
- Hot days now (above 100°F)
- 7 days/yr
- Hot days in 30 yrs
- 15 days/yr
Wind risk 4/10 · Minor
- Chance of severe wind over 30 yrs
- 15.0%
Air-quality risk 4/10 · Minor
- Unhealthy air days now
- 3 days/yr
- Unhealthy air days in 30 yrs
- 6 days/yr
Risk factors via First Street. Map © Google.
Why this score? — see what drove the C grade
The composite is a weighted blend of 9 inputs, each scored 0–100. Each bar is that input's sub-score; the figure is the points it added to the 100-point composite (weight × sub-score).
- Cash flow +19.5/30.0
- ARV discount +15.0/15.0
- DSCR +6.2/10.0
- 1% rule +5.0/10.0
- Rent growth +4.1/5.0
- Livability +4.0/5.0
- Condition / age +2.5/5.0
- Schools +1.2/10.0
- Appreciation +0.0/10.0
$184,900
🖨 Deal sheet 📄 Offer letter ✓ Due diligence
Listing remarks MLS
Well maintained single-Family, Twin house located on the east side of Allentown, just minutes away from Bethlehem. Conveniently situated close to major highways, shopping centers, and local amenities. This home features a large backyard with utility shed. Rear parking spaces with carport. Enjoy relaxing on the covered front porch. The main level offers a large family room, providing plenty of space for gathering and everyday living. The fenced backyard includes side access, adding both privacy and functionality. Property is being sold as-is, providing an opportunity for buyers who are looking to add their personal touch. Access to carport parking in the back of the property is from the alley.
Key facts
- Covered front porch
- Large family room
- Utility shed
Tags
Neighborhood map
What this means for you Summary
Snapshot
- This is a 3-bed/1.0-bath single-family listed at $185k.
Deal economics
- At list price, monthly cash flow is $211 ($3k/yr) — positive.
- The deal already cash-flows at list — no discount required.
- To meet the 1% rule (rent ≥ 1% of price), the offer needs to be $185k (0.0% below list).
- Recommended offer: $179k (3.0% below list) — sets the bar for market timing.
- Cap rate 7.7% vs local median 5.3% in Allentown — top-decile yield for the area; either an underpriced asset or a hidden risk that comps aren't pricing in. Stress-test before assuming the spread holds.
Location & tenants
- Location reads 81/100 on livability (#171 in PA, #1,440 nationally) — a professional / high-income tenant draw. Strengths: commute A+, cost of living A+, housing A+; Watch: schools D+, employment D.
- Allentown City SD (urban): math 10% / reading 20% proficiency, ranked #513 of 539 in PA (top 95%) — low school quality limits family demand, transient renter base, plan for 1-2y turnover; 73% free/reduced lunch — lower-income household profile, screen leases tightly.
- Market conditions: Rents rising fast (+6.6%/yr); 58 active listings in the ZIP; 12 comparable units currently listed for rent nearby; rentals leasing fast (median 3d on market — plan ~1-2 weeks tenant-placement turnaround); 765 units permitted in Lehigh County in 2024 (286 in 5+ unit buildings).
- This rent runs 38% of the median local income ($58k/yr) — at the standard rent-burdened threshold; future hikes will face affordability resistance.
Forward outlook
- Local home prices are declining (-3.0%/yr); year-one equity from $1k of loan paydown is wiped out by about $6k of value loss. Plan a longer hold.
- Lehigh County population projected at +21% by 2050 — long-run rental-demand tailwind backs the buy-and-hold thesis.
- At projected returns (-3.0% appreciation + 6.6% rent growth), your $52k cash investment doubles in ~10 years — after that, you're playing with house money.
Negotiation context
- It's been on market 45 days — a 3% lower offer ($179k) is reasonable based on typical stale-listing flexibility.
- 5 sale attempts since 24y ago; this cycle's ask has dropped $15k (8%) from the opening price — seller is motivated, your offer sets the floor, not the list.
- Current owner paid $55k; list at $185k implies a 236% gain — meaningful room to come down on a strong offer.
Risks & watch-outs
- Watch-outs: built in 1910 — expect roof / HVAC / electrical / plumbing capex.
- Climate carrying-cost: extreme-heat days projected 7→15/yr by 2055 (HVAC capex compounding) — expect insurance premiums to compound above CPI over the hold.
Questions for the listing agent
- It's been on market 45 days. Have you received any prior offers? Is the seller open to a 3% concession, seller financing, or rate buy-down credit?
- Built in 1910 — when were the roof, HVAC, electrical panel, plumbing, and water heater last replaced?
- Is there a deadline driving the sale (1031 exchange, divorce, estate, relocation)? That informs how much negotiation room exists.
- Schools are D-rated, which usually means shorter tenancies and higher turnover. Who's the typical renter profile here, and what's been the actual vacancy rate?
- What's the average days-on-market for RENTAL listings here right now (not sales)? A rising rental-DOM trend means longer vacancies and softer asking-rent achievability than the comps imply.
- What's the recent tenant-quality profile in this submarket — average credit score on applications, eviction rate, late-payment / NSF rate, and stable-employment percentage? A property-management company in the area should have these aggregated.
- How much new for-sale + rental construction is in the pipeline within 1–3 miles? Heavy new supply typically softens prices + rents 12–24 months out; constrained supply supports both.
Investment metrics
- 1% rule
- 1.00% ✗
- Cap rate
- 7.66%
- Cash-on-cash
- 4.89%
- DSCR
- 1.22
- GRM
- 8.3
CMA / ARV
- ARV (median comp)
- $229,752
- List price
- $184,900
- Delta
- -19.52%
- Verdict
- UNDERPRICED
- Comps
- 20 within 1.0 mi
Show comp detail 12 sales within ~0.75 mi
| Address | Dist | Beds/Ba | Sqft | Sold | Price | $/sf | Match |
|---|---|---|---|---|---|---|---|
| 1813 E Cedar St | 0.11mi | 3/2.0 | 972 (-2%) | 17mo | $280,000 | $288 | 74 |
| 847 Oswego St | 0.26mi | 3/1.0 | 1,040 (+5%) | 14mo | $285,000 | $274 | 68 |
| 1909 E Keats St | 0.26mi | 3/1.5 | 1,066 (+8%) | 7mo | $300,000 | $281 | 67 |
| 1103 N Van Buren St | 0.50mi | 3/1.0 | 1,048 (+6%) | 11mo | $230,300 | $220 | 58 |
| 453 N Oswego St | 0.36mi | 3/1.5 | 1,064 (+8%) | 14mo | $299,000 | $281 | 57 |
| 1158 E Congress St | 0.62mi | 3/1.0 | 950 (-4%) | 11mo | $235,000 | $247 | 55 |
| 1903 E Jonathan St | 0.69mi | 3/1.0 | 1,001 (+1%) | 19mo | $300,000 | $300 | 50 |
| 1511 E Highland St | 0.47mi | 3/1.0 | 1,120 (+13%) | 10mo | $285,000 | $254 | 48 |
| 1924 E Congress St | 0.44mi | 3/1.0 | 864 (-13%) | 18mo | $230,000 | $266 | 43 |
| 1519 E Highland St | 0.46mi | 3/1.5 | 1,120 (+13%) | 18mo | $245,000 | $219 | 39 |
| 813 N Kiowa St | 0.49mi | 4/1.0 (+1) | 1,125 (+14%) | 15mo | $270,000 | $240 | 37 |
| 1019 E Hamilton St | 0.72mi | 2/2.0 (-1) | 1,080 (+9%) | 19mo | $270,000 | $250 | 26 |
Match score weights: distance 35% · size 25% · config 20% · recency 20%. Top-matched comps best support the ARV.
Projected returns pro-forma
-3.0% appreciation · 6.57% rent growth · sell at horizon
- IRR
- -4.8%
- Equity multiple
- 0.81×
- Total profit
- $-9,645
- Equity at exit
- $27,569
- IRR
- 8.6%
- Equity multiple
- 1.76×
- Total profit
- $39,314
- Equity at exit
- $15,987
Cash invested: $51,772 (down + closing). Projections, not guarantees.
Landlord ↔ Tenant lean methodology
- Overall (STATE)
- 62 Landlord-Friendly
- State Pennsylvania
- 62 Landlord-Friendly · EVEN
- County
- — inherits STATE
- City
- — inherits STATE
ZIP-level market 18109
- Home prices YoY
- -21.9%
- Rents YoY
- 6.6%
- Active inventory
- 58
- Price-to-rent
- 8.3×
Monthly cashflow live
- Estimated rent
- $1,849 high interval (Pro) →
- Mortgage (P&I)
- −$970
- Tax from tax record
- −$203 /mo · $2,435/yr
- Insurance
- −$77
- HOA
- −$0
- Vacancy / Maint / Mgmt
- −$388
- Net cashflow
- $211
Break-even live
UW: 25.0% down · 7.5% · 30yr · 1.5% tax · 5.0% vac · 8.0% maint · 8.0% mgmt
Financing live
Cash to close
- Down payment
- $46,225
- Closing costs
- $5,547
- Reserves months
- —
- Total cash needed
- —
Loan-product check · same deal, 3 products live
Conventional
25% down · 7.5% · 30yr
- Down + closing
- —
- Monthly P&I
- —
- Monthly cashflow
- —
- DSCR
- —
- Eligible?
- —
Personal DTI + credit; lowest rate.
DSCR
20% down · 8.5% · 30yr
- Down + closing
- —
- Monthly P&I
- —
- Monthly cashflow
- —
- DSCR
- —
- Eligible?
- —
No personal income docs; deal must DSCR.
Hard money
10% down · 12.0% · 12mo
- Down + closing
- —
- Monthly P&I
- —
- Monthly cashflow
- —
- DSCR
- —
- Eligible?
- —
Short-term bridge; refi at stabilization.
Rent comps 12 comps
| Address | Beds | Baths | Sqft | Rent | $/sqft | DOM | Units | Dist |
|---|---|---|---|---|---|---|---|---|
| 1207 E Congress St Allentown, PA | 1.0–2.0 | 1.0–1.5 | 749 | $1,745 | $2.33 | 2d | 43 | 0.66mi |
| 949 E Linden St Allentown, PA | 2.0 | 2.0 | 880 | $1,795 | $2.04 | 14d | 1 | 0.77mi |
| 801-819 N Halstead St Allentown, PA | 2.0 | 2.0 | 995 | $1,795 | $1.80 | 43d | 1 | 0.82mi |
| 801 N Halstead St Allentown, PA | 1.0–2.0 | 1.0–2.0 | 872 | $1,795 | $2.06 | 2d | 1 | 0.82mi |
| 817 E Turner St Allentown, PA | 2.0 | 1.0 | 850 | $1,795 | $2.11 | 2d | 1 | 0.89mi |
| 2010B Pinehurst Ct Allentown, PA | 1.0–2.0 | 1.0 | 844 | $1,850 | $2.19 | 2d | 6 | 0.99mi |
| 967 Stratford St Bethlehem, PA | 3.0 | 1.0 | 938 | $850 | $0.91 | 43d | 1 | 1.15mi |
| 501 E Walnut St Allentown, PA | 2.0 | 2.0 | 850 | $1,795 | $2.11 | 2d | 1 | 1.23mi |
| 333 River Dr Allentown, PA | 1.0–2.0 | 1.0–2.0 | 869 | $2,025 | $2.33 | 2d | 13 | 1.36mi |
| 2132 Pennsylvania Ave Unit 00 B- 7 Bethlehem, PA | 2.0 | 1.0 | 956 | $1,695 | $1.77 | 14d | 1 | 1.38mi |
| 303 E Union St Unit 1st Allentown, PA | 2.0 | 1.0 | 977 | $1,550 | $1.59 | 43d | 1 | 1.40mi |
| 2252 Catasauqua Rd Bethlehem, PA | 1.0–2.0 | 1.0 | 767 | $1,829 | $2.38 | 2d | 22 | 1.45mi |
Listing history 14 events
-
2026-05-08status Pending 701-char remark
Show marketing remark (701 chars)
Well maintained single-Family, Twin house located on the east side of Allentown, just minutes away from Bethlehem. Conveniently situated close to major highways, shopping centers, and local amenities. This home features a large backyard with utility shed. Rear parking spaces with carport. Enjoy relaxing on the covered front porch. The main level offers a large family room, providing plenty of space for gathering and everyday living. The fenced backyard includes side access, adding both privacy and functionality. Property is being sold as-is, providing an opportunity for buyers who are looking to add their personal touch. Access to carport parking in the back of the property is from the alley.
-
2026-04-30price $184,900 701-char remark
Show marketing remark (701 chars)
Well maintained single-Family, Twin house located on the east side of Allentown, just minutes away from Bethlehem. Conveniently situated close to major highways, shopping centers, and local amenities. This home features a large backyard with utility shed. Rear parking spaces with carport. Enjoy relaxing on the covered front porch. The main level offers a large family room, providing plenty of space for gathering and everyday living. The fenced backyard includes side access, adding both privacy and functionality. Property is being sold as-is, providing an opportunity for buyers who are looking to add their personal touch. Access to carport parking in the back of the property is from the alley.
-
2026-04-13price $189,900 701-char remark
Show marketing remark (701 chars)
Well maintained single-Family, Twin house located on the east side of Allentown, just minutes away from Bethlehem. Conveniently situated close to major highways, shopping centers, and local amenities. This home features a large backyard with utility shed. Rear parking spaces with carport. Enjoy relaxing on the covered front porch. The main level offers a large family room, providing plenty of space for gathering and everyday living. The fenced backyard includes side access, adding both privacy and functionality. Property is being sold as-is, providing an opportunity for buyers who are looking to add their personal touch. Access to carport parking in the back of the property is from the alley.
-
2026-03-31price $194,900 701-char remark
Show marketing remark (701 chars)
Well maintained single-Family, Twin house located on the east side of Allentown, just minutes away from Bethlehem. Conveniently situated close to major highways, shopping centers, and local amenities. This home features a large backyard with utility shed. Rear parking spaces with carport. Enjoy relaxing on the covered front porch. The main level offers a large family room, providing plenty of space for gathering and everyday living. The fenced backyard includes side access, adding both privacy and functionality. Property is being sold as-is, providing an opportunity for buyers who are looking to add their personal touch. Access to carport parking in the back of the property is from the alley.
-
2026-03-23$199,900 Active 701-char remark
Show marketing remark (701 chars)
Well maintained single-Family, Twin house located on the east side of Allentown, just minutes away from Bethlehem. Conveniently situated close to major highways, shopping centers, and local amenities. This home features a large backyard with utility shed. Rear parking spaces with carport. Enjoy relaxing on the covered front porch. The main level offers a large family room, providing plenty of space for gathering and everyday living. The fenced backyard includes side access, adding both privacy and functionality. Property is being sold as-is, providing an opportunity for buyers who are looking to add their personal touch. Access to carport parking in the back of the property is from the alley.
-
2014-10-16soldstatus $55,000
-
2014-10-09soldstatus $55,000 86-char remark
Show marketing remark (86 chars)
Great Location - Only minutes from downtown Bethlehem and Allentown. Being sold As-Is.
-
2014-10-09soldstatus $55,000
Show marketing remark (86 chars)
Great Location - Only minutes from downtown Bethlehem and Allentown. Being sold As-Is.
-
2014-08-16$65,000 86-char remark
Show marketing remark (86 chars)
Great Location - Only minutes from downtown Bethlehem and Allentown. Being sold As-Is.
-
2014-08-16$65,000
Show marketing remark (86 chars)
Great Location - Only minutes from downtown Bethlehem and Allentown. Being sold As-Is.
-
2003-03-01historical
-
2003-01-15$53,000
-
2002-12-01historical
-
2002-03-06$53,000
ⓘ Source: listings_history table (triggers on properties + properties_extension) + one-shot
backfill from property_details.listing_events for pre-trigger history.
Tax reassessment forecast PA · Partial reset (capped growth)
- Current annual tax
- $2,435 · $203/mo
- Projected year-2 tax
- $2,678 · $223/mo
- Expected delta
- +$243/yr (+$20/mo · 10.0%)
ⓘ Screening estimate from a state-policy table — verify with the county assessor before closing.
Climate risk First Street
- Flood 1/10 Low FEMA zone X (unshaded) · 0% chance over 30 yrs
- Wildfire 3/10 Moderate
- Heat 5/10 Major 7 d/yr ≥100°F today · 15 d/yr by 30 yrs out
- Wind 4/10 Moderate 15% chance of damaging wind over 30 yrs
- Air quality 4/10 Moderate 3 unhealthy d/yr today · 6 by 30 yrs out
Nearby sold comps map
Loading sold comps map…
Walkable amenities ~0.75 mi
Loading nearby amenities…
Taxation est. · year 1
- Rental income
- $22,184
- − Mortgage interest
- −$10,357
- − Property taxes
- −$2,435
- − Insurance
- −$924
- − Repairs & maintenance
- −$1,775
- − Management
- −$1,775
- − Depreciation
- −$5,379
- Taxable loss
- −$461
- Est. tax savings @ 24.0%
- +$111
- After-tax cash flow
- $2,641/yr
For passive investors: Depreciation is non-cash, so a rental often shows a tax loss while cash-flowing — sheltering income. Rental losses are passive: they offset passive income freely, and up to $25,000/yr can offset ordinary (W-2) income if you actively participate and your MAGI is under $100k (phasing out to $0 by $150k); unused losses carry forward. On sale, claimed depreciation is recaptured at up to 25%, and gains may owe capital-gains tax (a 1031 exchange can defer both). Figures are a year-1 estimate at your 24.0% rate — not tax advice; consult a CPA.
Schools (NCES district)
- District
- Allentown City SD
- NCES district ID
- 4202280
- Math proficiency
- 10% ▼ -10.00%
- Reading proficiency
- 20% ▼ -15.00%
- Median HH income
- $36,337
- Composite
- 12.43/100
- National rank
- #9630
- State rank
- #513 of 539 in PA
Livability — Allentown
- Score
- 81/100
- State rank
- #171
- US rank
- #1440
Category grades
Schools grade is shown separately in the Schools card above.
Census & demographics
- Census place
- Allentown, PA
- County
- Lehigh County · 333,019 people
- City population
- 172,996
- Metro
- Allentown-Bethlehem-Easton, PA-NJ
- Population (ZIP)
- 18,446
- Household income
- $58,031
- Rent vs Own
- Severe rent burden
- 898.0
Population outlook (Lehigh County) Hauer SSP2
- Today (2025)
- 392,957 people
- By 2030
- 408,319 · +3.9%
- By 2040
- 440,007 · +12.0%
- By 2050
- 475,940 · +21.1%
- By 2075
- 590,448 · +50.3%
- By 2100
- 690,314 · +75.7%
Race, ethnicity, and origin ACS 2023
- Neighborhood character
- Diverse neighborhood (Simpson 0.59)
- Race & ethnicity
- Hispanic / Latino 55% White 33% Two or more races 15% Black 8% Asian 2%
- Hispanic origin (detail)
- Mexican 1% Puerto Rican 27% Cuban 1% Dominican 18%
- Common ancestry
- Hispanic 2% Romanian 1% Polish 1%
- Foreign-born
- 22% · Canada, Jamaica
- Languages at home
- 53% English-only · Spanish 37% Arabic 6% French/Haitian/Cajun 2%
Political lean MEDSL · Lehigh
- 2024 margin
- Toss-up / Even · D 50.7% · R 48.0% · Other 1.2%
- 2008→2024 swing
- -12.9pp toward R · 2008: 15.6pp · 2024: 2.7pp
- All cycles
- 2024: D+2.7 2020: D+7.6 2016: D+4.4 2012: D+7.5 2008: D+15.6
Not yet ingested
- Civics
- —
Market trends
- HPI YoY
- ▼ -96.00%
- Current HPI
- 342.9027
- Rent YoY
- ▲ 6.57%
- Metro
- Allentown-Bethlehem-Easton, PA-NJ
- State GDP YoY
- ▲ 1.68%
- F500 in state
- 34
Industry mix (Fortune 500 HQ in PA)
| Industry | F500 HQs | Revenue |
|---|---|---|
| Healthcare | 2 | $309B |
|
||
| Insurance | 2 | $27B |
|
||
| Telecommunications / Media | 1 | $124B |
|
||
| Industrial Distribution | 1 | $22B |
|
||
| Financial Services | 1 | $20B |
|
||
| Chemicals / Materials | 1 | $18B |
|
||
Price history
+248.9% since first listed14 events — show timeline
- 2026-05-08 Pending — GLVRMLS
- 2026-04-30 Price Changed $184,900 GLVRMLS
- 2026-04-13 Price Changed $189,900 GLVRMLS
- 2026-03-31 Price Changed $194,900 GLVRMLS
- 2026-03-23 Listed $199,900 GLVRMLS
- 2014-10-16 Sold (Public Records) $55,000 Public Records
- 2014-10-09 Sold (MLS) $55,000 GLVRMLS
- 2014-10-09 Sold (MLS) $55,000 GLVRMLS
- 2014-08-16 Listed $65,000 GLVRMLS
- 2014-08-16 Listed $65,000 GLVRMLS
- 2003-03-01 Listing Removed — GLVRMLS
- 2003-01-15 Listed $53,000 GLVRMLS
- 2002-12-01 Listing Removed — GLVRMLS
- 2002-03-06 Listed $53,000 GLVRMLS
Property tax history
-1.6%/yrLatest (2026): $2,435 · +0.9% YoY. Source: county tax records.
Cash-flow waterfall
monthlySold comps — $/sqft
last 12 mo · ≤1 miLoading sold comps…