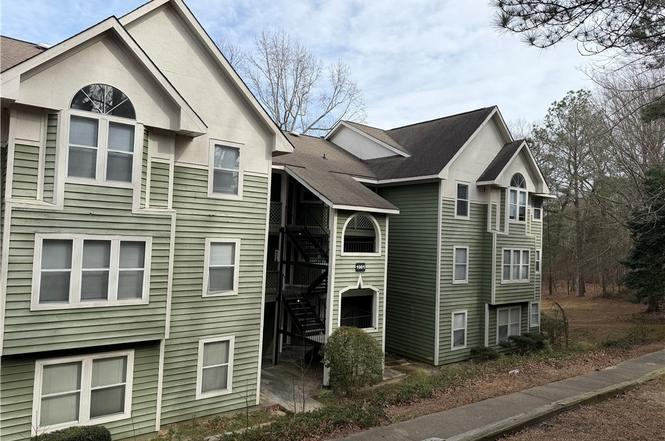
1001 Brookhollow Dr #2 · Fayetteville, NC
Flood risk 7/10 · Major
- FEMA flood zone
- X (unshaded)
- Chance of flooding over 30 yrs
- 0.76%
- Est. flood insurance / yr
- $507 – $1,088
Fire risk 4/10 · Minor
- Est. fire insurance / yr
- $906 – $1,684
Heat risk 7/10 · Major
- Hot days now (above 106°F)
- 7 days/yr
- Hot days in 30 yrs
- 16 days/yr
Wind risk 7/10 · Major
- Chance of severe wind over 30 yrs
- 75.0%
Air-quality risk 2/10 · Minimal
- Unhealthy air days now
- 0 days/yr
- Unhealthy air days in 30 yrs
- 1 days/yr
Risk factors via First Street. Map © Google.
Why this score? — see what drove the B grade
The composite is a weighted blend of 9 inputs, each scored 0–100. Each bar is that input's sub-score; the figure is the points it added to the 100-point composite (weight × sub-score).
- Cash flow +30.0/30.0
- 1% rule +10.0/10.0
- DSCR +10.0/10.0
- ARV discount +7.5/15.0
- Livability +3.8/5.0
- Rent growth +3.3/5.0
- Schools +3.1/10.0
- Condition / age +2.5/5.0
- Appreciation +0.0/10.0
$80,000
🖨 Deal sheet 📄 Offer letter ✓ Due diligence
Listing remarks
* Investor special * This charming 2-bedroom, 2-bathroom ground floor condo is centrally located, offering easy access to Fort Bragg and nearby shopping. Perfect for anyone looking for convenience and comfort, with a spacious layout and all the essentials. Don’t miss out on this prime location and affordable living! Home has current tenant under lease through September 2026 ($1000/mo) who would like to stay as she has lived there for years now. Great chance to grow your rental portfolio and grab a home with a great long lasting tenant. * * * Pool is currently Closed * * *
Key facts
- Ground floor condo
- Nearby shopping
- $174 HOA
Tags
Property features AI
Finance
- HOA & community: Homeowners association with a monthly fee of $174.06 covering grounds maintenance
Exterior
- Parking: No garage
- Utilities: Public water; Public sewer
- Home design: Residential condominium
- Construction: Wood siding
- Exterior features: Paved road access; Subdivision: STEWARTS CREEK GREEN
Interior
- Kitchen: Dishwasher; Microwave; Range
- Bedrooms: No bedroom level information provided
- Flooring: Carpet; Vinyl
- Bathrooms: 2 full bathrooms
- Heating & cooling: Heat pump heating; Central air conditioning
- Interior features: Ceiling fans; Walk-in closets; Masonry fireplace (1)
- Laundry & utility: Washer hookup
Neighborhood map
What this means for you Summary
Snapshot
- This is a 2-bed/3.0-bath condo listed at $80k.
Deal economics
- At list price, monthly cash flow is $250 ($3k/yr) — positive.
- The deal already cash-flows at list — no discount required.
- Meets the 1% rule at list price ($1k rent vs $80k).
- Recommended offer: $70k (12.0% below list) — sets the bar for market timing.
- Cap rate 11.0% vs local median 4.9% in Fayetteville — top-decile yield for the area; either an underpriced asset or a hidden risk that comps aren't pricing in. Stress-test before assuming the spread holds.
Location & tenants
- Location reads 75/100 on livability (#45 in NC, #4,031 nationally) — a middle-class / working-renter tenant base. Strengths: commute A+, cost of living A+, housing A+; Watch: crime F, employment D-.
- Cumberland County Schools (urban): math 32% / reading 41% proficiency, ranked #126 of 178 in NC (top 71%) — families likely to look elsewhere, expect single-tenant / working-renter base with shorter leases.
- Zoned schools: Westover Middle (math 20% / reading 30%, grade F, #396 of 475 statewide, top 84%, 784 students, 100% FRL); Westover High (math 42% / reading 39%, grade F, #387 of 535 statewide, top 73%, 1,202 students, 100% FRL) — zoned schools average 100% FRL vs 55% district-wide (45 pts higher); higher-poverty schools than district average — tighter screening recommended.
- Market conditions: Rents rising (+3.1%/yr); 429 active listings in the ZIP; 40 comparable units currently listed for rent nearby; rentals at typical pace (median 21d on market — plan ~3-4 weeks tenant-placement turnaround); 1,125 units permitted in Cumberland County in 2024 (104 in 5+ unit buildings).
Forward outlook
- Local home prices are declining (-3.0%/yr); year-one equity from $553 of loan paydown is wiped out by about $2k of value loss. Plan a longer hold.
- At projected returns (-3.0% appreciation + 3.1% rent growth), your $22k cash investment doubles in ~9 years — after that, you're playing with house money.
Negotiation context
- It's been on market 126 days — a 12% lower offer ($70k) is reasonable based on typical stale-listing flexibility.
- 2 sale attempts; this cycle's ask has dropped $5k (6%) from the opening price — seller is motivated, your offer sets the floor, not the list.
- Current owner paid $28k; list at $80k implies a 191% gain — meaningful room to come down on a strong offer.
Risks & watch-outs
- Watch-outs: flood insurance adds $66/mo.
- Climate carrying-cost: major flood risk; major wind risk, 75% chance of damaging wind over 30y; extreme-heat days projected 7→16/yr by 2055 (HVAC capex compounding) — expect insurance premiums to compound above CPI over the hold.
Questions for the listing agent
- It's been on market 126 days. Have you received any prior offers? Is the seller open to a 12% concession, seller financing, or rate buy-down credit?
- What's the actual annual flood-insurance premium (NFIP or private), and is the property in a SFHA with mandatory coverage?
- What does the HOA fee cover, when was the last increase, and are there any pending special assessments or reserve-fund shortfalls?
- Any open or pending special assessments — roof, HVAC, plumbing, elevator, façade? What's the per-unit balance and payoff schedule, and is the seller paying it off at close or rolling it to the buyer?
- Why hasn't it sold? Are there any deal-killer items the seller is aware of (foundation, flood, title, zoning, code violations)?
- Is there a deadline driving the sale (1031 exchange, divorce, estate, relocation)? That informs how much negotiation room exists.
- Crime grade is F in this area — have there been break-ins, vandalism, or insurance claims at this property in the last 3 years? What carrier currently insures it and at what premium?
- What's the average days-on-market for RENTAL listings here right now (not sales)? A rising rental-DOM trend means longer vacancies and softer asking-rent achievability than the comps imply.
- What's the recent tenant-quality profile in this submarket — average credit score on applications, eviction rate, late-payment / NSF rate, and stable-employment percentage? A property-management company in the area should have these aggregated.
- How much new apartment / multifamily construction is in the pipeline within 1–3 miles? Heavy new supply (>2% of stock underway) typically softens rents 12–24 months out; light construction supports rent growth.
Investment metrics
- 1% rule
- 1.55% ✓
- Cap rate
- 11.03%
- Cash-on-cash
- 16.93%
- DSCR
- 1.75
- GRM
- 5.4
CMA / ARV
No comps found within radius.
Projected returns pro-forma
-3.0% appreciation · 3.11% rent growth · sell at horizon
- IRR
- 3.7%
- Equity multiple
- 1.14×
- Total profit
- $3,203
- Equity at exit
- $11,928
- IRR
- 13.5%
- Equity multiple
- 2.09×
- Total profit
- $24,349
- Equity at exit
- $6,917
Cash invested: $22,400 (down + closing). Projections, not guarantees.
Landlord ↔ Tenant lean methodology
- Overall (STATE)
- 85 Strongly Landlord-Friendly
- State North Carolina
- 85 Strongly Landlord-Friendly · R+3
- County
- — inherits STATE
- City
- — inherits STATE
ZIP-level market 28314
- Home prices YoY
- -15.7%
- Rents YoY
- 3.1%
- Active inventory
- 429
- Price-to-rent
- 5.4×
Monthly cashflow live
- Estimated rent
- $1,241 high interval (Pro) →
- Mortgage (P&I)
- −$420
- Tax from tax record
- −$37 /mo · $449/yr
- Insurance
- −$33
- Flood insurance flood zone
- −$66 /mo · $798/yr
- HOA
- −$174
- Vacancy / Maint / Mgmt
- −$261
- Net cashflow
- $250
Break-even live
UW: 25.0% down · 7.5% · 30yr · 1.5% tax · 5.0% vac · 8.0% maint · 8.0% mgmt
Financing live
Cash to close
- Down payment
- $20,000
- Closing costs
- $2,400
- Reserves months
- —
- Total cash needed
- —
Loan-product check · same deal, 3 products live
Conventional
25% down · 7.5% · 30yr
- Down + closing
- —
- Monthly P&I
- —
- Monthly cashflow
- —
- DSCR
- —
- Eligible?
- —
Personal DTI + credit; lowest rate.
DSCR
20% down · 8.5% · 30yr
- Down + closing
- —
- Monthly P&I
- —
- Monthly cashflow
- —
- DSCR
- —
- Eligible?
- —
No personal income docs; deal must DSCR.
Hard money
10% down · 12.0% · 12mo
- Down + closing
- —
- Monthly P&I
- —
- Monthly cashflow
- —
- DSCR
- —
- Eligible?
- —
Short-term bridge; refi at stabilization.
Rent comps 40 comps
| Address | Beds | Baths | Sqft | Rent | $/sqft | DOM | Units | Dist |
|---|---|---|---|---|---|---|---|---|
| 1002 Brookhollow Dr #5 Fayetteville, NC | 3.0 | 2.0 | 1311 | $1,290 | $0.98 | 21d | 1 | 0.02mi |
| 1001 Brookhollow Dr #4 Fayetteville, NC | 3.0 | 2.0 | 1311 | $1,550 | $1.18 | 23d | 1 | 0.03mi |
| 6720 Willowbrook Dr #5 Fayetteville, NC | 2.0 | 2.0 | 1200 | $1,150 | $0.96 | 14d | 1 | 0.06mi |
| 1014 Brookhollow Dr Fayetteville, NC | 2.0 | 2.0 | 1050 | $1,000 | $0.95 | 14d | 1 | 0.10mi |
| 1022 Brookhollow Dr #5 Fayetteville, NC | 2.0 | 2.0 | 1086 | $1,050 | $0.97 | 23d | 1 | 0.15mi |
| 6748 Willowbrook Dr #9 Fayetteville, NC | 2.0 | 2.0 | 1157 | $1,100 | $0.95 | 23d | 1 | 0.15mi |
| 244 Wickford Ct Unit 6 Fayetteville, NC | 2.0 | 1.5 | 1141 | $995 | $0.87 | 23d | 1 | 0.18mi |
| 1000 Wood Creek Dr #9 Fayetteville, NC | 2.0 | 2.0 | 1100 | $1,175 | $1.07 | 23d | 1 | 0.19mi |
| 1018 Wood Creek Dr #9 Fayetteville, NC | 3.0 | 2.0 | 1101 | $1,195 | $1.09 | 23d | 1 | 0.22mi |
| 6855 Shawcross Ln Fayetteville, NC | 3.0 | 2.0 | 1100 | $1,495 | $1.36 | 23d | 1 | 0.24mi |
| 6848 Torrance Ln Fayetteville, NC | 3.0 | 2.5 | 1290 | $3,295 | $2.55 | 14d | 1 | 0.26mi |
| 6792 Willowbrook Dr #16 Fayetteville, NC | 1.0 | 1.0 | 800 | $795 | $0.99 | 23d | 1 | 0.31mi |
| 6792 Willowbrook Dr Fayetteville, NC | 1.0 | 1.0 | 900 | $795 | $0.88 | 14d | 1 | 0.31mi |
| 6809 Willowbrook Dr Fayetteville, NC | 2.0 | 2.0 | 1050 | $990 | $0.94 | 23d | 1 | 0.31mi |
| 6804 Willowbrook Dr Fayetteville, NC | 1.0 | 1.0 | 800 | $890 | $1.11 | 23d | 1 | 0.33mi |
| 6734 Winchester St Fayetteville, NC | 3.0 | 2.0 | 1068 | $3,195 | $2.99 | 14d | 1 | 0.35mi |
| 916 Glen Reilly Dr Fayetteville, NC | 3.0 | 2.0 | 1071 | $1,400 | $1.31 | 23d | 1 | 0.35mi |
| 942 Stewarts Creek Dr #9 Fayetteville, NC | 3.0 | 2.0 | 1250 | $1,250 | $1.00 | 23d | 1 | 0.36mi |
| 942 Stewarts Creek Dr #8 Fayetteville, NC | 2.0 | 2.0 | 1020 | $1,055 | $1.03 | 23d | 1 | 0.36mi |
| 205 Brookford Ct Fayetteville, NC | 3.0 | 2.0 | 1196 | $1,640 | $1.37 | 23d | 1 | 0.43mi |
| 605 S Reilly Rd Fayetteville, NC | 1.0–3.0 | 1.0–2.0 | 992 | $1,110 | $1.12 | 14d | 1 | 0.48mi |
| 621 Marshtree Ln #305 Fayetteville, NC | 2.0 | 2.0 | 1140 | $1,500 | $1.32 | 23d | 1 | 0.60mi |
| 338 Milburn Dr Fayetteville, NC | 3.0 | 1.5 | 1128 | $1,550 | $1.37 | 23d | 1 | 0.62mi |
| 6535 Jefferey Dr Fayetteville, NC | 1.0 | 1.0 | 700 | $905 | $1.29 | 14d | 3 | 0.63mi |
| 6407 Wallaby Ct Fayetteville, NC | 2.0 | 1.5 | 1100 | $1,200 | $1.09 | 14d | 1 | 0.64mi |
| 625 Marshtree Ln Fayetteville, NC | 2.0–3.0 | 2.0 | 1170 | $1,200 | $1.03 | 14d | 2 | 0.65mi |
| 6793 Candlewood Dr Fayetteville, NC | 3.0 | 2.0 | 1240 | $1,475 | $1.19 | 14d | 1 | 0.79mi |
| 540 Auburndale Ln Fayetteville, NC | 3.0 | 2.0 | 1100 | $1,600 | $1.45 | 14d | 1 | 0.79mi |
| 7252 Ainsley St Fayetteville, NC | 3.0 | 1.0 | 1265 | $1,299 | $1.03 | 23d | 1 | 0.84mi |
| 111 Grande Oaks Dr Fayetteville, NC | 1.0–3.0 | 1.0–2.0 | 1205 | $1,412 | $1.17 | 14d | 46 | 0.90mi |
| 6521 Cissna Dr Fayetteville, NC | 3.0 | 2.0 | 1456 | $1,375 | $0.94 | 14d | 1 | 0.91mi |
| 6445 Independence Pl Dr Fayetteville, NC | 1.0–3.0 | 1.0–3.0 | 1106 | $1,529 | $1.38 | 14d | 18 | 0.94mi |
| 567 Cutchen Ln Fayetteville, NC | 1.0–3.0 | 1.0–2.0 | 975 | $1,175 | $1.20 | 14d | 61 | 0.94mi |
| 6510 Cissna Dr Fayetteville, NC | 3.0 | 1.5 | 1100 | $1,095 | $1.00 | 14d | 1 | 0.95mi |
| 202 Bertram Pl Fayetteville, NC | 3.0 | 2.0 | 1175 | $1,300 | $1.11 | 14d | 1 | 0.96mi |
| 495 Stiles Pl Fayetteville, NC | 3.0 | 2.0 | 1300 | $1,250 | $0.96 | 14d | 1 | 1.02mi |
| 679 Bartons Landing Pl Fayetteville, NC | 2.0 | 2.0 | 1145 | $1,150 | $1.00 | 23d | 1 | 1.09mi |
| 679 Bartons Landing Pl Unit 6 Fayetteville, NC | 2.0 | 2.0 | 1145 | $1,200 | $1.05 | 23d | 1 | 1.09mi |
| 672 Bartons Landing Pl Fayetteville, NC | 2.0 | 2.0 | 1145 | $1,100 | $0.96 | 14d | 1 | 1.10mi |
| 307 Family Lodge Dr Unit 5 Fayetteville, NC | 2.0 | 2.5 | 1200 | $1,100 | $0.92 | 14d | 1 | 1.18mi |
HOA detail condo
- Monthly dues
- $174 · $2,088/yr
- Likely covers
- pool
- Assessments
- None detected in remarks — confirm with the listing agent.
Listing history 22 events
-
2026-06-18days on market $80,000 Active 126 DOM
-
2026-06-17days on market $80,000 Active 125 DOM
-
2026-06-16days on market $80,000 Active 124 DOM
-
2026-06-15days on market $80,000 Active 123 DOM
-
2026-06-14days on market $80,000 Active 121 DOM
-
2026-06-13days on market $80,000 Active 120 DOM
-
2026-06-10days on market $80,000 Active 118 DOM
-
2026-06-09days on market $80,000 Active 117 DOM
-
2026-06-08days on market $80,000 Active 116 DOM
-
2026-06-07days on market $80,000 Active 115 DOM
-
2026-06-03days on market $80,000 Active 111 DOM
-
2026-06-02days on market $80,000 Active 110 DOM
-
2026-06-01days on market $80,000 Active 109 DOM
-
2026-05-31days on market $80,000 Active 108 DOM
-
2026-05-30days on market $80,000 Active 107 DOM
-
2026-03-06price $80,000
-
2026-02-12$85,000 Active
-
2025-09-26price $80,000
-
2025-03-19$90,000 Active
-
2013-01-23soldstatus $27,500
-
2002-03-27soldstatus $51,500
-
1992-11-25soldstatus $57,000
ⓘ Source: listings_history table (triggers on properties + properties_extension) + one-shot
backfill from property_details.listing_events for pre-trigger history.
Tax reassessment forecast NC · Resets to sale price
- Current annual tax
- $449 · $37/mo
- Projected year-2 tax
- $656 · $55/mo
- Expected delta
- +$207/yr (+$17/mo · 46.2%)
ⓘ Screening estimate from a state-policy table — verify with the county assessor before closing.
Climate risk First Street
- Flood 7/10 Severe FEMA zone X (unshaded) · 76% chance over 30 yrs
- Wildfire 4/10 Moderate
- Heat 7/10 Severe 7 d/yr ≥106°F today · 16 d/yr by 30 yrs out
- Wind 7/10 Severe 75% chance of damaging wind over 30 yrs
- Air quality 2/10 Low 0 unhealthy d/yr today · 1 by 30 yrs out
Nearby sold comps map
Loading sold comps map…
Walkable amenities ~0.75 mi
Loading nearby amenities…
Taxation est. · year 1
- Rental income
- $14,892
- − Mortgage interest
- −$4,481
- − Property taxes
- −$449
- − Insurance
- −$1,198
- − Repairs & maintenance
- −$1,191
- − Management
- −$1,191
- − HOA
- −$2,088
- − Depreciation
- −$2,327
- Taxable income
- $1,966
- Est. tax owed @ 24.0%
- −$472
- After-tax cash flow
- $2,524/yr
For passive investors: Depreciation is non-cash, so a rental often shows a tax loss while cash-flowing — sheltering income. Rental losses are passive: they offset passive income freely, and up to $25,000/yr can offset ordinary (W-2) income if you actively participate and your MAGI is under $100k (phasing out to $0 by $150k); unused losses carry forward. On sale, claimed depreciation is recaptured at up to 25%, and gains may owe capital-gains tax (a 1031 exchange can defer both). Figures are a year-1 estimate at your 24.0% rate — not tax advice; consult a CPA.
Schools (NCES district)
- District
- Cumberland County Schools
- NCES district ID
- 3700011
- Math proficiency
- 32% ▼ -2.00%
- Reading proficiency
- 41% ▼ -1.00%
- Median HH income
- $44,168
- Composite
- 31.0/100
- National rank
- #6096
- State rank
- #126 of 178 in NC
Livability — Fayetteville
- Score
- 75/100
- State rank
- #45
- US rank
- #4031
Category grades
Schools grade is shown separately in the Schools card above.
Census & demographics
- Census place
- Fayetteville, NC
- County
- Cumberland County · 265,314 people
- City population
- 226,118
- Metro
- Fayetteville, NC
- Population (ZIP)
- 55,834
- Household income
- $62,249
- Rent vs Own
- Severe rent burden
- 2511.0
Population outlook (Cumberland County) Hauer SSP2
- Today (2025)
- 330,855 people
- By 2030
- 333,523 · +0.8%
- By 2040
- 335,583 · +1.4%
- By 2050
- 335,325 · +1.4%
- By 2075
- 342,853 · +3.6%
- By 2100
- 340,698 · +3.0%
Race, ethnicity, and origin ACS 2023
- Neighborhood character
- Diverse neighborhood (Simpson 0.67)
- Race & ethnicity
- Black 49% White 25% Hispanic / Latino 16% Two or more races 11% Asian 3%
- Hispanic origin (detail)
- Mexican 5% Puerto Rican 6% Dominican 1%
- Common ancestry
- Slovak 1% Romanian 1% Lithuanian 1%
- Foreign-born
- 9% · Canada, South Korea
- Languages at home
- 84% English-only · Spanish 10% Korean 1% Other Asian/Pacific 1%
Political lean MEDSL · Cumberland
- 2024 margin
- D (+13.4) · D 56.1% · R 42.7% · Other 1.2%
- 2008→2024 swing
- -4.3pp toward R · 2008: 17.7pp · 2024: 13.4pp
- All cycles
- 2024: D+13.4 2020: D+16.6 2016: D+16.0 2012: D+19.7 2008: D+17.7
Not yet ingested
- Civics
- —
Market trends
- HPI YoY
- ▼ -43.20%
- Current HPI
- 231.873
- Rent YoY
- ▲ 3.11%
- Metro
- Fayetteville, NC
- State GDP YoY
- ▲ 3.28%
- F500 in state
- 26
Industry mix (Fortune 500 HQ in NC)
| Industry | F500 HQs | Revenue |
|---|---|---|
| Financial Services | 2 | $213B |
|
||
| Retail | 2 | $95B |
|
||
| Industrial Conglomerate | 1 | $38B |
|
||
| Metals / Steel | 1 | $35B |
|
||
| Utilities | 1 | $30B |
|
||
| Industrial Machinery | 1 | $19B |
|
||
Price history
+40.4% since first listed7 events — show timeline
- 2026-03-06 Price Changed $80,000 LPRMLS
- 2026-02-12 Listed $85,000 LPRMLS
- 2025-09-26 Price Changed $80,000 LPRMLS
- 2025-03-19 Listed $90,000 LPRMLS
- 2013-01-23 Sold (Public Records) $27,500 Public Records
- 2002-03-27 Sold (Public Records) $51,500 Public Records
- 1992-11-25 Sold (Public Records) $57,000 Public Records
Property tax history
-11.2%/yrLatest (2019): $449 · +0.0% YoY. Source: county tax records.
Cash-flow waterfall
monthlySold comps — $/sqft
last 12 mo · ≤1 miLoading sold comps…