257 County Road 2608 · Bonham, TX
Flood risk 1/10 · Minimal
- FEMA flood zone
- X (unshaded)
- Chance of flooding over 30 yrs
- 0.0%
- Est. flood insurance / yr
- $507 – $1,088
Fire risk 7/10 · Major
- Est. fire insurance / yr
- $1,222 – $2,270
Heat risk 7/10 · Major
- Hot days now (above 110°F)
- 7 days/yr
- Hot days in 30 yrs
- 22 days/yr
Wind risk 4/10 · Minor
- Chance of severe wind over 30 yrs
- 23.0%
Air-quality risk 2/10 · Minimal
- Unhealthy air days now
- 1 days/yr
- Unhealthy air days in 30 yrs
- 1 days/yr
Risk factors via First Street. Map © Google.
Why this score? — see what drove the D+ grade
The composite is a weighted blend of 9 inputs, each scored 0–100. Each bar is that input's sub-score; the figure is the points it added to the 100-point composite (weight × sub-score).
- Cash flow +17.3/30.0
- ARV discount +7.5/15.0
- DSCR +5.4/10.0
- 1% rule +4.8/10.0
- Schools +3.2/10.0
- Livability +3.2/5.0
- Rent growth +2.5/5.0
- Condition / age +2.5/5.0
- Appreciation +0.0/10.0
$133,650
🖨 Deal sheet (PDF) 📄 Offer letter ✓ Due diligence
Listing remarks
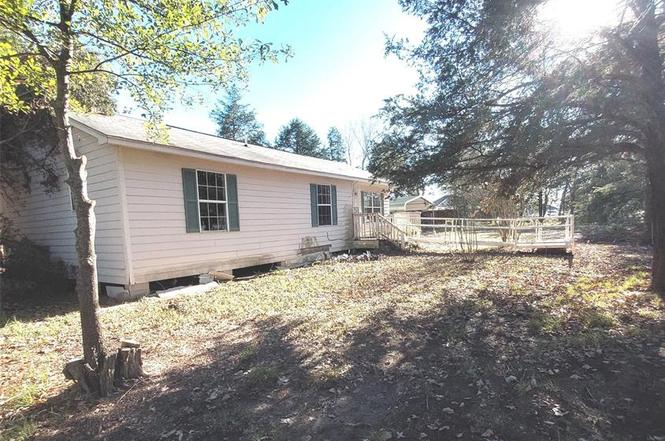
Great country setting only minutes from town and the Bonham Lake. This home sits on a 1.61 acre wooded lot. There is a detached carport and wheelchair ramp. This home offers an open living room and dining area and a galley style kitchen. Primary bedroom has an ensuite bathroom. Lots of opportunity to make this home yours. There is also a storage building in the back yard. Conveniently located only minutes from the lake or shopping and dining in Bonham Tx. Easy commute to Sherman or DFW area. Come take a look today. Sold AS-IS.
Key facts
- Open living room
- Wooded lot
- Detached carport
Tags
Property features AI
Finance
- Other: Lot is approximately 1.601 acres; Will not subdivide
- Financial info: Treat as clear loan type; No second mortgage; Property listed as real estate owned
- HOA & community: No homeowners association
Exterior
- Parking: Covered carport (2 covered spaces, 2 carport spaces)
- Utilities: All-weather road (utility access); Not in a municipal utility district
- Home design: Single family residence; Residential property; Facing and entry details not provided
- Construction: Built in 2002; Siding exterior; Block foundation; Composition roof
- Exterior features: Storage structure on property; All-weather road access
Interior
- Kitchen: No appliances included
- Bedrooms: 3 bedrooms (all on main level); Primary bedroom on main level
- Flooring: Vinyl flooring; Other flooring
- Bathrooms: 2 full bathrooms
- Heating & cooling: Central heating; Central air conditioning
- Interior features: One-level home; 9 total rooms; One living area; One dining area; Other interior finishes
- Laundry & utility: Utility room with washer hookup; Full-size washer/dryer area
Neighborhood map
What this means for you Summary
Snapshot
- This is a 3-bed/1.0-bath single-family listed at $134k.
Deal economics
- At list price, monthly cash flow is $99 ($1k/yr) — positive.
- The deal already cash-flows at list — no discount required.
- To meet the 1% rule (rent ≥ 1% of price), the offer needs to be $132k (1.6% below list).
- Recommended offer: $118k (12.0% below list) — sets the bar for market timing.
- Cap rate 7.2% vs local median 3.5% in Bonham — top-decile yield for the area; either an underpriced asset or a hidden risk that comps aren't pricing in. Stress-test before assuming the spread holds.
Location & tenants
- Location reads 64/100 on livability (#785 in TX) — a middle-class / working-renter tenant base. Strengths: crime A+, cost of living A+, housing A+; Watch: employment D, schools D-, amenities F.
- Bonham ISD (town): math 37% / reading 38% proficiency, ranked #477 of 826 in TX (top 58%) — families likely to look elsewhere, expect single-tenant / working-renter base with shorter leases.
- Market conditions: 277 active listings in the ZIP; 82 units permitted in Fannin County in 2024 (0 in 5+ unit buildings).
Forward outlook
- Local home prices are declining (-3.0%/yr); year-one equity from $924 of loan paydown is wiped out by about $4k of value loss. Plan a longer hold.
- Fannin County population projected to shrink 6% by 2050 — rents likely to lag national; underwrite the cash flow, not the appreciation.
Negotiation context
- It's been on market 179 days — a 12% lower offer ($118k) is reasonable based on typical stale-listing flexibility.
- 2 sale attempts; this cycle's ask has dropped $44k (25%) from the opening price — seller is motivated, your offer sets the floor, not the list.
Risks & watch-outs
- Climate carrying-cost: major wildfire risk; extreme-heat days projected 7→22/yr by 2055 (HVAC capex compounding) — expect insurance premiums to compound above CPI over the hold.
Questions for the listing agent
- It's been on market 179 days. Have you received any prior offers? Is the seller open to a 12% concession, seller financing, or rate buy-down credit?
- Why hasn't it sold? Are there any deal-killer items the seller is aware of (foundation, flood, title, zoning, code violations)?
- Is there a deadline driving the sale (1031 exchange, divorce, estate, relocation)? That informs how much negotiation room exists.
- Schools are D-rated, which usually means shorter tenancies and higher turnover. Who's the typical renter profile here, and what's been the actual vacancy rate?
- The area grade is low — what's the realistic commute time and amenity access for the typical tenant pool here? Any planned neighborhood developments (good or bad) we should know about?
- What's the average days-on-market for RENTAL listings here right now (not sales)? A rising rental-DOM trend means longer vacancies and softer asking-rent achievability than the comps imply.
- What's the recent tenant-quality profile in this submarket — average credit score on applications, eviction rate, late-payment / NSF rate, and stable-employment percentage? A property-management company in the area should have these aggregated.
- How much new for-sale + rental construction is in the pipeline within 1–3 miles? Heavy new supply typically softens prices + rents 12–24 months out; constrained supply supports both.
Investment metrics
- 1% rule
- 0.98% ✗
- Cap rate
- 7.18%
- Cash-on-cash
- 3.17%
- DSCR
- 1.14
- GRM
- 8.5
CMA / ARV
No comps found within radius.
Projected returns pro-forma
-3.0% appreciation · 3.0% rent growth · sell at horizon
- IRR
- -11.3%
- Equity multiple
- 0.59×
- Total profit
- $-15,323
- Equity at exit
- $19,928
- IRR
- -2.0%
- Equity multiple
- 0.86×
- Total profit
- $-5,102
- Equity at exit
- $11,556
Cash invested: $37,422 (down + closing). Projections, not guarantees.
Landlord ↔ Tenant lean methodology
- Overall (STATE)
- 87 Strongly Landlord-Friendly
- State Texas
- 87 Strongly Landlord-Friendly · R+5
- County
- — inherits STATE
- City
- — inherits STATE
ZIP-level market 75418
- Home prices YoY
- -8.9%
- Active inventory
- 277
- Price-to-rent
- 8.5×
Monthly cashflow live
- Estimated rent
- $1,316 medium interval (Pro) →
- Mortgage (P&I)
- −$701
- Tax from tax record
- −$184 /mo · $2,206/yr
- Insurance
- −$56
- HOA
- −$0
- Vacancy / Maint / Mgmt
- −$276
- Net cashflow
- $99
Break-even live
Sensitivity live
| Price | -10% $175 | -5% $137 | +0% $99 | +5% $61 | +10% $23 |
|---|---|---|---|---|---|
| Rent | -10% $-5 | -5% $47 | +0% $99 | +5% $151 | +10% $203 |
| Rate | -1.0pp $166 | -0.5pp $133 | base $99 | +0.5pp $64 | +1.0pp $29 |
UW: 25.0% down · 7.5% · 30yr · 1.5% tax · 5.0% vac · 8.0% maint · 8.0% mgmt
Financing live
Cash to close
- Down payment
- $33,412
- Closing costs
- $4,010
- Reserves months
- —
- Total cash needed
- —
Loan-product check · same deal, 3 products live
Conventional
25% down · 7.5% · 30yr
- Down + closing
- —
- Monthly P&I
- —
- Monthly cashflow
- —
- DSCR
- —
- Eligible?
- —
Personal DTI + credit; lowest rate.
DSCR
20% down · 8.5% · 30yr
- Down + closing
- —
- Monthly P&I
- —
- Monthly cashflow
- —
- DSCR
- —
- Eligible?
- —
No personal income docs; deal must DSCR.
Hard money
10% down · 12.0% · 12mo
- Down + closing
- —
- Monthly P&I
- —
- Monthly cashflow
- —
- DSCR
- —
- Eligible?
- —
Short-term bridge; refi at stabilization.
Listing history 10 events
-
2026-04-29status Pending
-
2026-04-06price $133,650
-
2026-01-31status Active
-
2026-01-28historical
-
2026-01-19price $141,075
-
2026-01-15price $147,250
-
2025-12-29price $155,000
-
2025-12-05price $169,100
-
2025-10-30$178,000 Active
-
2002-07-31soldstatus
ⓘ Source: listings_history table (triggers on properties + properties_extension) + one-shot
backfill from property_details.listing_events for pre-trigger history.
Tax reassessment forecast TX · Resets to sale price
- Current annual tax
- $2,206 · $184/mo
- Projected year-2 tax
- $2,446 · $204/mo
- Expected delta
- +$239/yr (+$20/mo · 10.9%)
ⓘ Screening estimate from a state-policy table — verify with the county assessor before closing.
Climate risk First Street
- Flood 1/10 Low FEMA zone X (unshaded) · 0% chance over 30 yrs
- Wildfire 7/10 Severe
- Heat 7/10 Severe 7 d/yr ≥110°F today · 22 d/yr by 30 yrs out
- Wind 4/10 Moderate 23% chance of damaging wind over 30 yrs
- Air quality 2/10 Low 1 unhealthy d/yr today · 1 by 30 yrs out
Nearby sold comps map
Loading sold comps map…
Walkable amenities ~0.75 mi
Loading nearby amenities…
Taxation est. · year 1
- Rental income
- $15,789
- − Mortgage interest
- −$7,486
- − Property taxes
- −$2,206
- − Insurance
- −$668
- − Repairs & maintenance
- −$1,263
- − Management
- −$1,263
- − Depreciation
- −$3,888
- Taxable loss
- −$987
- Est. tax savings @ 24.0%
- +$237
- After-tax cash flow
- $1,425/yr
For passive investors: Depreciation is non-cash, so a rental often shows a tax loss while cash-flowing — sheltering income. Rental losses are passive: they offset passive income freely, and up to $25,000/yr can offset ordinary (W-2) income if you actively participate and your MAGI is under $100k (phasing out to $0 by $150k); unused losses carry forward. On sale, claimed depreciation is recaptured at up to 25%, and gains may owe capital-gains tax (a 1031 exchange can defer both). Figures are a year-1 estimate at your 24.0% rate — not tax advice; consult a CPA.
Schools (NCES district)
- District
- Bonham ISD
- NCES district ID
- 4810800
- Math proficiency
- 37% ▼ -1.00%
- Reading proficiency
- 38% ▼ -2.00%
- Median HH income
- $41,740
- Composite
- 31.63/100
- National rank
- #5937
- State rank
- #477 of 826 in TX
Livability — Bonham
- Score
- 64/100
- State rank
- #785
- US rank
- #14360
Category grades
Schools grade is shown separately in the Schools card above.
Census & demographics
- County
- Fannin County · 15,155 people
- City population
- 15,155
- Metro
- Bonham, TX
- Population (ZIP)
- 15,155
- Household income
- $68,918
- Rent vs Own
- Severe rent burden
- 281.0
Population outlook (Fannin County) Hauer SSP2
- Today (2025)
- 33,423 people
- By 2030
- 33,035 · -1.2%
- By 2040
- 32,250 · -3.5%
- By 2050
- 31,462 · -5.9%
- By 2075
- 29,447 · -11.9%
- By 2100
- 25,459 · -23.8%
Race, ethnicity, and origin ACS 2023
- Neighborhood character
- Predominantly White (68%)
- Race & ethnicity
- White 68% Hispanic / Latino 17% Black 10% Two or more races 8%
- Hispanic origin (detail)
- Mexican 16%
- Common ancestry
- Lithuanian 3% Slovak 1% Italian 1%
- Foreign-born
- 7% · Canada, Philippines
- Languages at home
- 85% English-only · Spanish 14%
Political lean MEDSL · Fannin
- 2024 margin
- Solid R (+67.4) · D 15.9% · R 83.3%
- 2008→2024 swing
- -27.8pp toward R · 2008: -39.6pp · 2024: -67.4pp
- All cycles
- 2024: R+67.4 2020: R+63.4 2016: R+61.9 2012: R+52.5 2008: R+39.6
Not yet ingested
- Civics
- —
Market trends
- HPI YoY
- ▼ -25.59%
- Current HPI
- 262.7177
- Rent YoY
- —
- Metro
- Bonham, TX
- State GDP YoY
- ▲ 3.95%
- F500 in state
- 110
Industry mix (Fortune 500 HQ in TX)
| Industry | F500 HQs | Revenue |
|---|---|---|
| Energy | 16 | $1,198B |
|
||
| Technology | 5 | $198B |
|
||
| Engineering / Construction | 4 | $72B |
|
||
| Energy Services | 3 | $60B |
|
||
| Utilities | 3 | $41B |
|
||
| Healthcare | 2 | $330B |
|
||
Price history
-24.9% since first listed10 events — show timeline
- 2026-04-29 Pending — NTREIS
- 2026-04-06 Price Changed $133,650 NTREIS
- 2026-01-31 Relisted — NTREIS
- 2026-01-28 Listing Removed — NTREIS
- 2026-01-19 Price Changed $141,075 NTREIS
- 2026-01-15 Price Changed $147,250 NTREIS
- 2025-12-29 Price Changed $155,000 NTREIS
- 2025-12-05 Price Changed $169,100 NTREIS
- 2025-10-30 Listed $178,000 NTREIS
- 2002-07-31 Sold (Public Records) — Public Records
Property tax history
+5.6%/yrLatest (2025): $2,206 · -7.8% YoY. Source: county tax records.
Cash-flow waterfall
monthlySold comps — $/sqft
last 12 mo · ≤1 miLoading sold comps…