 Multi-family
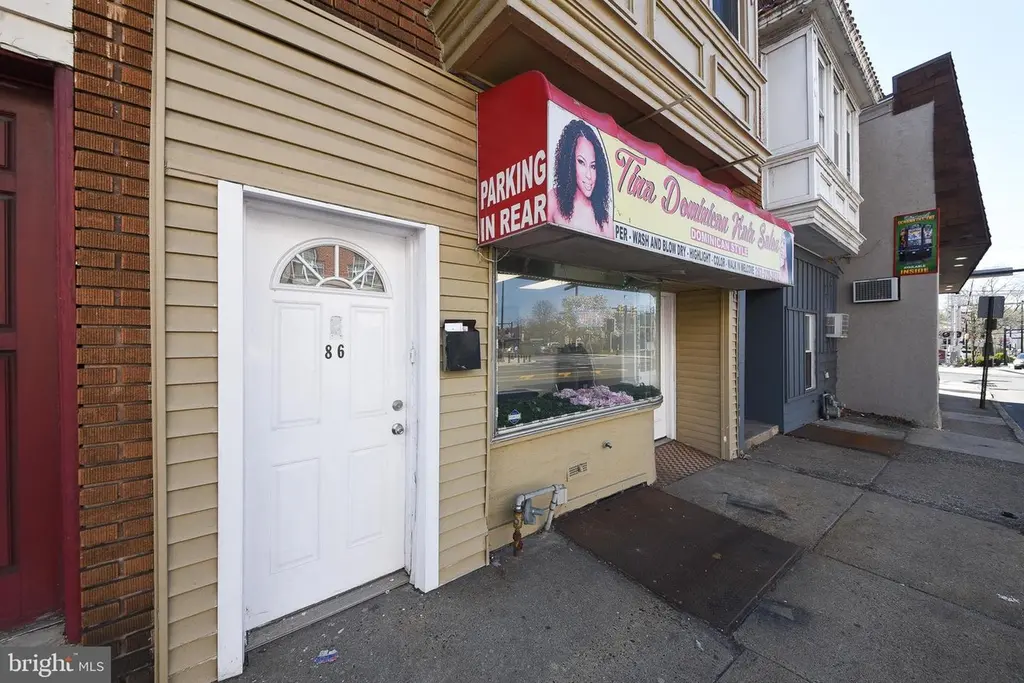
86 N York Rd · Upper Moreland, PA
Flood risk No data
- FEMA flood zone
- —
- Chance of flooding over 30 yrs
- —
- Est. flood insurance / yr
- —
Fire risk No data
- Est. fire insurance / yr
- —
Heat risk No data
- Hot days now (above threshold)
- —
- Hot days in 30 yrs
- —
Wind risk No data
- Chance of severe wind over 30 yrs
- —
Air-quality risk No data
- Unhealthy air days now
- —
- Unhealthy air days in 30 yrs
- —
Risk factors via First Street. Map © Google.
Why this score? — see what drove the B- grade
The composite is a weighted blend of 9 inputs, each scored 0–100. Each bar is that input's sub-score; the figure is the points it added to the 100-point composite (weight × sub-score).
- Cash flow +30.0/30.0
- 1% rule +10.0/10.0
- DSCR +10.0/10.0
- ARV discount +4.8/15.0
- Schools +4.5/10.0
- Condition / age +3.8/5.0
- Rent growth +3.4/5.0
- Livability +2.5/5.0
- Appreciation +0.0/10.0
$460,000
🖨 Deal sheet (PDF) 📄 Offer letter ✓ Due diligence
Multi-family units
County records classify this as Multi-Family (2-4 Unit). Listing-text estimate: 1 unit. estimate disagrees with records
Listing remarks MLS
PRIME MULTI-FAMILY INVESTMENT OPPORTUNITY in the heart of WILLOW GROVE! Welcome to 86 N YORK RD, a HIGH-INCOME PRODUCING MIXED-USE PROPERTY located in a BUSY COMMERCIAL CORRIDOR with STRONG VISIBILITY AND FOOT TRAFFIC. This ATTACHED ROW BUILDING offers over 3,300 SQ FT of versatile space, ideal for investors seeking STABLE CASH FLOW AND LONG-TERM VALUE. The property features THREE 1-BEDROOM RESIDENTIAL UNITS, providing consistent rental income, along with a GROUND-LEVEL COMMERCIAL SPACE CURRENTLY OPERATING AS A HAIR SALON & SPA, adding an additional revenue stream. With MULTIPLE INCOME SOURCES, a DESIRABLE LOCATION, and strong rental potential, this is an excellent opportunity for both seasoned investors and those looking to expand their portfolio. Don’t miss your chance to own a CASH-FLOWING, MIXED-USE MULTI-FAMILY PROPERTY in one of Willow Grove’s most active business districts!
Key facts
- Mixed use property
- Strong visibility
- 3,345 sq ft lot
Tags
Neighborhood map
What this means for you Summary
Snapshot
- This is a 4-bed/?-bath multifamily listed at $460k. Condition is rated good.
Deal economics
- At list price, monthly cash flow is $3k ($36k/yr) — positive.
- The deal already cash-flows at list — no discount required.
- Meets the 1% rule at list price ($8k rent vs $460k).
- Recommended offer: $432k (6.0% below list) — sets the bar for market timing.
Location & tenants
- Location reads: area grade B — affects rentability + tenant quality, not the cash-flow math above.
- Upper Moreland Township SD (suburban): math 41% / reading 62% proficiency, ranked #137 of 539 in PA (top 25%) — acceptable for families but not a draw, mixed tenant base, ~2y average lease.
- Market conditions: Rents rising (+3.5%/yr); 32 active listings in the ZIP; 4 comparable units currently listed for rent nearby; rentals at typical pace (median 19d on market — plan ~3-4 weeks tenant-placement turnaround); solid renter incomes; 1,936 units permitted in Montgomery County in 2024 (530 in 5+ unit buildings).
- At $7,773/mo this rent would consume 93% of the median local household income ($100k/yr) (locally 468% of renters already pay >50% of income on rent) — very limited rent-growth headroom before tenants either downsize or default.
Forward outlook
- Local home prices are declining (-3.0%/yr); year-one equity from $3k of loan paydown is wiped out by about $14k of value loss. Plan a longer hold.
- Montgomery County population projected at +5% by 2050 — modest demand growth; plan on rents tracking national, not racing it.
- At projected returns (-3.0% appreciation + 3.5% rent growth), your $129k cash investment doubles in ~5 years — after that, you're playing with house money.
Negotiation context
- It's been on market 62 days — a 6% lower offer ($432k) is reasonable based on typical stale-listing flexibility.
Risks & watch-outs
- Watch-outs: built in 1920 — expect roof / HVAC / electrical / plumbing capex.
Questions for the listing agent
- It's been on market 62 days. Have you received any prior offers? Is the seller open to a 6% concession, seller financing, or rate buy-down credit?
- Built in 1920 — when were the roof, HVAC, electrical panel, plumbing, and water heater last replaced?
- Why hasn't it sold? Are there any deal-killer items the seller is aware of (foundation, flood, title, zoning, code violations)?
- Is there a deadline driving the sale (1031 exchange, divorce, estate, relocation)? That informs how much negotiation room exists.
- What's the average days-on-market for RENTAL listings here right now (not sales)? A rising rental-DOM trend means longer vacancies and softer asking-rent achievability than the comps imply.
- What's the recent tenant-quality profile in this submarket — average credit score on applications, eviction rate, late-payment / NSF rate, and stable-employment percentage? A property-management company in the area should have these aggregated.
- How much new apartment / multifamily construction is in the pipeline within 1–3 miles? Heavy new supply (>2% of stock underway) typically softens rents 12–24 months out; light construction supports rent growth.
Investment metrics
- 1% rule
- 1.69% ✓
- Cap rate
- 14.02%
- Cash-on-cash
- 27.59%
- DSCR
- 2.23
- GRM
- 4.9
CMA / ARV
- ARV (median comp)
- $434,312
- List price
- $460,000
- Delta
- 5.91%
- Verdict
- FAIR
- Comps
- 20 within 1.0 mi
Show comp detail 7 sales within ~0.75 mi
| Address | Dist | Beds/Ba | Sqft | Sold | Price | $/sf | Match |
|---|---|---|---|---|---|---|---|
| 60 Cherry St | 0.05mi | 4/— | 2,500 | 15mo | $275,000 | $110 | 73 |
| 501 W Moreland Rd | 0.52mi | 3/2.0 (-1) | 1,823 | 0mo | $385,000 | $211 | 58 |
| 120 Cameron Rd | 0.56mi | 4/— | 1,980 | 9mo | $569,900 | $288 | 54 |
| 152 Allison Rd | 0.45mi | 4/— | 1,426 | 19mo | $300,000 | $210 | 51 |
| 2227 Old Welsh Rd | 0.48mi | 4/— | 2,652 | 20mo | $465,000 | $175 | 49 |
| 1781 Old York Rd | 0.59mi | 3/3.5 (-1) | — | 8mo | $325,000 | — | 49 |
| 710 N York Rd | 0.63mi | 4/— | 1,920 | 14mo | $430,000 | $224 | 46 |
Match score weights: distance 35% · size 25% · config 20% · recency 20%. Top-matched comps best support the ARV.
Projected returns pro-forma
-3.0% appreciation · 3.52% rent growth · sell at horizon
- IRR
- 22.3%
- Equity multiple
- 1.92×
- Total profit
- $118,298
- Equity at exit
- $68,587
- IRR
- 30.6%
- Equity multiple
- 3.82×
- Total profit
- $363,336
- Equity at exit
- $39,772
Cash invested: $128,800 (down + closing). Projections, not guarantees.
Landlord ↔ Tenant lean methodology
- Overall (STATE)
- 62 Landlord-Friendly
- State Pennsylvania
- 62 Landlord-Friendly · EVEN
- County
- — inherits STATE
- City
- — inherits STATE
ZIP-level market 19090
- Rents YoY
- 3.5%
- Active inventory
- 32
- Price-to-rent
- 20.0×
Monthly cashflow live
- Estimated rent
- $7,773 high interval (Pro) →
- Mortgage (P&I)
- −$2,412
- Tax est. 1.5%
- −$575 /mo · $6,900/yr
- Insurance
- −$192
- HOA
- −$0
- Vacancy / Maint / Mgmt
- −$1,632
- Net cashflow
- $2,962
Break-even live
Sensitivity live
| Price | -10% $3,280 | -5% $3,121 | +0% $2,962 | +5% $2,803 | +10% $2,644 |
|---|---|---|---|---|---|
| Rent | -10% $2,348 | -5% $2,655 | +0% $2,962 | +5% $3,269 | +10% $3,576 |
| Rate | -1.0pp $3,193 | -0.5pp $3,079 | base $2,962 | +0.5pp $2,843 | +1.0pp $2,721 |
4-unit breakdown (identical units grouped — click to expand)
| Units | Beds | Baths | Est. rent |
|---|---|---|---|
| 3× units | 1 | 1 | $5,760 |
| #1 | 1 | 1 | $1,920 |
| #2 | 1 | 1 | $1,920 |
| #3 | 1 | 1 | $1,920 |
| 1× unit | 0 | 0 | $2,013 |
| Total (4 units) | $7,773 | ||
UW: 25.0% down · 7.5% · 30yr · 1.5% tax · 5.0% vac · 8.0% maint · 8.0% mgmt
Financing live
Cash to close
- Down payment
- $115,000
- Closing costs
- $13,800
- Reserves months
- —
- Total cash needed
- —
Loan-product check · same deal, 3 products live
Conventional
25% down · 7.5% · 30yr
- Down + closing
- —
- Monthly P&I
- —
- Monthly cashflow
- —
- DSCR
- —
- Eligible?
- —
Personal DTI + credit; lowest rate.
DSCR
20% down · 8.5% · 30yr
- Down + closing
- —
- Monthly P&I
- —
- Monthly cashflow
- —
- DSCR
- —
- Eligible?
- —
No personal income docs; deal must DSCR.
Hard money
10% down · 12.0% · 12mo
- Down + closing
- —
- Monthly P&I
- —
- Monthly cashflow
- —
- DSCR
- —
- Eligible?
- —
Short-term bridge; refi at stabilization.
Rent comps 4 comps
| Address | Beds | Baths | Sqft | Rent | $/sqft | DOM | Units | Dist |
|---|---|---|---|---|---|---|---|---|
| 518 Davisville Rd Willow Grove, PA | 3.0 | 2.0 | 1400 | $2,500 | $1.79 | 45d | 1 | 0.41mi |
| 303 Overlook Ave Willow Grove, PA | 3.0 | 1.5 | 1240 | $2,750 | $2.22 | 0d | 1 | 0.53mi |
| 2344 Hamilton Ave Willow Grove, PA | 3.0 | 2.0 | 1920 | $2,800 | $1.46 | 18d | 1 | 0.91mi |
| 2827 Galloway Ave Abington, PA | 4.0 | 2.0 | 1708 | $2,820 | $1.65 | 19d | 1 | 1.27mi |
Listing history 11 events
-
2026-06-09days on market $460,000 Active 62 DOM
-
2026-06-08days on market $460,000 Active 61 DOM
-
2026-06-07days on market $460,000 Active 60 DOM
-
2026-06-04days on market $460,000 Active 57 DOM
-
2026-06-03days on market $460,000 Active 56 DOM
-
2026-06-02days on market $460,000 Active 55 DOM
-
2026-06-01days on market $460,000 Active 54 DOM
-
2026-05-31days on market $460,000 Active 53 DOM
-
2026-05-10price $460,000 911-char remark
Show marketing remark (911 chars)
PRIME MULTI-FAMILY INVESTMENT OPPORTUNITY in the heart of WILLOW GROVE! Welcome to 86 N YORK RD, a HIGH-INCOME PRODUCING MIXED-USE PROPERTY located in a BUSY COMMERCIAL CORRIDOR with STRONG VISIBILITY AND FOOT TRAFFIC. This ATTACHED ROW BUILDING offers over 3,300 SQ FT of versatile space, ideal for investors seeking STABLE CASH FLOW AND LONG-TERM VALUE. The property features THREE 1-BEDROOM RESIDENTIAL UNITS, providing consistent rental income, along with a GROUND-LEVEL COMMERCIAL SPACE CURRENTLY OPERATING AS A HAIR SALON & SPA, adding an additional revenue stream. With MULTIPLE INCOME SOURCES, a DESIRABLE LOCATION, and strong rental potential, this is an excellent opportunity for both seasoned investors and those looking to expand their portfolio. Don’t miss your chance to own a CASH-FLOWING, MIXED-USE MULTI-FAMILY PROPERTY in one of Willow Grove’s most active business districts!
-
2026-04-21price $469,900 911-char remark
Show marketing remark (911 chars)
PRIME MULTI-FAMILY INVESTMENT OPPORTUNITY in the heart of WILLOW GROVE! Welcome to 86 N YORK RD, a HIGH-INCOME PRODUCING MIXED-USE PROPERTY located in a BUSY COMMERCIAL CORRIDOR with STRONG VISIBILITY AND FOOT TRAFFIC. This ATTACHED ROW BUILDING offers over 3,300 SQ FT of versatile space, ideal for investors seeking STABLE CASH FLOW AND LONG-TERM VALUE. The property features THREE 1-BEDROOM RESIDENTIAL UNITS, providing consistent rental income, along with a GROUND-LEVEL COMMERCIAL SPACE CURRENTLY OPERATING AS A HAIR SALON & SPA, adding an additional revenue stream. With MULTIPLE INCOME SOURCES, a DESIRABLE LOCATION, and strong rental potential, this is an excellent opportunity for both seasoned investors and those looking to expand their portfolio. Don’t miss your chance to own a CASH-FLOWING, MIXED-USE MULTI-FAMILY PROPERTY in one of Willow Grove’s most active business districts!
-
2026-04-08$479,900 Active 911-char remark
Show marketing remark (911 chars)
PRIME MULTI-FAMILY INVESTMENT OPPORTUNITY in the heart of WILLOW GROVE! Welcome to 86 N YORK RD, a HIGH-INCOME PRODUCING MIXED-USE PROPERTY located in a BUSY COMMERCIAL CORRIDOR with STRONG VISIBILITY AND FOOT TRAFFIC. This ATTACHED ROW BUILDING offers over 3,300 SQ FT of versatile space, ideal for investors seeking STABLE CASH FLOW AND LONG-TERM VALUE. The property features THREE 1-BEDROOM RESIDENTIAL UNITS, providing consistent rental income, along with a GROUND-LEVEL COMMERCIAL SPACE CURRENTLY OPERATING AS A HAIR SALON & SPA, adding an additional revenue stream. With MULTIPLE INCOME SOURCES, a DESIRABLE LOCATION, and strong rental potential, this is an excellent opportunity for both seasoned investors and those looking to expand their portfolio. Don’t miss your chance to own a CASH-FLOWING, MIXED-USE MULTI-FAMILY PROPERTY in one of Willow Grove’s most active business districts!
ⓘ Source: listings_history table (triggers on properties + properties_extension) + one-shot
backfill from property_details.listing_events for pre-trigger history.
Nearby sold comps map
Loading sold comps map…
Walkable amenities ~0.75 mi
Loading nearby amenities…
Taxation est. · year 1
- Rental income
- $93,276
- − Mortgage interest
- −$25,767
- − Property taxes
- −$6,900
- − Insurance
- −$2,300
- − Repairs & maintenance
- −$7,462
- − Management
- −$7,462
- − Depreciation
- −$13,382
- Taxable income
- $30,003
- Est. tax owed @ 24.0%
- −$7,201
- After-tax cash flow
- $28,340/yr
For passive investors: Depreciation is non-cash, so a rental often shows a tax loss while cash-flowing — sheltering income. Rental losses are passive: they offset passive income freely, and up to $25,000/yr can offset ordinary (W-2) income if you actively participate and your MAGI is under $100k (phasing out to $0 by $150k); unused losses carry forward. On sale, claimed depreciation is recaptured at up to 25%, and gains may owe capital-gains tax (a 1031 exchange can defer both). Figures are a year-1 estimate at your 24.0% rate — not tax advice; consult a CPA.
Condition & rehab AI · 14 photos
This property is in good condition with minimal repairs needed. Painting the exterior walls and cleaning the windows can significantly improve its curb appeal and increase its value.
Value-add opportunities
- Both Paint the exterior walls — Painting the exterior walls can improve the curb appeal and increase the property's resale and rental value.
- Both Clean the windows — Clean windows can improve the property's curb appeal and increase the property's resale and rental value.
- Rental Inspect and replace HVAC filters — A clean and functioning HVAC system is essential for tenant comfort and can help attract and retain tenants.
Renovation cost estimate screening
Value-add ROI direction
- Both Paint the exterior walls — Painting the exterior walls can improve the curb appeal and increase the property's resale and rental value. ↑
- Both Clean the windows — Clean windows can improve the property's curb appeal and increase the property's resale and rental value. ↑
- Rental Inspect and replace HVAC filters — A clean and functioning HVAC system is essential for tenant comfort and can help attract and retain tenants. ↑
ⓘ Cost ranges are severity-bucket heuristics (US national rule-of-thumb). Get contractor quotes + a written scope before underwriting a rehab budget.
Schools (NCES district)
- District
- Upper Moreland Township SD
- NCES district ID
- 4224510
- Math proficiency
- 41% ▼ -15.00%
- Reading proficiency
- 62% ▼ -10.00%
- Median HH income
- $65,085
- Composite
- 45.39/100
- National rank
- #2630
- State rank
- #137 of 539 in PA
Livability — Upper Moreland
No livability data for this city. (Only ~50 U.S. cities are tracked.)
Census & demographics
- Census place
- Willow Grove, PA
- County
- Montgomery County · 712,331 people
- Metro
- Philadelphia-Camden-Wilmington, PA-NJ-DE-MD
- Population (ZIP)
- 19,662
- Household income
- $99,928
- Rent vs Own
- Severe rent burden
- 468.0
Population outlook (Montgomery County) Hauer SSP2
- Today (2025)
- 856,074 people
- By 2030
- 870,887 · +1.7%
- By 2040
- 891,195 · +4.1%
- By 2050
- 896,417 · +4.7%
- By 2075
- 903,212 · +5.5%
- By 2100
- 843,240 · -1.5%
Race, ethnicity, and origin ACS 2023
- Neighborhood character
- Predominantly White (69%)
- Race & ethnicity
- White 69% Black 13% Two or more races 10% Hispanic / Latino 6% Asian 5%
- Hispanic origin (detail)
- Mexican 1% Puerto Rican 2%
- Common ancestry
- Romanian 7% Scotch-Irish 3% Italian 2%
- Foreign-born
- 7% · Canada, China, South Korea
- Languages at home
- 90% English-only · Other Indo-European 3% Spanish 1% Other Asian/Pacific 1%
Political lean MEDSL · Montgomery
- 2024 margin
- Strong D (+22.8) · D 60.9% · R 38.1% · Other 1.1%
- 2008→2024 swing
- +2.0pp toward D · 2008: 20.8pp · 2024: 22.8pp
- All cycles
- 2024: D+22.8 2020: D+26.3 2016: D+21.1 2012: D+14.3 2008: D+20.8
Not yet ingested
- Civics
- —
Market trends
- HPI YoY
- ▼ -308.50%
- Current HPI
- 304.5963
- Rent YoY
- ▲ 3.52%
- Metro
- Philadelphia-Camden-Wilmington, PA-NJ-DE-MD
- State GDP YoY
- ▲ 1.68%
- F500 in state
- 34
Industry mix (Fortune 500 HQ in PA)
| Industry | F500 HQs | Revenue |
|---|---|---|
| Healthcare | 2 | $309B |
|
||
| Insurance | 2 | $27B |
|
||
| Telecommunications / Media | 1 | $124B |
|
||
| Industrial Distribution | 1 | $22B |
|
||
| Financial Services | 1 | $20B |
|
||
| Chemicals / Materials | 1 | $18B |
|
||
Price history
-4.1% since first listed3 events — show timeline
- 2026-05-10 Price Changed $460,000 BRIGHT MLS
- 2026-04-21 Price Changed $469,900 BRIGHT MLS
- 2026-04-08 Listed $479,900 BRIGHT MLS
Cash-flow waterfall
monthlySold comps — $/sqft
last 12 mo · ≤1 miLoading sold comps…