 Multi-family
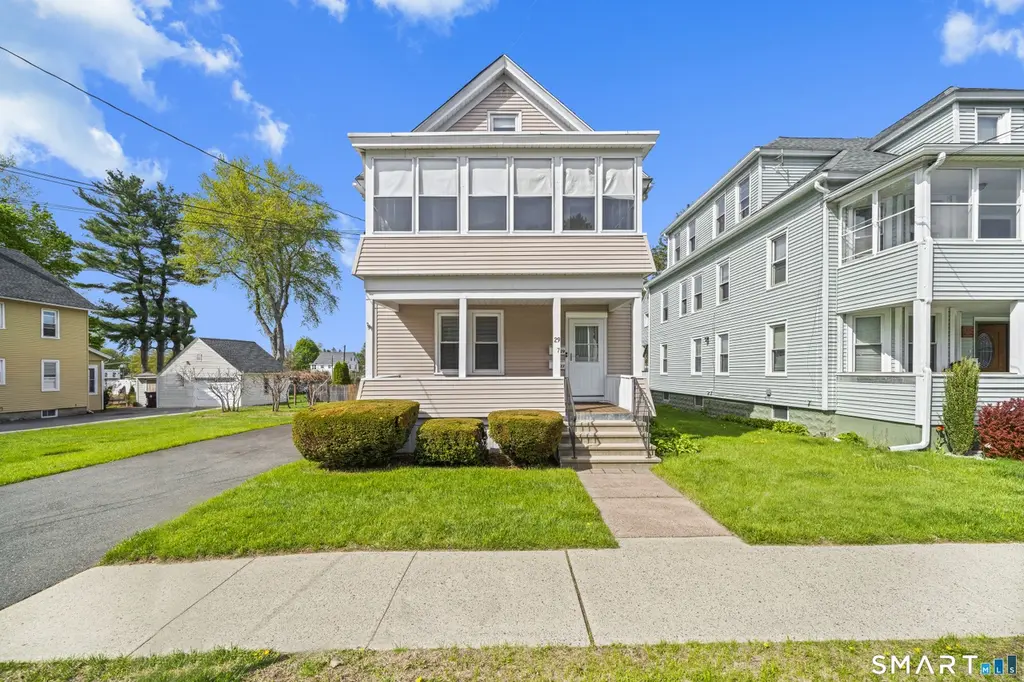
27 Park Ave · Thompsonville, CT
Flood risk 1/10 · Minimal
- FEMA flood zone
- X (unshaded)
- Chance of flooding over 30 yrs
- 0.0%
- Est. flood insurance / yr
- $473 – $860
Fire risk 1/10 · Minimal
- Est. fire insurance / yr
- $829 – $1,539
Heat risk 4/10 · Minor
- Hot days now (above 98°F)
- 7 days/yr
- Hot days in 30 yrs
- 15 days/yr
Wind risk 6/10 · Moderate
- Chance of severe wind over 30 yrs
- 27.0%
Air-quality risk 3/10 · Minor
- Unhealthy air days now
- 2 days/yr
- Unhealthy air days in 30 yrs
- 3 days/yr
Risk factors via First Street. Map © Google.
Why this score? — see what drove the D grade
The composite is a weighted blend of 9 inputs, each scored 0–100. Each bar is that input's sub-score; the figure is the points it added to the 100-point composite (weight × sub-score).
- Cash flow +14.7/30.0
- ARV discount +6.4/15.0
- DSCR +4.5/10.0
- 1% rule +4.0/10.0
- Rent growth +3.5/5.0
- Livability +3.5/5.0
- Schools +3.0/10.0
- Condition / age +2.5/5.0
- Appreciation +0.0/10.0
$365,000
🖨 Deal sheet (PDF) 📄 Offer letter ✓ Due diligence
Multi-family units
County records classify this as Multi-Family (2-4 Unit). Listing-text estimate: 1 unit. estimate disagrees with records
Listing remarks
Fantastic opportunity to own a multi-family property in Enfield, CT, just off Route 5 with quick access to highways, shopping, and local amenities. This spacious 2-story residential building sits on an extra-large lot and offers clean, move-in ready units featuring a total of 4 bedrooms, 2 full bathrooms, and 10 total rooms with excellent layout. ( See floor plans for layout ) Beautiful hardwood flooring throughout parts of the home. Each unit features functional, average-style kitchens and baths, generous storage, and comfortable living areas. Major upgrades provide peace of mind, including two brand new heating systems, two new water heaters installed in 2024, and well-maintained mechanic
Key facts
- Extra-large lot
- Hardwood flooring
- Generous storage
Tags
Property features AI
Exterior
- Parking: Detached 2-car garage
- Utilities: Public water connected; Public sewer connected; 40-gallon hot water tank; Natural gas
- Home design: Multi-family (2-family); Multi-Family For Sale
- Construction: Built with frame construction; Brick and stone foundation; Aluminum siding; Asphalt shingle roof; Tan exterior color
- Exterior features: Balcony; Porch; Covered deck; Sidewalk; Level lot
Interior
- Kitchen: No specific kitchen appliance details provided
- Bedrooms: 4 bedrooms
- Bathrooms: 2 full bathrooms
- Heating & cooling: Steam heat (natural gas); Window AC unit(s)
- Interior features: 10 total rooms; Full basement; Walk-up attic
- Laundry & utility: Washer and dryer located on second floor; Basement hookup(s); Washer/Dryer in some units
Neighborhood map
What this means for you Summary
Snapshot
- This is a 4-bed/2.0-bath multifamily listed at $365k.
Deal economics
- At list price, monthly cash flow is $96 ($1k/yr) — positive.
- The deal already cash-flows at list — no discount required.
- To meet the 1% rule (rent ≥ 1% of price), the offer needs to be $327k (10.3% below list).
- Recommended offer: $327k (10.3% below list) — sets the bar for 1% rule.
- Cap rate 6.6% vs local median 5.2% in Thompsonville — meaningfully above typical; check what's discounted (condition, days-on-market, listing class) to confirm the premium yield is real.
Location & tenants
- Location reads 69/100 on livability (#103 in CT) — a middle-class / working-renter tenant base. Strengths: health & safety A+, housing A, crime B+; Watch: amenities F, commute F, employment D-.
- Enfield School District (suburban): math 25% / reading 41% proficiency, ranked #114 of 153 in CT (top 74%) — families likely to look elsewhere, expect single-tenant / working-renter base with shorter leases.
- Zoned schools: Henry Barnard School (365 students, 46% FRL); John F. Kennedy Middle School (math 22% / reading 39%, grade F, #138 of 175 statewide, top 79%, 1,096 students, 46% FRL); Enfield High School (math 29% / reading 54%, grade F, #102 of 194 statewide, top 53%, 1,490 students, 40% FRL) — zoned schools average 44% FRL vs 29% district-wide (15 pts higher); higher-poverty schools than district average — tighter screening recommended.
- Market conditions: Rents rising (+3.9%/yr); 188 active listings in the ZIP; 9 comparable units currently listed for rent nearby; rentals lingering (median 46d on market — plan ~5-8 weeks vacancy on turnover, expect pricing pressure); 67% of comp listings sitting > 30 days — soft ceiling on asking rent; solid renter incomes; 1,867 units permitted in Capitol Planning Region in 2024 (1,399 in 5+ unit buildings).
- This rent runs 43% of the median local income ($90k/yr) — at the standard rent-burdened threshold; future hikes will face affordability resistance.
Forward outlook
- Local home prices are declining (-3.0%/yr); year-one equity from $3k of loan paydown is wiped out by about $11k of value loss. Plan a longer hold.
Negotiation context
- It's been on market 45 days — a 3% lower offer ($354k) is reasonable based on typical stale-listing flexibility.
- 2 sale attempts; this cycle's ask has dropped $25k (6%) from the opening price — seller is motivated, your offer sets the floor, not the list.
Risks & watch-outs
- Watch-outs: built in 1906 — expect roof / HVAC / electrical / plumbing capex.
- Climate carrying-cost: major wind risk, 27% chance of damaging wind over 30y — expect insurance premiums to compound above CPI over the hold.
Questions for the listing agent
- It's been on market 45 days. Have you received any prior offers? Is the seller open to a 10% concession, seller financing, or rate buy-down credit?
- Built in 1906 — when were the roof, HVAC, electrical panel, plumbing, and water heater last replaced?
- Is there a deadline driving the sale (1031 exchange, divorce, estate, relocation)? That informs how much negotiation room exists.
- The area grade is low — what's the realistic commute time and amenity access for the typical tenant pool here? Any planned neighborhood developments (good or bad) we should know about?
- What's the average days-on-market for RENTAL listings here right now (not sales)? A rising rental-DOM trend means longer vacancies and softer asking-rent achievability than the comps imply.
- What's the recent tenant-quality profile in this submarket — average credit score on applications, eviction rate, late-payment / NSF rate, and stable-employment percentage? A property-management company in the area should have these aggregated.
- How much new apartment / multifamily construction is in the pipeline within 1–3 miles? Heavy new supply (>2% of stock underway) typically softens rents 12–24 months out; light construction supports rent growth.
Investment metrics
- 1% rule
- 0.90% ✗
- Cap rate
- 6.61%
- Cash-on-cash
- 1.13%
- DSCR
- 1.05
- GRM
- 9.3
CMA / ARV
- ARV (median comp)
- $356,317
- List price
- $365,000
- Delta
- 2.44%
- Verdict
- FAIR
- Comps
- 20 within 1.0 mi
Show comp detail 4 sales within ~0.75 mi
| Address | Dist | Beds/Ba | Sqft | Sold | Price | $/sf | Match |
|---|---|---|---|---|---|---|---|
| 54 Elm St | 0.20mi | 4/2.0 | 1,960 (+14%) | 20mo | $302,000 | $154 | 51 |
| 21 Summer St | 0.15mi | 3/2.0 (-1) | 1,504 (-13%) | 20mo | $320,000 | $213 | 50 |
| 13 Keller Ave | 0.65mi | 4/2.0 | 1,584 (-8%) | 10mo | $325,000 | $205 | 48 |
| 17 Walnut St | 0.49mi | 5/2.5 (+1) | 1,557 (-10%) | 12mo | $209,000 | $134 | 45 |
Match score weights: distance 35% · size 25% · config 20% · recency 20%. Top-matched comps best support the ARV.
Projected returns pro-forma
-3.0% appreciation · 3.9% rent growth · sell at horizon
- IRR
- -13.5%
- Equity multiple
- 0.51×
- Total profit
- $-50,023
- Equity at exit
- $54,423
- IRR
- -3.2%
- Equity multiple
- 0.77×
- Total profit
- $-23,084
- Equity at exit
- $31,559
Cash invested: $102,200 (down + closing). Projections, not guarantees.
Landlord ↔ Tenant lean methodology
- Overall (STATE)
- 27 Tenant-Leaning
- State Connecticut
- 27 Tenant-Leaning · D+7
- County
- — inherits STATE
- City
- — inherits STATE
ZIP-level market 06082
- Rents YoY
- 3.9%
- Active inventory
- 188
- Price-to-rent
- 18.6×
Monthly cashflow live
- Estimated rent
- $3,273 medium interval (Pro) →
- Mortgage (P&I)
- −$1,914
- Tax from tax record
- −$424 /mo · $5,084/yr
- Insurance
- −$152
- HOA
- −$0
- Vacancy / Maint / Mgmt
- −$687
- Net cashflow
- $96
Break-even live
Sensitivity live
| Price | -10% $302 | -5% $199 | +0% $96 | +5% $-7 | +10% $-111 |
|---|---|---|---|---|---|
| Rent | -10% $-163 | -5% $-33 | +0% $96 | +5% $225 | +10% $354 |
| Rate | -1.0pp $280 | -0.5pp $189 | base $96 | +0.5pp $1 | +1.0pp $-95 |
2-unit breakdown (identical units grouped — click to expand)
| Units | Beds | Baths | Est. rent |
|---|---|---|---|
| 2× units | 2 | 1 | $3,274 |
| #1 | 2 | 1 | $1,637 |
| #2 | 2 | 1 | $1,637 |
| Total (2 units) | $3,273 | ||
UW: 25.0% down · 7.5% · 30yr · 1.5% tax · 5.0% vac · 8.0% maint · 8.0% mgmt
Financing live
Cash to close
- Down payment
- $91,250
- Closing costs
- $10,950
- Reserves months
- —
- Total cash needed
- —
Loan-product check · same deal, 3 products live
Conventional
25% down · 7.5% · 30yr
- Down + closing
- —
- Monthly P&I
- —
- Monthly cashflow
- —
- DSCR
- —
- Eligible?
- —
Personal DTI + credit; lowest rate.
DSCR
20% down · 8.5% · 30yr
- Down + closing
- —
- Monthly P&I
- —
- Monthly cashflow
- —
- DSCR
- —
- Eligible?
- —
No personal income docs; deal must DSCR.
Hard money
10% down · 12.0% · 12mo
- Down + closing
- —
- Monthly P&I
- —
- Monthly cashflow
- —
- DSCR
- —
- Eligible?
- —
Short-term bridge; refi at stabilization.
Rent comps 9 comps
| Address | Beds | Baths | Sqft | Rent | $/sqft | DOM | Units | Dist |
|---|---|---|---|---|---|---|---|---|
| 692 Enfield St Enfield, CT | 3.0 | 2.0 | 1370 | $2,100 | $1.53 | 45d | 1 | 0.24mi |
| 42 Hartford Ave Enfield, CT | 4.0 | 1.0 | 1538 | $2,400 | $1.56 | 45d | 1 | 0.35mi |
| 22 Ohear Ave Enfield, CT | 3.0 | 2.0 | 1148 | $2,000 | $1.74 | 45d | 1 | 0.38mi |
| 49 Whitworth St Enfield, CT | 3.0 | 1.5 | 1191 | $2,000 | $1.68 | 3d | 1 | 0.47mi |
| 54 Prospect St Enfield, CT | 4.0 | 2.0 | 2016 | $3,200 | $1.59 | 3d | 1 | 0.60mi |
| 36B Maple Ave Enfield, CT | 3.0 | 1.5 | 1800 | $1,775 | $0.99 | 45d | 1 | 0.68mi |
| 44 Saint James Ave Enfield, CT | 3.0 | 2.0 | 1500 | $2,700 | $1.80 | 45d | 1 | 0.70mi |
| 37 Shad Row #37 Suffield, CT | 3.0 | 2.5 | 2000 | $2,700 | $1.35 | 3d | 1 | 1.17mi |
| 3 Pebblestone Cir #3 Suffield, CT | 3.0 | 2.5 | 1320 | $2,550 | $1.93 | 45d | 1 | 1.26mi |
Listing history 12 events
-
2026-06-15statusdays on market $365,000 Under Contract 45 DOM
-
2026-06-13days on market $365,000 Active 44 DOM
-
2026-06-10days on market $365,000 Active 41 DOM
-
2026-06-09days on market $365,000 Active 40 DOM
-
2026-06-08days on market $365,000 Active 39 DOM
-
2026-06-07days on market $365,000 Active 38 DOM
-
2026-06-05days on market $365,000 Active 35 DOM
-
2026-06-03days on market $365,000 Active 34 DOM
-
2026-06-02days on market $365,000 Active 33 DOM
-
2026-06-01days on market $365,000 Active 32 DOM
-
2026-05-31days on market $365,000 Active 31 DOM
-
2026-05-01$390,000 Active 969-char remark
ⓘ Source: listings_history table (triggers on properties + properties_extension) + one-shot
backfill from property_details.listing_events for pre-trigger history.
Tax reassessment forecast CT · Partial reset (capped growth)
- Current annual tax
- $5,084 · $424/mo
- Projected year-2 tax
- $6,448 · $537/mo
- Expected delta
- +$1,364/yr (+$114/mo · 26.8%)
ⓘ Screening estimate from a state-policy table — verify with the county assessor before closing.
Climate risk First Street
- Flood 1/10 Low FEMA zone X (unshaded) · 0% chance over 30 yrs
- Wildfire 1/10 Low
- Heat 4/10 Moderate 7 d/yr ≥98°F today · 15 d/yr by 30 yrs out
- Wind 6/10 Major 27% chance of damaging wind over 30 yrs
- Air quality 3/10 Moderate 2 unhealthy d/yr today · 3 by 30 yrs out
Nearby sold comps map
Loading sold comps map…
Walkable amenities ~0.75 mi
Loading nearby amenities…
Taxation est. · year 1
- Rental income
- $39,276
- − Mortgage interest
- −$20,446
- − Property taxes
- −$5,084
- − Insurance
- −$1,825
- − Repairs & maintenance
- −$3,142
- − Management
- −$3,142
- − Depreciation
- −$10,618
- Taxable loss
- −$4,981
- Est. tax savings @ 24.0%
- +$1,195
- After-tax cash flow
- $2,345/yr
For passive investors: Depreciation is non-cash, so a rental often shows a tax loss while cash-flowing — sheltering income. Rental losses are passive: they offset passive income freely, and up to $25,000/yr can offset ordinary (W-2) income if you actively participate and your MAGI is under $100k (phasing out to $0 by $150k); unused losses carry forward. On sale, claimed depreciation is recaptured at up to 25%, and gains may owe capital-gains tax (a 1031 exchange can defer both). Figures are a year-1 estimate at your 24.0% rate — not tax advice; consult a CPA.
Schools (NCES district)
- District
- Enfield School District
- NCES district ID
- 0901470
- Math proficiency
- 25% ▼ -14.00%
- Reading proficiency
- 41% ▼ -10.00%
- Median HH income
- $68,750
- Composite
- 30.42/100
- National rank
- #6238
- State rank
- #114 of 153 in CT
Livability — Thompsonville
- Score
- 69/100
- State rank
- #103
- US rank
- #8941
Category grades
Schools grade is shown separately in the Schools card above.
Census & demographics
- Census place
- Thompsonville, CT
- County
- Hartford County · 754,208 people
- Metro
- Hartford-East Hartford-Middletown, CT
- Population (ZIP)
- 41,090
- Household income
- $90,404
- Rent vs Own
- Severe rent burden
- 954.0
Population outlook (Capitol County) Hauer SSP2
- By 2040
- 1,063,519
Race, ethnicity, and origin ACS 2023
- Neighborhood character
- Predominantly White (76%)
- Race & ethnicity
- White 76% Hispanic / Latino 11% Two or more races 9% Black 5% Asian 2%
- Hispanic origin (detail)
- Mexican 1% Puerto Rican 7%
- Common ancestry
- Romanian 10% Lithuanian 9% Slovak 2%
- Foreign-born
- 6% · Canada, Jamaica
- Languages at home
- 89% English-only · Spanish 5% Other Indo-European 2% Russian/Polish/Slavic 1%
Political lean MEDSL · Capitol
- 2024 margin
- Strong D (+21.9) · D 60.1% · R 38.2% · Other 1.7%
- All cycles
- 2024: D+21.9
Not yet ingested
- Civics
- —
Market trends
- HPI YoY
- ▼ -494.72%
- Current HPI
- 192.4011
- Rent YoY
- ▲ 3.90%
- Metro
- Hartford-East Hartford-Middletown, CT
- State GDP YoY
- ▲ 1.06%
- F500 in state
- 38
Industry mix (Fortune 500 HQ in CT)
| Industry | F500 HQs | Revenue |
|---|---|---|
| Industrial Machinery | 4 | $38B |
|
||
| Insurance | 3 | $71B |
|
||
| Financial Services | 2 | $25B |
|
||
| Transportation / Logistics | 2 | $18B |
|
||
| Healthcare | 1 | $247B |
|
||
| Telecommunications | 1 | $55B |
|
||
Price history
-6.4% since first listed5 events — show timeline
- 2026-06-14 Pending — Smart MLS
- 2026-05-26 Price Changed $365,000 Smart MLS
- 2026-05-26 Relisted — Smart MLS
- 2026-05-22 Contingent — Smart MLS
- 2026-05-01 Listed $390,000 Smart MLS
Property tax history
+1.5%/yrLatest (2025): $5,084 · +2.7% YoY. Source: county tax records.
Cash-flow waterfall
monthlySold comps — $/sqft
last 12 mo · ≤1 miLoading sold comps…