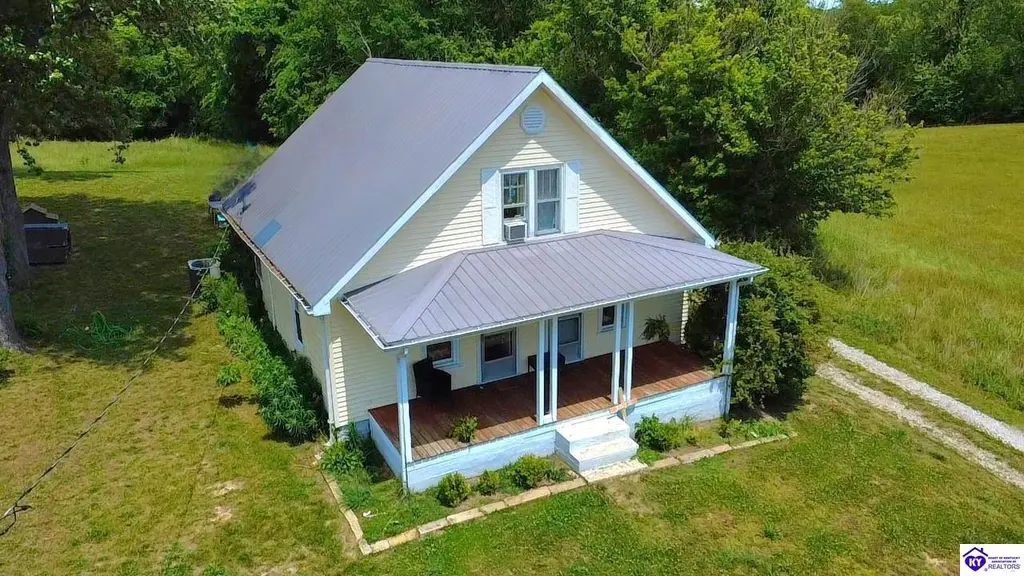
354 Eve Hwy · Hardyville, KY
Flood risk 3/10 · Minor
- FEMA flood zone
- X (unshaded)
- Chance of flooding over 30 yrs
- 0.2%
- Est. flood insurance / yr
- $507 – $1,088
Fire risk 4/10 · Minor
- Est. fire insurance / yr
- $839 – $1,559
Heat risk 5/10 · Moderate
- Hot days now (above 107°F)
- 7 days/yr
- Hot days in 30 yrs
- 20 days/yr
Wind risk 2/10 · Minimal
- Chance of severe wind over 30 yrs
- 4.0%
Air-quality risk 2/10 · Minimal
- Unhealthy air days now
- 0 days/yr
- Unhealthy air days in 30 yrs
- 1 days/yr
Risk factors via First Street. Map © Google.
Why this score? — see what drove the D grade
The composite is a weighted blend of 9 inputs, each scored 0–100. Each bar is that input's sub-score; the figure is the points it added to the 100-point composite (weight × sub-score).
- Cash flow +12.8/30.0
- ARV discount +7.5/15.0
- Appreciation +5.9/10.0
- DSCR +3.8/10.0
- 1% rule +2.8/10.0
- Rent growth +2.5/5.0
- Livability +2.5/5.0
- Condition / age +2.5/5.0
- Schools +2.4/10.0
$149,000
🖨 Deal sheet (PDF) 📄 Offer letter ✓ Due diligence
Listing remarks
Country charm, peaceful views, and easy access to the Green River, this 3 bedroom, 1 bath farmhouse-style home offers the perfect blend of comfort and outdoor living. Situated on approximately 2.5 acres, this property features scenic rolling countryside views from the covered front porch, creating the ideal place to relax and unwind. Inside, you’ll find over 1,300 square feet of living space with a spacious living room, large eat-in kitchen with island seating, and a functional layout full of character and warmth. The metal roof and covered porch add to the home’s classic farmhouse appeal. Conveniently located just 2.4 miles from Lynn Camp Boat Launch on the Green River, this pr
Key facts
- Covered front porch
- Large eat-in kitchen
- Metal roof
Tags
Property features AI
Finance
- Other: Approximately 2.5 acres
Exterior
- Utilities: Septic tank
- Home design: Single-family residence; Residential property
- Construction: Vinyl siding; Metal roof
- Exterior features: Covered porch/patio
Interior
- Kitchen: Dishwasher; Range; Oven; Refrigerator
- Flooring: Hardwood
- Bathrooms: 1 full bathroom (main level)
- Heating & cooling: Central air; Window unit(s); Electric heating
- Interior features: Eat-in kitchen
- Laundry & utility: Dedicated laundry room; Electric water heater
Neighborhood map
What this means for you Summary
Snapshot
- This is a 3-bed/1.0-bath single-family listed at $149k.
Deal economics
- At list price, monthly cash flow is $-14 ($-172/yr) — negative.
- To cash-flow at today's rent, offer at most $146k (1.7% below list).
- To meet the 1% rule (rent ≥ 1% of price), the offer needs to be $117k (21.6% below list).
- Recommended offer: $117k (21.6% below list) — sets the bar for 1% rule.
Location & tenants
- Location reads 49/100 on livability (#508 in KY) — a working-class tenant base; expect higher turnover. Strengths: cost of living A+, crime A; Watch: amenities F, commute F, employment F.
- Hart County (rural): math 21% / reading 38% proficiency, ranked #119 of 165 in KY (top 72%) — low school quality limits family demand, transient renter base, plan for 1-2y turnover.
- Zoned schools: Memorial Elementary School (math 22% / reading 37%, grade F, #393 of 676 statewide, top 63%, 348 students, 66% FRL); Hart County High School (math 22% / reading 32%, grade F, #158 of 254 statewide, top 68%, 679 students, 55% FRL).
- Market conditions: 24 active listings in the ZIP; 79 units permitted in Hart County in 2024 (60 in 5+ unit buildings).
Forward outlook
- In year one you build about $4k of equity ($1k loan paydown + $3k appreciation (1.8% local appreciation)).
- At projected returns (1.8% appreciation + 3.0% rent growth), your $42k cash investment doubles in ~9 years — after that, you're playing with house money.
- By year 9, paydown + projected appreciation supports a ~$32k cash-out refi (75% LTV) — recoverable capital for the next deal without selling this one.
Negotiation context
- It's been on market 36 days — a 3% lower offer ($145k) is reasonable based on typical stale-listing flexibility.
- 2 sale attempts since 3y ago; this cycle's ask has dropped $61k (29%) from the opening price — seller is motivated, your offer sets the floor, not the list.
Risks & watch-outs
- Watch-outs: built in 1950 — expect roof / HVAC / electrical / plumbing capex.
- Climate carrying-cost: extreme-heat days projected 7→20/yr by 2055 (HVAC capex compounding) — expect insurance premiums to compound above CPI over the hold.
Questions for the listing agent
- What do current leases actually rent for vs. the listed asking? Can we see a recent rent roll and the last 12 months of T-12 income?
- It's been on market 36 days. Have you received any prior offers? Is the seller open to a 22% concession, seller financing, or rate buy-down credit?
- Built in 1950 — when were the roof, HVAC, electrical panel, plumbing, and water heater last replaced?
- Is there a deadline driving the sale (1031 exchange, divorce, estate, relocation)? That informs how much negotiation room exists.
- Schools are D-rated, which usually means shorter tenancies and higher turnover. Who's the typical renter profile here, and what's been the actual vacancy rate?
- The area grade is low — what's the realistic commute time and amenity access for the typical tenant pool here? Any planned neighborhood developments (good or bad) we should know about?
- What's the average days-on-market for RENTAL listings here right now (not sales)? A rising rental-DOM trend means longer vacancies and softer asking-rent achievability than the comps imply.
- What's the recent tenant-quality profile in this submarket — average credit score on applications, eviction rate, late-payment / NSF rate, and stable-employment percentage? A property-management company in the area should have these aggregated.
- How much new for-sale + rental construction is in the pipeline within 1–3 miles? Heavy new supply typically softens prices + rents 12–24 months out; constrained supply supports both.
Investment metrics
- 1% rule
- 0.78% ✗
- Cap rate
- 6.18%
- Cash-on-cash
- -0.41%
- DSCR
- 0.98
- GRM
- 10.6
CMA / ARV
No comps found within radius.
Projected returns pro-forma
1.81% appreciation · 3.0% rent growth · sell at horizon
- IRR
- 3.5%
- Equity multiple
- 1.19×
- Total profit
- $7,804
- Equity at exit
- $57,219
- IRR
- 7.4%
- Equity multiple
- 1.98×
- Total profit
- $41,046
- Equity at exit
- $81,222
Cash invested: $41,720 (down + closing). Projections, not guarantees.
Landlord ↔ Tenant lean methodology
- Overall (STATE)
- 83 Strongly Landlord-Friendly
- State Kentucky
- 83 Strongly Landlord-Friendly · R+16
- County
- — inherits STATE
- City
- — inherits STATE
ZIP-level market 42757
- Home prices YoY
- 0.6%
- Active inventory
- 24
- Price-to-rent
- 10.6×
Monthly cashflow live
- Estimated rent
- $1,168 medium interval (Pro) →
- Mortgage (P&I)
- −$781
- Tax from tax record
- −$94 /mo · $1,127/yr
- Insurance
- −$62
- HOA
- −$0
- Vacancy / Maint / Mgmt
- −$245
- Net cashflow
- $-14
Break-even live
Sensitivity live
| Price | -10% $70 | -5% $28 | +0% $-14 | +5% $-57 | +10% $-99 |
|---|---|---|---|---|---|
| Rent | -10% $-107 | -5% $-61 | +0% $-14 | +5% $32 | +10% $78 |
| Rate | -1.0pp $61 | -0.5pp $24 | base $-14 | +0.5pp $-53 | +1.0pp $-92 |
UW: 25.0% down · 7.5% · 30yr · 1.5% tax · 5.0% vac · 8.0% maint · 8.0% mgmt
Financing live
Cash to close
- Down payment
- $37,250
- Closing costs
- $4,470
- Reserves months
- —
- Total cash needed
- —
Loan-product check · same deal, 3 products live
Conventional
25% down · 7.5% · 30yr
- Down + closing
- —
- Monthly P&I
- —
- Monthly cashflow
- —
- DSCR
- —
- Eligible?
- —
Personal DTI + credit; lowest rate.
DSCR
20% down · 8.5% · 30yr
- Down + closing
- —
- Monthly P&I
- —
- Monthly cashflow
- —
- DSCR
- —
- Eligible?
- —
No personal income docs; deal must DSCR.
Hard money
10% down · 12.0% · 12mo
- Down + closing
- —
- Monthly P&I
- —
- Monthly cashflow
- —
- DSCR
- —
- Eligible?
- —
Short-term bridge; refi at stabilization.
Listing history 23 events
-
2026-06-22days on market $149,000 Active 36 DOM
-
2026-06-21days on market $149,000 Active 35 DOM
-
2026-06-21days on market $149,000 Active 34 DOM
-
2026-06-18days on market $149,000 Active 32 DOM
-
2026-06-18price $149,000 Active 31 DOM
-
2026-06-17days on market $179,000 Active 31 DOM
-
2026-06-16days on market $179,000 Active 30 DOM
-
2026-06-15days on market $179,000 Active 29 DOM
-
2026-06-13days on market $179,000 Active 27 DOM
-
2026-06-12days on market $179,000 Active 26 DOM
-
2026-06-09days on market $179,000 Active 23 DOM
-
2026-06-08days on market $179,000 Active 22 DOM
-
2026-06-07days on market $179,000 Active 21 DOM
-
2026-06-05days on market $179,000 Active 19 DOM
-
2026-06-04days on market $179,000 Active 17 DOM
-
2026-06-02days on market $179,000 Active 16 DOM
-
2026-06-01days on market $179,000 Active 15 DOM
-
2026-05-31days on market $179,000 Active 14 DOM
-
2026-05-31days on market $179,000 Active 13 DOM
-
2026-05-18$210,000 Active
-
2023-07-01status Pending
-
2023-06-30historical
-
2023-06-27$138,900 Active
ⓘ Source: listings_history table (triggers on properties + properties_extension) + one-shot
backfill from property_details.listing_events for pre-trigger history.
Tax reassessment forecast KY · Resets to sale price
- Current annual tax
- $1,127 · $94/mo
- Projected year-2 tax
- $1,281 · $107/mo
- Expected delta
- +$155/yr (+$13/mo · 13.7%)
ⓘ Screening estimate from a state-policy table — verify with the county assessor before closing.
Climate risk First Street
- Flood 3/10 Moderate FEMA zone X (unshaded) · 20% chance over 30 yrs
- Wildfire 4/10 Moderate
- Heat 5/10 Major 7 d/yr ≥107°F today · 20 d/yr by 30 yrs out
- Wind 2/10 Low 4% chance of damaging wind over 30 yrs
- Air quality 2/10 Low 0 unhealthy d/yr today · 1 by 30 yrs out
Nearby sold comps map
Loading sold comps map…
Walkable amenities ~0.75 mi
Loading nearby amenities…
Taxation est. · year 1
- Rental income
- $14,020
- − Mortgage interest
- −$8,346
- − Property taxes
- −$1,127
- − Insurance
- −$745
- − Repairs & maintenance
- −$1,122
- − Management
- −$1,122
- − Depreciation
- −$4,335
- Taxable loss
- −$2,776
- Est. tax savings @ 24.0%
- +$666
- After-tax cash flow
- $494/yr
For passive investors: Depreciation is non-cash, so a rental often shows a tax loss while cash-flowing — sheltering income. Rental losses are passive: they offset passive income freely, and up to $25,000/yr can offset ordinary (W-2) income if you actively participate and your MAGI is under $100k (phasing out to $0 by $150k); unused losses carry forward. On sale, claimed depreciation is recaptured at up to 25%, and gains may owe capital-gains tax (a 1031 exchange can defer both). Figures are a year-1 estimate at your 24.0% rate — not tax advice; consult a CPA.
Schools (NCES district)
- District
- Hart County
- NCES district ID
- 2102640
- Math proficiency
- 21% ▼ -21.00%
- Reading proficiency
- 38% ▼ -20.00%
- Median HH income
- $34,931
- Composite
- 24.28/100
- National rank
- #7714
- State rank
- #119 of 165 in KY
Livability — Hardyville
- Score
- 49/100
- State rank
- #508
- US rank
- #25820
Category grades
Schools grade is shown separately in the Schools card above.
Census & demographics
- Population (ZIP)
- 2,846
Population outlook (Hart County) Hauer SSP2
- Today (2025)
- 18,897 people
- By 2030
- 19,008 · +0.6%
- By 2040
- 19,032 · +0.7%
- By 2050
- 18,584 · -1.7%
- By 2075
- 17,303 · -8.4%
- By 2100
- 14,894 · -21.2%
Race, ethnicity, and origin ACS 2023
- Neighborhood character
- Predominantly White (89%)
- Race & ethnicity
- White 89% Black 6% Two or more races 5% Hispanic / Latino 1%
- Common ancestry
- Iranian 3% Italian 2% Slovak 2%
- Foreign-born
- 1% · Canada
- Languages at home
- 99% English-only · Spanish 1%
Political lean MEDSL · Hart
- 2024 margin
- Solid R (+60.0) · D 19.5% · R 79.6%
- 2008→2024 swing
- -29.1pp toward R · 2008: -30.9pp · 2024: -60.0pp
- All cycles
- 2024: R+60.0 2020: R+53.0 2016: R+49.4 2012: R+29.8 2008: R+30.9
Not yet ingested
- Civics
- —
Market trends
- HPI YoY
- ▲ 1.81%
- Current HPI
- 319.5783
- Rent YoY
- —
- Metro
- —
- State GDP YoY
- ▲ 1.81%
- F500 in state
- 4
Industry mix (Fortune 500 HQ in KY)
| Industry | F500 HQs | Revenue |
|---|---|---|
| Healthcare | 1 | $118B |
|
||
| Food / Beverage | 1 | $7B |
|
||
Price history
+51.2% since first listed4 events — show timeline
- 2026-05-18 Listed $210,000 HKARMLS
- 2023-07-01 Pending — Metro Search MLS
- 2023-06-30 Listing Removed — Metro Search MLS
- 2023-06-27 Listed $138,900 Metro Search MLS
Property tax history
+10.6%/yrLatest (2025): $1,127 · +2.2% YoY. Source: county tax records.
Cash-flow waterfall
monthlySold comps — $/sqft
last 12 mo · ≤1 miLoading sold comps…