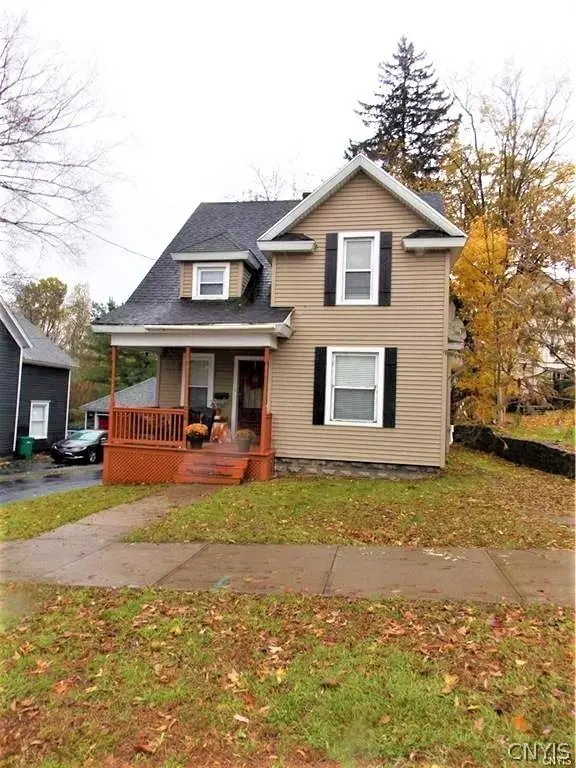
206 S James St · Carthage, NY
Flood risk 1/10 · Minimal
- FEMA flood zone
- X
- Chance of flooding over 30 yrs
- 0.0%
- Est. flood insurance / yr
- $473 – $860
Fire risk 3/10 · Minor
- Est. fire insurance / yr
- $691 – $1,283
Heat risk 1/10 · Minimal
- Hot days now (above 92°F)
- 7 days/yr
- Hot days in 30 yrs
- 16 days/yr
Wind risk 1/10 · Minimal
- Chance of severe wind over 30 yrs
- —
Air-quality risk 2/10 · Minimal
- Unhealthy air days now
- 0 days/yr
- Unhealthy air days in 30 yrs
- 1 days/yr
Risk factors via First Street. Map © Google.
Why this score? — see what drove the D- grade
The composite is a weighted blend of 9 inputs, each scored 0–100. Each bar is that input's sub-score; the figure is the points it added to the 100-point composite (weight × sub-score).
- Appreciation +10.0/10.0
- Cash flow +6.6/30.0
- ARV discount +6.2/15.0
- Livability +3.5/5.0
- Schools +3.3/10.0
- Rent growth +2.5/5.0
- Condition / age +2.5/5.0
- 1% rule +2.3/10.0
- DSCR +0.9/10.0
$189,900
🖨 Deal sheet (PDF) 📄 Offer letter ✓ Due diligence
Listing remarks MLS
Turn-key 4 bedroom 1.5 bathroom home. This village home is full of original charm, yet updated with the modern flare you are looking for. Formal dining room, NEW KITCHEN, and first floor bedroom/office with a half bathroom. New porch and huge back deck, new siding, new windows and a new roof complete this home.
Key facts
- Covered front porch
- Blacktop driveway
- Public sewer
Tags
Property features AI
Exterior
- Parking: No garage
- Utilities: Public water connected; Sewer connected
- Home design: Single-story residence; Resale property; Vinyl siding
- Construction: Vinyl siding construction; Existing (previously built)
- Exterior features: Blacktop driveway; Rectangular lot (approx. 50 x 105)
Interior
- Kitchen: See remarks regarding kitchen appliances
- Bedrooms: One main-level bedroom
- Flooring: Carpet; Ceramic tile; Hardwood; Varies
- Bathrooms: One full bathroom; One half bathroom (main level)
- Heating & cooling: Gas forced-air heating
- Interior features: Carpet, ceramic tile, hardwood, and varied flooring throughout; Full basement
- Laundry & utility: Laundry located in the basement; Gas water heater
Neighborhood map
What this means for you Summary
Snapshot
- This is a 3-bed/1.5-bath single-family listed at $190k.
Deal economics
- At list price, monthly cash flow is $-310 ($-4k/yr) — negative.
- To cash-flow at today's rent, offer at most $135k (28.9% below list).
- To meet the 1% rule (rent ≥ 1% of price), the offer needs to be $139k (26.9% below list).
- Recommended offer: $135k (28.9% below list) — sets the bar for cash-flow.
- Cap rate 4.3% vs local median 5.4% in Carthage — below-typical yield; the buyer is paying a premium for something (appreciation thesis, condition, location) that the cap rate doesn't capture.
Location & tenants
- Location reads 69/100 on livability (#506 in NY) — a middle-class / working-renter tenant base. Strengths: health & safety A+, cost of living A, crime B; Watch: schools C-, employment D+, amenities F.
- Carthage Central School District (rural): math 30% / reading 46% proficiency, ranked #539 of 590 in NY (top 91%) — families likely to look elsewhere, expect single-tenant / working-renter base with shorter leases.
- Market conditions: 78 active listings in the ZIP; 1 comparable units currently listed for rent nearby; 196 units permitted in Jefferson County in 2024 (0 in 5+ unit buildings).
Forward outlook
- In year one you build about $20k of equity ($1k loan paydown + $19k appreciation (10.0% local appreciation)).
- Jefferson County population projected at -12% by 2050 — secular population decline; favor cash flow + early exit over multi-decade hold.
- By year 2, paydown + projected appreciation supports a ~$33k cash-out refi (75% LTV) — recoverable capital for the next deal without selling this one.
Negotiation context
- Only 11 days on market — expect competitive offers; lowballing is unlikely to land.
- 5 sale attempts since 19y ago with the ask held roughly flat each time — persistent listings suggest the price (not the market) is what's stuck; bring a comps-based counter.
- Current owner paid $146k; 30% above their basis — modest negotiation headroom, anchor on the comps not their cost.
Risks & watch-outs
- Watch-outs: built in 1907 — expect roof / HVAC / electrical / plumbing capex.
Questions for the listing agent
- What do current leases actually rent for vs. the listed asking? Can we see a recent rent roll and the last 12 months of T-12 income?
- Built in 1907 — when were the roof, HVAC, electrical panel, plumbing, and water heater last replaced?
- Is there a deadline driving the sale (1031 exchange, divorce, estate, relocation)? That informs how much negotiation room exists.
- The area grade is low — what's the realistic commute time and amenity access for the typical tenant pool here? Any planned neighborhood developments (good or bad) we should know about?
- What's the average days-on-market for RENTAL listings here right now (not sales)? A rising rental-DOM trend means longer vacancies and softer asking-rent achievability than the comps imply.
- What's the recent tenant-quality profile in this submarket — average credit score on applications, eviction rate, late-payment / NSF rate, and stable-employment percentage? A property-management company in the area should have these aggregated.
- How much new for-sale + rental construction is in the pipeline within 1–3 miles? Heavy new supply typically softens prices + rents 12–24 months out; constrained supply supports both.
Investment metrics
- 1% rule
- 0.73% ✗
- Cap rate
- 4.33%
- Cash-on-cash
- -7.00%
- DSCR
- 0.69
- GRM
- 11.4
CMA / ARV
- ARV (on-the-fly)
- $184,728
- Comps found
- 12
Show comp detail 12 sales within ~0.75 mi
| Address | Dist | Beds/Ba | Sqft | Sold | Price | $/sf | Match |
|---|---|---|---|---|---|---|---|
| 228 Church St | 0.27mi | 4/2.0 (+1) | 1,400 (-2%) | 6mo | $159,900 | $114 | 71 |
| 861 State St | 0.32mi | 3/1.5 | 1,540 (+8%) | 4mo | $180,000 | $117 | 69 |
| 622 Alexandria St | 0.42mi | 3/1.0 | 1,356 (-5%) | 0mo | $175,000 | $129 | 69 |
| 223 S Washington St | 0.17mi | 3/1.5 | 1,570 (+10%) | 9mo | $220,000 | $140 | 69 |
| 227 S James St | 0.06mi | 3/1.5 | 1,640 (+14%) | 8mo | $151,000 | $92 | 66 |
| 622 Fulton St | 0.26mi | 3/2.0 | 1,244 (-13%) | 1mo | $190,000 | $153 | 63 |
| 720 Elm St | 0.24mi | 3/1.5 | 1,620 (+13%) | 8mo | $262,000 | $162 | 61 |
| 51 Champion St | 0.72mi | 3/1.0 | 1,392 (-3%) | 0mo | $215,000 | $154 | 60 |
| 934 Alexandria St | 0.66mi | 3/2.0 | 1,384 (-3%) | 4mo | $209,500 | $151 | 58 |
| 624 Adelaide St | 0.70mi | 4/2.0 (+1) | 1,495 (+4%) | 10mo | $139,900 | $94 | 45 |
| 20392 County Route 45 | 0.69mi | 4/1.0 (+1) | 1,536 (+7%) | 9mo | $151,000 | $98 | 41 |
| 642 W End Ave | 0.65mi | 3/1.0 | 1,240 (-13%) | 11mo | $55,000 | $44 | 36 |
Match score weights: distance 35% · size 25% · config 20% · recency 20%. Top-matched comps best support the ARV.
Projected returns pro-forma
10.0% appreciation · 3.0% rent growth · sell at horizon
- IRR
- 19.3%
- Equity multiple
- 2.57×
- Total profit
- $83,741
- Equity at exit
- $171,077
- IRR
- 17.8%
- Equity multiple
- 5.93×
- Total profit
- $262,301
- Equity at exit
- $368,934
Cash invested: $53,172 (down + closing). Projections, not guarantees.
Landlord ↔ Tenant lean methodology
- Overall (STATE)
- 15 Strongly Tenant-Friendly
- State New York
- 15 Strongly Tenant-Friendly · D+10
- County
- — inherits STATE
- City
- — inherits STATE
ZIP-level market 13619
- Home prices YoY
- 26.0%
- Active inventory
- 78
- Price-to-rent
- 11.4×
Monthly cashflow live
- Estimated rent
- $1,388 medium interval (Pro) →
- Mortgage (P&I)
- −$996
- Tax from tax record
- −$332 /mo · $3,985/yr
- Insurance
- −$79
- HOA
- −$0
- Vacancy / Maint / Mgmt
- −$292
- Net cashflow
- $-310
Break-even live
Sensitivity live
| Price | -10% $-203 | -5% $-257 | +0% $-310 | +5% $-364 | +10% $-418 |
|---|---|---|---|---|---|
| Rent | -10% $-420 | -5% $-365 | +0% $-310 | +5% $-255 | +10% $-201 |
| Rate | -1.0pp $-215 | -0.5pp $-262 | base $-310 | +0.5pp $-360 | +1.0pp $-410 |
UW: 25.0% down · 7.5% · 30yr · 1.5% tax · 5.0% vac · 8.0% maint · 8.0% mgmt
Financing live
Cash to close
- Down payment
- $47,475
- Closing costs
- $5,697
- Reserves months
- —
- Total cash needed
- —
Loan-product check · same deal, 3 products live
Conventional
25% down · 7.5% · 30yr
- Down + closing
- —
- Monthly P&I
- —
- Monthly cashflow
- —
- DSCR
- —
- Eligible?
- —
Personal DTI + credit; lowest rate.
DSCR
20% down · 8.5% · 30yr
- Down + closing
- —
- Monthly P&I
- —
- Monthly cashflow
- —
- DSCR
- —
- Eligible?
- —
No personal income docs; deal must DSCR.
Hard money
10% down · 12.0% · 12mo
- Down + closing
- —
- Monthly P&I
- —
- Monthly cashflow
- —
- DSCR
- —
- Eligible?
- —
Short-term bridge; refi at stabilization.
Rent comps 1 comps
| Address | Beds | Baths | Sqft | Rent | $/sqft | DOM | Units | Dist |
|---|---|---|---|---|---|---|---|---|
| 719 Alexandria St Unit 719 Carthage, NY | 3.0 | 1.0 | 1100 | $995 | $0.90 | 44d | 1 | 0.53mi |
Listing history 9 events
-
2026-06-21days on market $189,900 Active 11 DOM
-
2026-06-19days on market $189,900 Active 9 DOM
-
2026-06-18days on market $189,900 Active 8 DOM
-
2026-06-17days on market $189,900 Active 7 DOM
-
2026-06-16days on market $189,900 Active 6 DOM
-
2026-06-15days on market $189,900 Active 5 DOM
-
2026-06-14days on market $189,900 Active 3 DOM
-
2026-06-12remarks 687-char remark
-
2026-06-12$189,900 Active 2 DOM
ⓘ Source: listings_history table (triggers on properties + properties_extension) + one-shot
backfill from property_details.listing_events for pre-trigger history.
Tax reassessment forecast NY · Partial reset (capped growth)
- Current annual tax
- $3,985 · $332/mo
- Projected year-2 tax
- $3,985 · $332/mo
- Expected delta
- $0/yr ($0/mo · 0.0%)
ⓘ Screening estimate from a state-policy table — verify with the county assessor before closing.
Climate risk First Street
- Flood 1/10 Low FEMA zone X · 0% chance over 30 yrs
- Wildfire 3/10 Moderate
- Heat 1/10 Low 7 d/yr ≥92°F today · 16 d/yr by 30 yrs out
- Wind 1/10 Low
- Air quality 2/10 Low 0 unhealthy d/yr today · 1 by 30 yrs out
Nearby sold comps map
Loading sold comps map…
Walkable amenities ~0.75 mi
Loading nearby amenities…
Taxation est. · year 1
- Rental income
- $16,659
- − Mortgage interest
- −$10,637
- − Property taxes
- −$3,985
- − Insurance
- −$950
- − Repairs & maintenance
- −$1,333
- − Management
- −$1,333
- − Depreciation
- −$5,524
- Taxable loss
- −$7,102
- Est. tax savings @ 24.0%
- +$1,704
- After-tax cash flow
- $-2,019/yr
For passive investors: Depreciation is non-cash, so a rental often shows a tax loss while cash-flowing — sheltering income. Rental losses are passive: they offset passive income freely, and up to $25,000/yr can offset ordinary (W-2) income if you actively participate and your MAGI is under $100k (phasing out to $0 by $150k); unused losses carry forward. On sale, claimed depreciation is recaptured at up to 25%, and gains may owe capital-gains tax (a 1031 exchange can defer both). Figures are a year-1 estimate at your 24.0% rate — not tax advice; consult a CPA.
Schools (NCES district)
- District
- Carthage Central School District
- NCES district ID
- 3606630
- Math proficiency
- 30% ▼ -18.00%
- Reading proficiency
- 46% ▲ 2.00%
- Median HH income
- $48,450
- Composite
- 32.63/100
- National rank
- #5668
- State rank
- #539 of 590 in NY
Livability — Carthage
- Score
- 69/100
- State rank
- #506
- US rank
- #8895
Category grades
Schools grade is shown separately in the Schools card above.
Census & demographics
- Census place
- Carthage, NY
- County
- Jefferson County · 47,417 people
- City population
- 10,578
- Metro
- Watertown-Fort Drum, NY
- Population (ZIP)
- 10,578
- Household income
- $63,120
- Rent vs Own
- Severe rent burden
- 379.0
Population outlook (Jefferson County) Hauer SSP2
- Today (2025)
- 111,748 people
- By 2030
- 109,370 · -2.1%
- By 2040
- 103,828 · -7.1%
- By 2050
- 98,523 · -11.8%
- By 2075
- 91,422 · -18.2%
- By 2100
- 78,214 · -30.0%
Race, ethnicity, and origin ACS 2023
- Neighborhood character
- Predominantly White (83%)
- Race & ethnicity
- White 83% Two or more races 8% Hispanic / Latino 6% Black 2%
- Hispanic origin (detail)
- Mexican 1% Puerto Rican 2%
- Common ancestry
- Lithuanian 9% Romanian 3% Iranian 1%
- Foreign-born
- 4% · Canada
- Languages at home
- 95% English-only · Spanish 3% Tagalog/Filipino 1%
Political lean MEDSL · Jefferson
- 2024 margin
- Strong R (+23.6) · D 38.2% · R 61.8%
- 2008→2024 swing
- -18.3pp toward R · 2008: -5.3pp · 2024: -23.6pp
- All cycles
- 2024: R+23.6 2020: R+19.0 2016: R+22.4 2012: R+2.9 2008: R+5.3
Not yet ingested
- Civics
- —
Market trends
- HPI YoY
- ▲ 84.02%
- Current HPI
- 406.9439
- Rent YoY
- —
- Metro
- Watertown-Fort Drum, NY
- State GDP YoY
- ▲ 2.60%
- F500 in state
- 92
Industry mix (Fortune 500 HQ in NY)
| Industry | F500 HQs | Revenue |
|---|---|---|
| Financial Services | 10 | $950B |
|
||
| Consumer Goods | 9 | $162B |
|
||
| Insurance | 4 | $225B |
|
||
| Telecommunications | 2 | $144B |
|
||
| Pharmaceuticals | 2 | $112B |
|
||
| Media / Entertainment | 2 | $69B |
|
||
Price history
+171.3% since first listed11 events — show timeline
- 2026-06-10 Listed $189,900 CNYIS
- 2025-07-12 Rental Removed $1,450 APPFOLIO
- 2025-03-25 Listed for Rent $1,450 APPFOLIO
- 2020-10-29 Listing Removed — CNYIS
- 2019-10-02 Listed $138,000 CNYIS
- 2010-03-17 Sold (Public Records) $146,000 Public Records
- 2010-03-17 Sold (MLS) $146,000 CNYIS
- 2009-11-18 Listed $142,000 CNYIS
- 2008-04-01 Sold (MLS) $111,000 CNYIS
- 2007-11-29 Listed $113,900 CNYIS
- 2005-04-01 Sold (Public Records) $70,000 Public Records
Property tax history
-0.7%/yrLatest (2025): $3,985 · +2.4% YoY. Source: county tax records.
Cash-flow waterfall
monthlySold comps — $/sqft
last 12 mo · ≤1 miLoading sold comps…