 Duplex
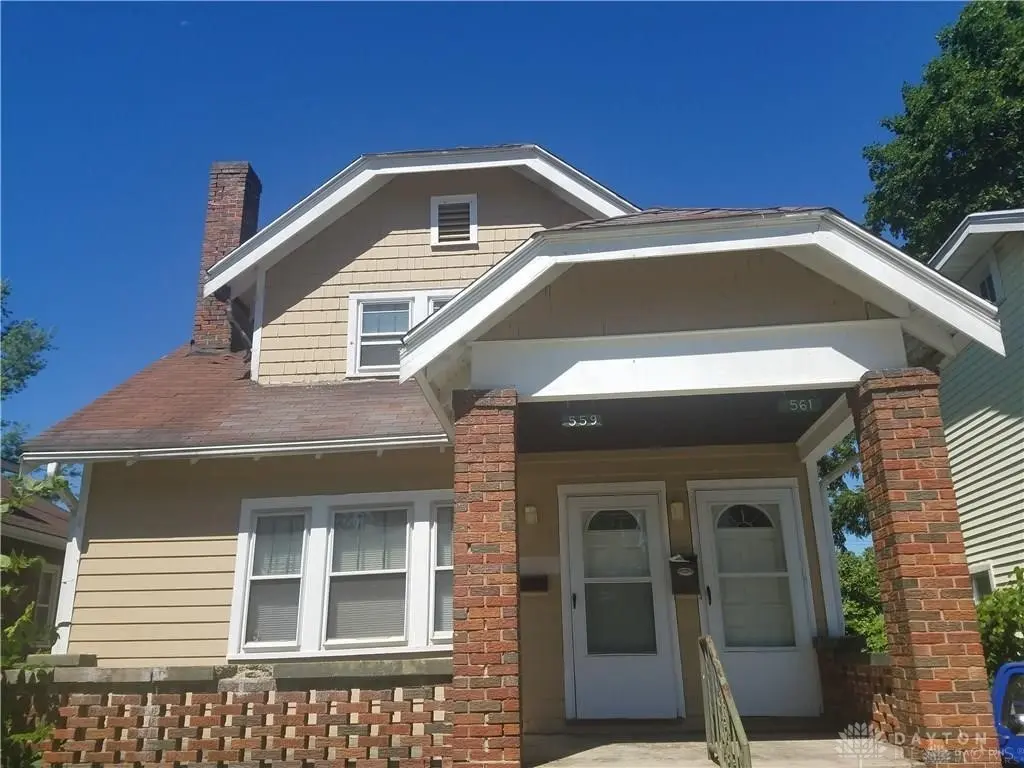
559/561 Evergreen Ave · Dayton, OH
Flood risk 1/10 · Minimal
- FEMA flood zone
- X (unshaded)
- Chance of flooding over 30 yrs
- 0.0%
- Est. flood insurance / yr
- $473 – $860
Fire risk 1/10 · Minimal
- Est. fire insurance / yr
- $713 – $1,323
Heat risk 4/10 · Minor
- Hot days now (above 104°F)
- 7 days/yr
- Hot days in 30 yrs
- 19 days/yr
Wind risk 2/10 · Minimal
- Chance of severe wind over 30 yrs
- 0.0%
Air-quality risk 3/10 · Minor
- Unhealthy air days now
- 2 days/yr
- Unhealthy air days in 30 yrs
- 4 days/yr
Risk factors via First Street. Map © Google.
Why this score? — see what drove the B+ grade
The composite is a weighted blend of 9 inputs, each scored 0–100. Each bar is that input's sub-score; the figure is the points it added to the 100-point composite (weight × sub-score).
- Cash flow +30.0/30.0
- ARV discount +15.0/15.0
- 1% rule +10.0/10.0
- DSCR +10.0/10.0
- Rent growth +3.5/5.0
- Livability +3.2/5.0
- Condition / age +2.5/5.0
- Schools +1.3/10.0
- Appreciation +0.0/10.0
$107,400
🖨 Deal sheet 📄 Offer letter ✓ Due diligence
Multi-family units
County records classify this as Multi-Family (2-4 Unit). Listing-text estimate: 2 units. confirmed
Listing remarks MLS
INVESTOR ALERT — CASH-FLOWING DUPLEX WITH EVEN MORE UPSIDE! This well-maintained duplex is already generating $1,200/month with long-term tenants on month-to-month leases. Both units are rented at below-market rates ($600 each), offering immediate potential to increase rents to $750–$800/unit with light cosmetic updates. Additional highlights: 2024 roof replacement—major expense already handled Tenants pay for all electric, lowering operating costs Expandable layout: unfinished basement offers opportunity to add a 3rd unit or additional living space Flexible floor plan allows easy conversion back to a single-family home Great for first-time investors looking to own an income-producing property while learning real estate management on a small, manageable scale, with a solid 9.3% cap rate right from the start. Perfect for buy-and-hold investors or anyone looking to add stable, appreciating cash flow to their portfolio. Sold As-Is.
Key facts
- Long-term tenants
- Unfinished basement
- Expandable layout
Tags
Neighborhood map
What this means for you Summary
Snapshot
- This is a 2 × 2-bed/1-bath units multifamily listed at $107k.
Deal economics
- At list price, monthly cash flow is $787 ($9k/yr) — positive. Per door: $393/mo.
- The deal already cash-flows at list — no discount required.
- Meets the 1% rule at list price ($2k rent vs $107k).
- Recommended offer: $95k (12.0% below list) — sets the bar for market timing.
- Cap rate 15.1% vs local median 7.4% in Dayton — top-decile yield for the area; either an underpriced asset or a hidden risk that comps aren't pricing in. Stress-test before assuming the spread holds.
Location & tenants
- Location reads 65/100 on livability (#716 in OH) — a middle-class / working-renter tenant base. Strengths: cost of living A+, housing A+, health & safety A; Watch: schools C-, amenities C-, crime F.
- Dayton City (urban): math 12% / reading 21% proficiency, ranked #641 of 656 in OH (top 98%) — low school quality limits family demand, transient renter base, plan for 1-2y turnover; 74% free/reduced lunch — lower-income household profile, screen leases tightly.
- Market conditions: Rents rising (+4.0%/yr); 83 active listings in the ZIP; 40 comparable units currently listed for rent nearby; rentals at typical pace (median 14d on market — plan ~3-4 weeks tenant-placement turnaround); 40% of comp listings sitting > 30 days — soft ceiling on asking rent; 907 units permitted in Montgomery County in 2024 (416 in 5+ unit buildings).
- At $1,837/mo this rent would consume 46% of the median local household income ($48k/yr) (locally 404% of renters already pay >50% of income on rent) — very limited rent-growth headroom before tenants either downsize or default.
Forward outlook
- Local home prices are declining (-3.0%/yr); year-one equity from $743 of loan paydown is wiped out by about $3k of value loss. Plan a longer hold.
- Montgomery County population projected at -10% by 2050 — secular population decline; favor cash flow + early exit over multi-decade hold.
- At projected returns (-3.0% appreciation + 4.0% rent growth), your $30k cash investment doubles in ~4 years — after that, you're playing with house money.
Negotiation context
- It's been on market 184 days — a 12% lower offer ($95k) is reasonable based on typical stale-listing flexibility.
- 2 sale attempts; this cycle's ask has dropped $13k (10%) from the opening price — seller is motivated, your offer sets the floor, not the list.
- Current owner paid $23k; list at $107k implies a 367% gain — meaningful room to come down on a strong offer.
Risks & watch-outs
- Watch-outs: built in 1929 — expect roof / HVAC / electrical / plumbing capex.
Questions for the listing agent
- It's been on market 184 days. Have you received any prior offers? Is the seller open to a 12% concession, seller financing, or rate buy-down credit?
- Can we see the unit-by-unit rent roll, current vacancy, and any below-market leases? What's the average tenancy length?
- What capital expenditures (roof, boiler, parking lot, exteriors) have been made in the last 5 years, and what's planned in the next 2?
- Built in 1929 — when were the roof, HVAC, electrical panel, plumbing, and water heater last replaced?
- Why hasn't it sold? Are there any deal-killer items the seller is aware of (foundation, flood, title, zoning, code violations)?
- Is there a deadline driving the sale (1031 exchange, divorce, estate, relocation)? That informs how much negotiation room exists.
- Crime grade is F in this area — have there been break-ins, vandalism, or insurance claims at this property in the last 3 years? What carrier currently insures it and at what premium?
- What's the average days-on-market for RENTAL listings here right now (not sales)? A rising rental-DOM trend means longer vacancies and softer asking-rent achievability than the comps imply.
- What's the recent tenant-quality profile in this submarket — average credit score on applications, eviction rate, late-payment / NSF rate, and stable-employment percentage? A property-management company in the area should have these aggregated.
- How much new apartment / multifamily construction is in the pipeline within 1–3 miles? Heavy new supply (>2% of stock underway) typically softens rents 12–24 months out; light construction supports rent growth.
Investment metrics
- 1% rule
- 1.71% ✓
- Cap rate
- 15.08%
- Cash-on-cash
- 31.39%
- DSCR
- 2.40
- GRM
- 4.9
CMA / ARV
- ARV (median comp)
- $133,093
- List price
- $107,400
- Delta
- -19.30%
- Verdict
- UNDERPRICED
- Comps
- 20 within 1.0 mi
Show comp detail 2 sales within ~0.75 mi
| Address | Dist | Beds/Ba | Sqft | Sold | Price | $/sf | Match |
|---|---|---|---|---|---|---|---|
| 314 Lorenz Ave | 0.32mi | 4/2.0 (+1) | 1,268 (-7%) | 19mo | $165,000 | $130 | 52 |
| 729 N Upland Ave | 0.65mi | 3/3.0 | 1,518 (+11%) | 24mo | $148,500 | $98 | 27 |
Match score weights: distance 35% · size 25% · config 20% · recency 20%. Top-matched comps best support the ARV.
Projected returns pro-forma
-3.0% appreciation · 3.98% rent growth · sell at horizon
- IRR
- 27.3%
- Equity multiple
- 2.15×
- Total profit
- $34,507
- Equity at exit
- $16,014
- IRR
- 35.4%
- Equity multiple
- 4.40×
- Total profit
- $102,137
- Equity at exit
- $9,286
Cash invested: $30,072 (down + closing). Projections, not guarantees.
Landlord ↔ Tenant lean methodology
- Overall (STATE)
- 73 Landlord-Friendly
- State Ohio
- 73 Landlord-Friendly · R+6
- County
- — inherits STATE
- City
- — inherits STATE
ZIP-level market 45402
- Rents YoY
- 4.0%
- Active inventory
- 83
- Price-to-rent
- 9.7×
Monthly cashflow live
- Estimated rent
- $1,837 high interval (Pro) →
- Mortgage (P&I)
- −$563
- Tax from tax record
- −$57 /mo · $679/yr
- Insurance
- −$45
- HOA
- −$0
- Vacancy / Maint / Mgmt
- −$386
- Net cashflow
- $787
Break-even live
2-unit breakdown (identical units grouped — click to expand)
| Units | Beds | Baths | Est. rent |
|---|---|---|---|
| 2× units | 2 | 1 | $1,838 |
| #1 | 2 | 1 | $919 |
| #2 | 2 | 1 | $919 |
| Total (2 units) | $1,837 | ||
UW: 25.0% down · 7.5% · 30yr · 1.5% tax · 5.0% vac · 8.0% maint · 8.0% mgmt
Financing live
Cash to close
- Down payment
- $26,850
- Closing costs
- $3,222
- Reserves months
- —
- Total cash needed
- —
Loan-product check · same deal, 3 products live
Conventional
25% down · 7.5% · 30yr
- Down + closing
- —
- Monthly P&I
- —
- Monthly cashflow
- —
- DSCR
- —
- Eligible?
- —
Personal DTI + credit; lowest rate.
DSCR
20% down · 8.5% · 30yr
- Down + closing
- —
- Monthly P&I
- —
- Monthly cashflow
- —
- DSCR
- —
- Eligible?
- —
No personal income docs; deal must DSCR.
Hard money
10% down · 12.0% · 12mo
- Down + closing
- —
- Monthly P&I
- —
- Monthly cashflow
- —
- DSCR
- —
- Eligible?
- —
Short-term bridge; refi at stabilization.
Rent comps 40 comps
| Address | Beds | Baths | Sqft | Rent | $/sqft | DOM | Units | Dist |
|---|---|---|---|---|---|---|---|---|
| 725 Maplehurst Ave Dayton, OH | 2.0 | 1.0 | 1104 | $895 | $0.81 | 43d | 1 | 0.14mi |
| 635 Anna St Dayton, OH | 3.0 | 1.0 | 960 | $1,300 | $1.35 | 14d | 1 | 0.14mi |
| 437 Lorenz Ave Dayton, OH | 3.0 | 1.0 | 1322 | $1,200 | $0.91 | 23d | 1 | 0.17mi |
| 660 Gramont Ave Dayton, OH | 3.0 | 1.0 | 1142 | $1,050 | $0.92 | 3d | 1 | 0.18mi |
| 617 Westwood Ave Dayton, OH | 3.0 | 1.0 | 1304 | $1,050 | $0.81 | 43d | 1 | 0.30mi |
| 1045 Philadelphia Dr Dayton, OH | 2.0 | 1.0 | 1290 | $1,150 | $0.89 | 2d | 1 | 0.36mi |
| 1045 Shakespeare Ave Dayton, OH | 3.0 | 1.0 | 1435 | $1,275 | $0.89 | 43d | 1 | 0.37mi |
| 920 Huron Ave Dayton, OH | 2.0 | 1.0 | 950 | $995 | $1.05 | 3d | 1 | 0.41mi |
| 216 N Ardmore Ave Dayton, OH | 3.0 | 1.0 | 1500 | $1,100 | $0.73 | 3d | 1 | 0.43mi |
| 1816 N James H McGee Blvd Unit C Dayton, OH | 3.0 | 1.0 | 950 | $1,150 | $1.21 | 2d | 1 | 0.59mi |
| 1816 N James H McGee Blvd Apt B Dayton, OH | 3.0 | 1.0 | 950 | $1,150 | $1.21 | 43d | 1 | 0.59mi |
| 1816 N James H McGee Blvd Apt A Dayton, OH | 3.0 | 1.0 | 950 | $1,200 | $1.26 | 2d | 1 | 0.59mi |
| 863 N Upland Ave Dayton, OH | 3.0 | 1.0 | 1042 | $1,200 | $1.15 | 43d | 1 | 0.60mi |
| 70 Gramont Ave Dayton, OH | 3.0 | 1.5 | 966 | $1,300 | $1.35 | 2d | 1 | 0.65mi |
| 3220 Princeton Dr Dayton, OH | 3.0 | 1.0 | 900 | $1,000 | $1.11 | 43d | 1 | 0.71mi |
| 3925 Hoover Ave Dayton, OH | 2.0 | 1.0 | 936 | $1,100 | $1.18 | 2d | 1 | 0.81mi |
| 1119 Superior Ave Unit 1119 Dayton, OH | 3.0 | 1.0 | 1435 | $1,350 | $0.94 | 3d | 1 | 0.83mi |
| 40 S Mathison St Dayton, OH | 3.0 | 1.0 | 1300 | $1,200 | $0.92 | 14d | 1 | 0.86mi |
| 42 S Mathison St Dayton, OH | 3.0 | 1.0 | 1300 | $1,220 | $0.94 | 3d | 1 | 0.86mi |
| 424 Lexington Ave Dayton, OH | 3.0 | 2.0 | 1536 | $1,025 | $0.67 | 43d | 1 | 0.89mi |
| 3207 Cornell Dr Dayton, OH | 3.0 | 1.0 | 1168 | $1,000 | $0.86 | 3d | 1 | 0.97mi |
| 1378 Cory Dr Dayton, OH | 2.0 | 1.0 | 1300 | $975 | $0.75 | 43d | 1 | 1.02mi |
| 1011 N Broadway St Dayton, OH | 3.0 | 1.5 | 1700 | $950 | $0.56 | 43d | 1 | 1.13mi |
| 3668 Karwin Dr Unit 3672 Dayton, OH | 2.0 | 1.0 | 1500 | $995 | $0.66 | 23d | 1 | 1.15mi |
| 3672 Karwin Dr Unit 3672 Dayton, OH | 2.0 | 1.0 | 1500 | $995 | $0.66 | 43d | 1 | 1.15mi |
| 1225 Amherst Pl Dayton, OH | 3.0 | 1.0 | 1548 | $1,300 | $0.84 | 14d | 1 | 1.23mi |
| 3650 Otterbein Ave Unit 3650 Dayton, OH | 2.0 | 1.0 | 900 | $800 | $0.89 | 2d | 1 | 1.26mi |
| 4109 Midway Ave Dayton, OH | 3.0 | 1.0 | 971 | $1,000 | $1.03 | 3d | 1 | 1.28mi |
| 652 Dennison Ave Dayton, OH | 2.0 | 2.0 | 988 | $1,095 | $1.11 | 21d | 1 | 1.28mi |
| 3311 Otterbein Ave Dayton, OH | 3.0 | 1.5 | 1004 | $1,300 | $1.29 | 11d | 1 | 1.31mi |
| 47 Leroy St Dayton, OH | 3.0 | 1.0 | 1456 | $1,200 | $0.82 | 43d | 1 | 1.32mi |
| 1067 Salem Ave Dayton, OH | 2.0 | 1.0 | 1100 | $900 | $0.82 | 43d | 1 | 1.33mi |
| 1067 Salem Ave Unit 3 Dayton, OH | 2.0 | 1.5 | 1100 | $900 | $0.82 | 43d | 1 | 1.33mi |
| 1067 Salem Ave Unit 2 Dayton, OH | 2.0 | 1.5 | 1100 | $900 | $0.82 | 43d | 1 | 1.33mi |
| 1743 Radcliffe Rd Dayton, OH | 3.0 | 1.5 | 1729 | $1,200 | $0.69 | 43d | 1 | 1.33mi |
| 3537 Otterbein Ave Unit d Dayton, OH | 2.0 | 1.0 | 900 | $925 | $1.03 | 43d | 1 | 1.34mi |
| 623 Clifton Dr Apt A Dayton, OH | 2.0 | 1.0 | 1200 | $1,200 | $1.00 | 2d | 1 | 1.35mi |
| 623 Clifton Dr Apt B Dayton, OH | 2.0 | 1.0 | 1200 | $1,174 | $0.98 | 3d | 1 | 1.35mi |
| 942 Harvard Blvd Dayton, OH | 3.0 | 2.0 | 1596 | $1,200 | $0.75 | 3d | 1 | 1.38mi |
| 1927 Burroughs Dr Dayton, OH | 3.0 | 2.0 | 1409 | $1,245 | $0.88 | 14d | 1 | 1.39mi |
Listing history 23 events
-
2026-06-18days on market $107,400 Active 184 DOM
-
2026-06-17days on market $107,400 Active 183 DOM
-
2026-06-16days on market $107,400 Active 182 DOM
-
2026-06-15days on market $107,400 Active 181 DOM
-
2026-06-14days on market $107,400 Active 179 DOM
-
2026-06-13days on market $107,400 Active 178 DOM
-
2026-06-10days on market $107,400 Active 176 DOM
-
2026-06-09days on market $107,400 Active 175 DOM
-
2026-06-08days on market $107,400 Active 174 DOM
-
2026-06-07days on market $107,400 Active 173 DOM
-
2026-06-05days on market $107,400 Active 170 DOM
-
2026-06-03days on market $107,400 Active 169 DOM
-
2026-06-02days on market $107,400 Active 168 DOM
-
2026-06-01days on market $107,400 Active 167 DOM
-
2026-05-31days on market $107,400 Active 166 DOM
-
2026-04-03status Active 976-char remark
Show marketing remark (976 chars)
INVESTOR ALERT — CASH-FLOWING DUPLEX WITH EVEN MORE UPSIDE! This well-maintained duplex is already generating $1,200/month with long-term tenants on month-to-month leases. Both units are rented at below-market rates ($600 each), offering immediate potential to increase rents to $750–$800/unit with light cosmetic updates. Additional highlights: 2024 roof replacement—major expense already handled Tenants pay for all electric, lowering operating costs Expandable layout: unfinished basement offers opportunity to add a 3rd unit or additional living space Flexible floor plan allows easy conversion back to a single-family home Great for first-time investors looking to own an income-producing property while learning real estate management on a small, manageable scale, with a solid 9.3% cap rate right from the start. Perfect for buy-and-hold investors or anyone looking to add stable, appreciating cash flow to their portfolio. Sold As-Is.
-
2026-03-27historical ActiveUnderContract 976-char remark
Show marketing remark (976 chars)
INVESTOR ALERT — CASH-FLOWING DUPLEX WITH EVEN MORE UPSIDE! This well-maintained duplex is already generating $1,200/month with long-term tenants on month-to-month leases. Both units are rented at below-market rates ($600 each), offering immediate potential to increase rents to $750–$800/unit with light cosmetic updates. Additional highlights: 2024 roof replacement—major expense already handled Tenants pay for all electric, lowering operating costs Expandable layout: unfinished basement offers opportunity to add a 3rd unit or additional living space Flexible floor plan allows easy conversion back to a single-family home Great for first-time investors looking to own an income-producing property while learning real estate management on a small, manageable scale, with a solid 9.3% cap rate right from the start. Perfect for buy-and-hold investors or anyone looking to add stable, appreciating cash flow to their portfolio. Sold As-Is.
-
2026-03-15price $107,400 976-char remark
Show marketing remark (976 chars)
INVESTOR ALERT — CASH-FLOWING DUPLEX WITH EVEN MORE UPSIDE! This well-maintained duplex is already generating $1,200/month with long-term tenants on month-to-month leases. Both units are rented at below-market rates ($600 each), offering immediate potential to increase rents to $750–$800/unit with light cosmetic updates. Additional highlights: 2024 roof replacement—major expense already handled Tenants pay for all electric, lowering operating costs Expandable layout: unfinished basement offers opportunity to add a 3rd unit or additional living space Flexible floor plan allows easy conversion back to a single-family home Great for first-time investors looking to own an income-producing property while learning real estate management on a small, manageable scale, with a solid 9.3% cap rate right from the start. Perfect for buy-and-hold investors or anyone looking to add stable, appreciating cash flow to their portfolio. Sold As-Is.
-
2025-12-14$120,000 Active 976-char remark
Show marketing remark (976 chars)
INVESTOR ALERT — CASH-FLOWING DUPLEX WITH EVEN MORE UPSIDE! This well-maintained duplex is already generating $1,200/month with long-term tenants on month-to-month leases. Both units are rented at below-market rates ($600 each), offering immediate potential to increase rents to $750–$800/unit with light cosmetic updates. Additional highlights: 2024 roof replacement—major expense already handled Tenants pay for all electric, lowering operating costs Expandable layout: unfinished basement offers opportunity to add a 3rd unit or additional living space Flexible floor plan allows easy conversion back to a single-family home Great for first-time investors looking to own an income-producing property while learning real estate management on a small, manageable scale, with a solid 9.3% cap rate right from the start. Perfect for buy-and-hold investors or anyone looking to add stable, appreciating cash flow to their portfolio. Sold As-Is.
-
2018-08-23soldstatus $23,000
-
2017-02-09soldstatus $16,000
-
2010-10-04soldstatus $37,000
-
1992-07-28soldstatus $20,500
ⓘ Source: listings_history table (triggers on properties + properties_extension) + one-shot
backfill from property_details.listing_events for pre-trigger history.
Tax reassessment forecast OH · Partial reset (capped growth)
- Current annual tax
- $679 · $57/mo
- Projected year-2 tax
- $1,177 · $98/mo
- Expected delta
- +$498/yr (+$41/mo · 73.3%)
ⓘ Screening estimate from a state-policy table — verify with the county assessor before closing.
Climate risk First Street
- Flood 1/10 Low FEMA zone X (unshaded) · 0% chance over 30 yrs
- Wildfire 1/10 Low
- Heat 4/10 Moderate 7 d/yr ≥104°F today · 19 d/yr by 30 yrs out
- Wind 2/10 Low 0% chance of damaging wind over 30 yrs
- Air quality 3/10 Moderate 2 unhealthy d/yr today · 4 by 30 yrs out
Nearby sold comps map
Loading sold comps map…
Walkable amenities ~0.75 mi
Loading nearby amenities…
Taxation est. · year 1
- Rental income
- $22,044
- − Mortgage interest
- −$6,016
- − Property taxes
- −$679
- − Insurance
- −$537
- − Repairs & maintenance
- −$1,764
- − Management
- −$1,764
- − Depreciation
- −$3,124
- Taxable income
- $8,160
- Est. tax owed @ 24.0%
- −$1,958
- After-tax cash flow
- $7,481/yr
For passive investors: Depreciation is non-cash, so a rental often shows a tax loss while cash-flowing — sheltering income. Rental losses are passive: they offset passive income freely, and up to $25,000/yr can offset ordinary (W-2) income if you actively participate and your MAGI is under $100k (phasing out to $0 by $150k); unused losses carry forward. On sale, claimed depreciation is recaptured at up to 25%, and gains may owe capital-gains tax (a 1031 exchange can defer both). Figures are a year-1 estimate at your 24.0% rate — not tax advice; consult a CPA.
Schools (NCES district)
- District
- Dayton City
- NCES district ID
- 3904384
- Math proficiency
- 12% ▼ -12.00%
- Reading proficiency
- 21% ▼ -11.00%
- Median HH income
- $28,688
- Composite
- 12.94/100
- National rank
- #9579
- State rank
- #641 of 656 in OH
Livability — Dayton
- Score
- 65/100
- State rank
- #716
- US rank
- #12895
Category grades
Schools grade is shown separately in the Schools card above.
Census & demographics
- Census place
- Dayton, OH
- County
- Montgomery County · 459,541 people
- City population
- 164,387
- Metro
- Dayton-Kettering, OH
- Population (ZIP)
- 9,407
- Household income
- $48,401
- Rent vs Own
- Severe rent burden
- 404.0
Population outlook (Montgomery County) Hauer SSP2
- Today (2025)
- 523,241 people
- By 2030
- 514,948 · -1.6%
- By 2040
- 493,378 · -5.7%
- By 2050
- 469,639 · -10.2%
- By 2075
- 418,360 · -20.0%
- By 2100
- 353,315 · -32.5%
Race, ethnicity, and origin ACS 2023
- Neighborhood character
- Diverse neighborhood (Simpson 0.57)
- Race & ethnicity
- Black 57% White 32% Two or more races 7% Hispanic / Latino 5%
- Hispanic origin (detail)
- Mexican 1%
- Common ancestry
- Italian 2% Serbian 2% Slovak 1%
- Foreign-born
- 5% · Canada, Vietnam, Jamaica
- Languages at home
- 94% English-only · Spanish 4% Other Asian/Pacific 1% Arabic 1%
Political lean MEDSL · Montgomery
- 2024 margin
- Toss-up / Even · D 49.8% · R 49.3%
- 2008→2024 swing
- -5.8pp toward R · 2008: 6.2pp · 2024: 0.5pp
- All cycles
- 2024: D+0.5 2020: D+2.2 2016: R+1.2 2012: D+3.1 2008: D+6.2
Not yet ingested
- Civics
- —
Market trends
- HPI YoY
- ▼ -81.89%
- Current HPI
- 149.7909
- Rent YoY
- ▲ 3.98%
- Metro
- Dayton-Kettering, OH
- State GDP YoY
- ▲ 1.98%
- F500 in state
- 48
Industry mix (Fortune 500 HQ in OH)
| Industry | F500 HQs | Revenue |
|---|---|---|
| Insurance | 3 | $145B |
|
||
| Industrial Machinery | 3 | $49B |
|
||
| Financial Services | 3 | $24B |
|
||
| Consumer Goods | 2 | $93B |
|
||
| Aerospace / Defense | 2 | $47B |
|
||
| Utilities | 2 | $33B |
|
||
Price history
+423.9% since first listed8 events — show timeline
- 2026-04-03 Relisted — Dayton MLS
- 2026-03-27 Contingent — Dayton MLS
- 2026-03-15 Price Changed $107,400 Dayton MLS
- 2025-12-14 Listed $120,000 Dayton MLS
- 2018-08-23 Sold (Public Records) $23,000 Public Records
- 2017-02-09 Sold (Public Records) $16,000 Public Records
- 2010-10-04 Sold (Public Records) $37,000 Public Records
- 1992-07-28 Sold (Public Records) $20,500 Public Records
Property tax history
-2.3%/yrLatest (2025): $679 · -0.2% YoY. Source: county tax records.
Cash-flow waterfall
monthlySold comps — $/sqft
last 12 mo · ≤1 miLoading sold comps…