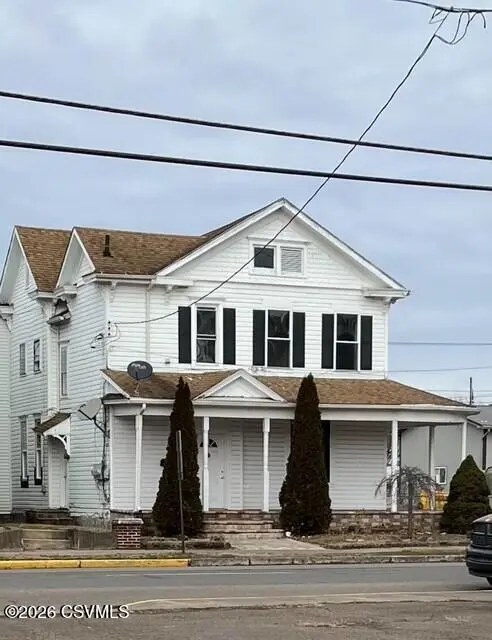
 Fourplex
235 W 2nd St · Berwick, PA
Flood risk 1/10 · Minimal
- FEMA flood zone
- X (unshaded)
- Chance of flooding over 30 yrs
- 0.0%
- Est. flood insurance / yr
- $507 – $1,088
Fire risk 1/10 · Minimal
- Est. fire insurance / yr
- $511 – $949
Heat risk 4/10 · Minor
- Hot days now (above 97°F)
- 7 days/yr
- Hot days in 30 yrs
- 16 days/yr
Wind risk 3/10 · Minor
- Chance of severe wind over 30 yrs
- 4.0%
Air-quality risk 2/10 · Minimal
- Unhealthy air days now
- 1 days/yr
- Unhealthy air days in 30 yrs
- 2 days/yr
Risk factors via First Street. Map © Google.
Why this score? — see what drove the B- grade
The composite is a weighted blend of 9 inputs, each scored 0–100. Each bar is that input's sub-score; the figure is the points it added to the 100-point composite (weight × sub-score).
- Cash flow +30.0/30.0
- 1% rule +10.0/10.0
- DSCR +10.0/10.0
- ARV discount +6.7/15.0
- Livability +3.8/5.0
- Schools +3.7/10.0
- Rent growth +2.5/5.0
- Condition / age +2.5/5.0
- Appreciation +0.0/10.0
$249,999
🖨 Deal sheet 📄 Offer letter ✓ Due diligence
Multi-family units
County records classify this as Multi-Family (5+ Unit). Listing-text estimate: 4 units. estimate disagrees with records
5+ unit building — per-unit beds/baths from public records are typically unavailable; the breakdown below (if shown) is an estimate from the listing text.
Listing remarks MLS
Investors check this out, property currently has 3 units, with a potential for studio apartment. Upstairs you will find a 3 bed, 1 bath, living room, eat in kitchen, and laundry room with plenty of storage. On the main level there is a 1 bed, 3/4 bath, living area, dining space and kitchen. The other first floor unit has 1 bed, 3/4 bath, living area, eat in kitchen and laundry room with tons of storage. Out back there is a building that just needs some TLC to make a studio apartment with proper zoning approval. Each unit has their own water heater/furnace and separate meters. Some updates include vinyl windows, wood and tile flooring throughout. Call Lindsey Farrell 570.854.3849 for your private showing!
Key facts
- Separate utilities
- Updated throughout
- 4,791 sq ft lot
Tags
Property features AI
Exterior
- Parking: 2 parking spaces
- Utilities: Public water; Public sewer
- Home design: Residential income property; Multi-unit
- Construction: Vinyl siding; Block construction; No foundation details provided
- Exterior features: Shingle roof; Sidewalks
Interior
- Kitchen: Range
- Bathrooms: 3 full bathrooms; 1 three-quarter bathroom
- Heating & cooling: Baseboard heating; Has heating
- Interior features: Range; Water heater; Basement with exterior entry; Unfinished basement
- Laundry & utility: Water heater
Neighborhood map
What this means for you Summary
Snapshot
- This is a 1×3bd/1ba + 2×1bd/0.75ba + 1×1bd/?ba units multifamily listed at $250k.
Deal economics
- At list price, monthly cash flow is $2k ($28k/yr) — positive. Per door: $579/mo.
- The deal already cash-flows at list — no discount required.
- Meets the 1% rule at list price ($5k rent vs $250k).
- Recommended offer: $242k (3.0% below list) — sets the bar for market timing.
- Cap rate 17.4% vs local median 5.4% in Berwick — top-decile yield for the area; either an underpriced asset or a hidden risk that comps aren't pricing in. Stress-test before assuming the spread holds.
Location & tenants
- Location reads 76/100 on livability (#412 in PA, #3,762 nationally) — a middle-class / working-renter tenant base. Strengths: crime A+, cost of living A+, housing A+; Watch: amenities F, commute F, employment F.
- Berwick Area SD (other): math 32% / reading 57% proficiency, ranked #291 of 539 in PA (top 54%) — families likely to look elsewhere, expect single-tenant / working-renter base with shorter leases.
- Market conditions: 86 active listings in the ZIP; 82 units permitted in Columbia County in 2024 (0 in 5+ unit buildings).
Forward outlook
- Local home prices are declining (-3.0%/yr); year-one equity from $2k of loan paydown is wiped out by about $8k of value loss. Plan a longer hold.
- Columbia County population projected at -12% by 2050 — secular population decline; favor cash flow + early exit over multi-decade hold.
- At projected returns (-3.0% appreciation + 3.0% rent growth), your $70k cash investment doubles in ~3 years — after that, you're playing with house money.
Negotiation context
- It's been on market 36 days — a 3% lower offer ($242k) is reasonable based on typical stale-listing flexibility.
- 4 sale attempts since 7y ago with the ask held roughly flat each time — persistent listings suggest the price (not the market) is what's stuck; bring a comps-based counter.
- Current owner paid $186k; 34% above their basis — modest negotiation headroom, anchor on the comps not their cost.
Risks & watch-outs
- Watch-outs: built in 1900 — expect roof / HVAC / electrical / plumbing capex.
Questions for the listing agent
- It's been on market 36 days. Have you received any prior offers? Is the seller open to a 3% concession, seller financing, or rate buy-down credit?
- Can we see the unit-by-unit rent roll, current vacancy, and any below-market leases? What's the average tenancy length?
- What capital expenditures (roof, boiler, parking lot, exteriors) have been made in the last 5 years, and what's planned in the next 2?
- Built in 1900 — when were the roof, HVAC, electrical panel, plumbing, and water heater last replaced?
- Is there a deadline driving the sale (1031 exchange, divorce, estate, relocation)? That informs how much negotiation room exists.
- Schools are B-rated — typically a magnet for longer-tenancy family renters. What's the average tenant stay here, and is there a school-zone premium baked into asking?
- What's the average days-on-market for RENTAL listings here right now (not sales)? A rising rental-DOM trend means longer vacancies and softer asking-rent achievability than the comps imply.
- What's the recent tenant-quality profile in this submarket — average credit score on applications, eviction rate, late-payment / NSF rate, and stable-employment percentage? A property-management company in the area should have these aggregated.
- How much new apartment / multifamily construction is in the pipeline within 1–3 miles? Heavy new supply (>2% of stock underway) typically softens rents 12–24 months out; light construction supports rent growth.
Investment metrics
- 1% rule
- 2.01% ✓
- Cap rate
- 17.41%
- Cash-on-cash
- 39.70%
- DSCR
- 2.77
- GRM
- 4.2
CMA / ARV
- ARV (median comp)
- $245,802
- List price
- $249,999
- Delta
- 1.71%
- Verdict
- FAIR
- Comps
- 20 within 1.0 mi
Projected returns pro-forma
-3.0% appreciation · 3.0% rent growth · sell at horizon
- IRR
- 36.0%
- Equity multiple
- 2.53×
- Total profit
- $107,028
- Equity at exit
- $37,276
- IRR
- 42.7%
- Equity multiple
- 5.05×
- Total profit
- $283,249
- Equity at exit
- $21,615
Cash invested: $70,000 (down + closing). Projections, not guarantees.
Landlord ↔ Tenant lean methodology
- Overall (STATE)
- 62 Landlord-Friendly
- State Pennsylvania
- 62 Landlord-Friendly · EVEN
- County
- — inherits STATE
- City
- — inherits STATE
ZIP-level market 18603
- Active inventory
- 86
- Price-to-rent
- 14.7×
Monthly cashflow live
- Estimated rent
- $5,016 medium interval (Pro) →
- Mortgage (P&I)
- −$1,311
- Tax from tax record
- −$231 /mo · $2,776/yr
- Insurance
- −$104
- HOA
- −$0
- Vacancy / Maint / Mgmt
- −$1,053
- Net cashflow
- $2,316
Break-even live
4-unit breakdown (identical units grouped — click to expand)
| Units | Beds | Baths | Est. rent |
|---|---|---|---|
| 1× unit | 3 | 1 | $1,416 |
| 2× units | 1 | 0.75 | $2,400 |
| #2 | 1 | 0.75 | $1,200 |
| #3 | 1 | 0.75 | $1,200 |
| 1× unit | 1 | 0 | $1,200 |
| Total (4 units) | $5,016 | ||
UW: 25.0% down · 7.5% · 30yr · 1.5% tax · 5.0% vac · 8.0% maint · 8.0% mgmt
Financing live
Cash to close
- Down payment
- $62,500
- Closing costs
- $7,500
- Reserves months
- —
- Total cash needed
- —
Loan-product check · same deal, 3 products live
Conventional
25% down · 7.5% · 30yr
- Down + closing
- —
- Monthly P&I
- —
- Monthly cashflow
- —
- DSCR
- —
- Eligible?
- —
Personal DTI + credit; lowest rate.
DSCR
20% down · 8.5% · 30yr
- Down + closing
- —
- Monthly P&I
- —
- Monthly cashflow
- —
- DSCR
- —
- Eligible?
- —
No personal income docs; deal must DSCR.
Hard money
10% down · 12.0% · 12mo
- Down + closing
- —
- Monthly P&I
- —
- Monthly cashflow
- —
- DSCR
- —
- Eligible?
- —
Short-term bridge; refi at stabilization.
Listing history 18 events
-
2026-06-16status $249,999 Pending 36 DOM
-
2026-06-15days on market $249,999 Active 36 DOM
-
2026-06-14days on market $249,999 Active 34 DOM
-
2026-06-12days on market $249,999 Active 33 DOM
-
2026-06-09days on market $249,999 Active 30 DOM
-
2026-06-08days on market $249,999 Active 29 DOM
-
2026-06-07statusdays on market $249,999 Active 28 DOM
-
2026-06-02days on market $249,999 Active Under Contract 23 DOM
-
2026-06-01days on market $249,999 Active Under Contract 22 DOM
-
2026-05-31days on market $249,999 Active Under Contract 21 DOM
-
2026-05-30days on market $249,999 Active Under Contract 20 DOM
-
2026-05-10$249,999 Active 713-char remark
-
2023-02-23soldstatus $186,000
-
2022-06-28soldstatus $160,000
-
2022-06-23soldstatus $160,000 Closed 713-char remark
Show marketing remark (713 chars)
Investors check this out, property currently has 3 units, with a potential for studio apartment. Upstairs you will find a 3 bed, 1 bath, living room, eat in kitchen, and laundry room with plenty of storage. On the main level there is a 1 bed, 3/4 bath, living area, dining space and kitchen. The other first floor unit has 1 bed, 3/4 bath, living area, eat in kitchen and laundry room with tons of storage. Out back there is a building that just needs some TLC to make a studio apartment with proper zoning approval. Each unit has their own water heater/furnace and separate meters. Some updates include vinyl windows, wood and tile flooring throughout. Call Lindsey Farrell 570.854.3849 for your private showing!
-
2022-04-21$172,500 713-char remark
Show marketing remark (713 chars)
Investors check this out, property currently has 3 units, with a potential for studio apartment. Upstairs you will find a 3 bed, 1 bath, living room, eat in kitchen, and laundry room with plenty of storage. On the main level there is a 1 bed, 3/4 bath, living area, dining space and kitchen. The other first floor unit has 1 bed, 3/4 bath, living area, eat in kitchen and laundry room with tons of storage. Out back there is a building that just needs some TLC to make a studio apartment with proper zoning approval. Each unit has their own water heater/furnace and separate meters. Some updates include vinyl windows, wood and tile flooring throughout. Call Lindsey Farrell 570.854.3849 for your private showing!
-
2019-10-02$124,900
-
2005-10-18soldstatus $32,000
ⓘ Source: listings_history table (triggers on properties + properties_extension) + one-shot
backfill from property_details.listing_events for pre-trigger history.
Tax reassessment forecast PA · Partial reset (capped growth)
- Current annual tax
- $2,776 · $231/mo
- Projected year-2 tax
- $3,363 · $280/mo
- Expected delta
- +$587/yr (+$49/mo · 21.1%)
ⓘ Screening estimate from a state-policy table — verify with the county assessor before closing.
Climate risk First Street
- Flood 1/10 Low FEMA zone X (unshaded) · 0% chance over 30 yrs
- Wildfire 1/10 Low
- Heat 4/10 Moderate 7 d/yr ≥97°F today · 16 d/yr by 30 yrs out
- Wind 3/10 Moderate 4% chance of damaging wind over 30 yrs
- Air quality 2/10 Low 1 unhealthy d/yr today · 2 by 30 yrs out
Nearby sold comps map
Loading sold comps map…
Walkable amenities ~0.75 mi
Loading nearby amenities…
Taxation est. · year 1
- Rental income
- $60,192
- − Mortgage interest
- −$14,004
- − Property taxes
- −$2,776
- − Insurance
- −$1,250
- − Repairs & maintenance
- −$4,815
- − Management
- −$4,815
- − Depreciation
- −$7,273
- Taxable income
- $25,258
- Est. tax owed @ 24.0%
- −$6,062
- After-tax cash flow
- $21,731/yr
For passive investors: Depreciation is non-cash, so a rental often shows a tax loss while cash-flowing — sheltering income. Rental losses are passive: they offset passive income freely, and up to $25,000/yr can offset ordinary (W-2) income if you actively participate and your MAGI is under $100k (phasing out to $0 by $150k); unused losses carry forward. On sale, claimed depreciation is recaptured at up to 25%, and gains may owe capital-gains tax (a 1031 exchange can defer both). Figures are a year-1 estimate at your 24.0% rate — not tax advice; consult a CPA.
Schools (NCES district)
- District
- Berwick Area SD
- NCES district ID
- 4203480
- Math proficiency
- 32% ▼ -14.00%
- Reading proficiency
- 57% ▼ -6.00%
- Median HH income
- $41,964
- Composite
- 37.36/100
- National rank
- #4433
- State rank
- #291 of 539 in PA
Livability — Berwick
- Score
- 76/100
- State rank
- #412
- US rank
- #3762
Category grades
Schools grade is shown separately in the Schools card above.
Census & demographics
- Census place
- Berwick, PA
- Population (ZIP)
- 18,985
Population outlook (Columbia County) Hauer SSP2
- Today (2025)
- 65,170 people
- By 2030
- 64,054 · -1.7%
- By 2040
- 61,131 · -6.2%
- By 2050
- 57,526 · -11.7%
- By 2075
- 50,259 · -22.9%
- By 2100
- 44,756 · -31.3%
Race, ethnicity, and origin ACS 2023
- Neighborhood character
- Predominantly White (91%)
- Race & ethnicity
- White 91% Hispanic / Latino 4% Two or more races 3% Black 3%
- Common ancestry
- Romanian 6% Polish 4% Iranian 3%
- Foreign-born
- 3% · Canada
- Languages at home
- 97% English-only · Spanish 2% Russian/Polish/Slavic 1%
Political lean MEDSL · Columbia
- 2024 margin
- Solid R (+31.0) · D 34.0% · R 65.0%
- 2008→2024 swing
- -26.6pp toward R · 2008: -4.5pp · 2024: -31.0pp
- All cycles
- 2024: R+31.0 2020: R+30.7 2016: R+32.8 2012: R+12.4 2008: R+4.5
Not yet ingested
- Civics
- —
Market trends
- HPI YoY
- ▼ -123.40%
- Current HPI
- 211.5643
- Rent YoY
- —
- Metro
- —
- State GDP YoY
- ▲ 1.68%
- F500 in state
- 34
Industry mix (Fortune 500 HQ in PA)
| Industry | F500 HQs | Revenue |
|---|---|---|
| Healthcare | 2 | $309B |
|
||
| Insurance | 2 | $27B |
|
||
| Telecommunications / Media | 1 | $124B |
|
||
| Industrial Distribution | 1 | $22B |
|
||
| Financial Services | 1 | $20B |
|
||
| Chemicals / Materials | 1 | $18B |
|
||
Price history
+681.2% since first listed10 events — show timeline
- 2026-06-15 Pending — CSVBR
- 2026-06-06 Relisted — CSVBR
- 2026-05-27 Contingent — CSVBR
- 2026-05-10 Listed $249,999 CSVBR
- 2023-02-23 Sold (Public Records) $186,000 Public Records
- 2022-06-28 Sold (Public Records) $160,000 Public Records
- 2022-06-23 Sold (MLS) $160,000 CSVBR
- 2022-04-21 Listed $172,500 CSVBR
- 2019-10-02 Listed $124,900 CSVBR
- 2005-10-18 Sold (Public Records) $32,000 Public Records
Property tax history
+2.7%/yrLatest (2026): $2,776 · +2.2% YoY. Source: county tax records.
Cash-flow waterfall
monthlySold comps — $/sqft
last 12 mo · ≤1 miLoading sold comps…