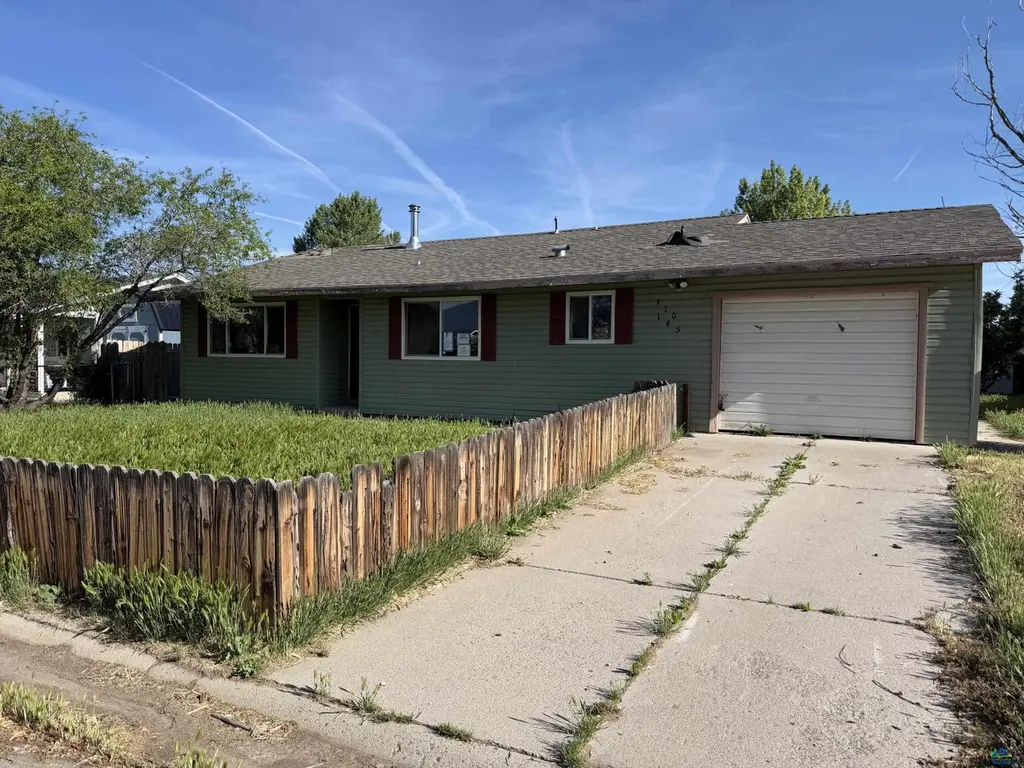
710-145 Muskrat Dr · Johnstonville, CA
Flood risk 1/10 · Minimal
- FEMA flood zone
- X (unshaded)
- Chance of flooding over 30 yrs
- 0.0%
- Est. flood insurance / yr
- $507 – $1,088
Fire risk 7/10 · Major
- Est. fire insurance / yr
- $659 – $1,223
Heat risk 4/10 · Minor
- Hot days now (above 93°F)
- 7 days/yr
- Hot days in 30 yrs
- 18 days/yr
Wind risk 1/10 · Minimal
- Chance of severe wind over 30 yrs
- —
Air-quality risk 10/10 · Severe
- Unhealthy air days now
- 22 days/yr
- Unhealthy air days in 30 yrs
- 24 days/yr
Risk factors via First Street. Map © Google.
Why this score? — see what drove the B+ grade
The composite is a weighted blend of 9 inputs, each scored 0–100. Each bar is that input's sub-score; the figure is the points it added to the 100-point composite (weight × sub-score).
- Cash flow +30.0/30.0
- ARV discount +15.0/15.0
- DSCR +10.0/10.0
- 1% rule +8.6/10.0
- Livability +3.5/5.0
- Schools +3.2/10.0
- Rent growth +2.5/5.0
- Condition / age +2.5/5.0
- Appreciation +0.0/10.0
$124,900
🖨 Deal sheet (PDF) 📄 Offer letter ✓ Due diligence
Listing remarks MLS
Well maintained 3 bedroom, 1.5 bath home located in Levitt Lake subdivision. Inside you will find a open kitchen, separate dining area, nice size living room with a large woodstove to keep you cozy on those cold winter nights. The home has been well maintained. Outside, there is a 1 car attached garage, large fenced yard, situated on . 18 of a acre. Come take a look!
Key facts
- Value-add potential
- Fenced lot
- Open kitchen
Tags
Property features AI
Finance
- Other: Lot approximately 0.18 acre
Exterior
- Parking: Detached or attached garage with space for 1 car; Concrete parking surface
- Utilities: Public sewer
- Home design: Single-family residence; Residential property; R1 zoning
- Construction: Frame construction; Composition roof
- Exterior features: Covered patio/porch; Fenced yard
Interior
- Kitchen: Electric water heater
- Bathrooms: One half bathroom
- Interior features: Eat-in kitchen; Insulated windows
Neighborhood map
What this means for you Summary
Snapshot
- This is a 3-bed/1.0-bath single-family listed at $125k.
Deal economics
- At list price, monthly cash flow is $482 ($6k/yr) — positive.
- The deal already cash-flows at list — no discount required.
- Meets the 1% rule at list price ($2k rent vs $125k).
Location & tenants
- Location reads 70/100 on livability (#234 in CA) — a middle-class / working-renter tenant base. Strengths: housing A+, crime A-, employment A-; Watch: amenities F, commute F.
- Shaffer Union Elementary (rural): math 30% / reading 35% proficiency, ranked #925 of 1,400 in CA (top 66%) — families likely to look elsewhere, expect single-tenant / working-renter base with shorter leases.
- Zoned schools: Shaffer Elementary (math 32% / reading 27%, grade F, #856 of 1,571 statewide, top 57%, 207 students, 56% FRL); Lassen High (math 12% / reading 47%, grade F, #750 of 1,170 statewide, top 66%, 820 students, 33% FRL).
- Market conditions: 240 active listings in the ZIP; 1 comparable units currently listed for rent nearby; 6 units permitted in Lassen County in 2024 (0 in 5+ unit buildings).
Forward outlook
- Local home prices are declining (-3.0%/yr); year-one equity from $864 of loan paydown is wiped out by about $4k of value loss. Plan a longer hold.
- Lassen County population projected at -14% by 2050 — secular population decline; favor cash flow + early exit over multi-decade hold.
- At projected returns (-3.0% appreciation + 3.0% rent growth), your $35k cash investment doubles in ~8 years — after that, you're playing with house money.
Negotiation context
- Only 12 days on market — expect competitive offers; lowballing is unlikely to land.
- 2 sale attempts since 6y ago with the ask held roughly flat each time — persistent listings suggest the price (not the market) is what's stuck; bring a comps-based counter.
Risks & watch-outs
- Climate carrying-cost: major wildfire risk — expect insurance premiums to compound above CPI over the hold.
Questions for the listing agent
- Is there a deadline driving the sale (1031 exchange, divorce, estate, relocation)? That informs how much negotiation room exists.
- Schools are A-rated — typically a magnet for longer-tenancy family renters. What's the average tenant stay here, and is there a school-zone premium baked into asking?
- What's the average days-on-market for RENTAL listings here right now (not sales)? A rising rental-DOM trend means longer vacancies and softer asking-rent achievability than the comps imply.
- What's the recent tenant-quality profile in this submarket — average credit score on applications, eviction rate, late-payment / NSF rate, and stable-employment percentage? A property-management company in the area should have these aggregated.
- How much new for-sale + rental construction is in the pipeline within 1–3 miles? Heavy new supply typically softens prices + rents 12–24 months out; constrained supply supports both.
Investment metrics
- 1% rule
- 1.36% ✓
- Cap rate
- 10.92%
- Cash-on-cash
- 16.53%
- DSCR
- 1.74
- GRM
- 6.1
CMA / ARV
- ARV (on-the-fly)
- $225,268
- Comps found
- 11
Show comp detail 11 sales within ~0.75 mi
| Address | Dist | Beds/Ba | Sqft | Sold | Price | $/sf | Match |
|---|---|---|---|---|---|---|---|
| 709-985 Lake Ave | 0.14mi | 3/1.5 | 1,140 (+1%) | 1mo | $229,000 | $201 | 89 |
| 710-260 Lake Ave | 0.10mi | 3/0.5 | 1,127 (-0%) | 7mo | $229,000 | $203 | 87 |
| 710-060 Muskrat Dr | 0.06mi | 3/0.5 | 1,120 (-1%) | 8mo | $223,000 | $199 | 87 |
| 710-225 Willow St | 0.06mi | 3/0.5 | 1,124 (-1%) | 10mo | $180,000 | $160 | 85 |
| 710-065 Lake Ave | 0.12mi | 3/0.5 | 1,140 (+1%) | 14mo | $220,000 | $193 | 80 |
| 710120 Willow St | 0.03mi | 3/2.0 | 1,127 (-0%) | 17mo | $235,000 | $209 | 80 |
| 710-455 Lake Ave | 0.24mi | 3/1.5 | 1,140 (+1%) | 10mo | $165,000 | $145 | 78 |
| 470-730 Levee Ln | 0.17mi | 3/2.0 | 1,088 (-4%) | 5mo | $235,000 | $216 | 77 |
| 709-875 Tamarack St | 0.27mi | 3/2.0 | 1,176 (+4%) | 4mo | $213,000 | $181 | 74 |
| 471-000 Cottonwood Rd | 0.15mi | 3/2.0 | 1,152 (+2%) | 21mo | $230,000 | $200 | 68 |
| 710-445 Lake Ave | 0.23mi | 3/2.0 | 1,064 (-6%) | 17mo | $200,000 | $188 | 61 |
Match score weights: distance 35% · size 25% · config 20% · recency 20%. Top-matched comps best support the ARV.
Projected returns pro-forma
-3.0% appreciation · 3.0% rent growth · sell at horizon
- IRR
- 7.6%
- Equity multiple
- 1.30×
- Total profit
- $10,462
- Equity at exit
- $18,623
- IRR
- 16.9%
- Equity multiple
- 2.39×
- Total profit
- $48,712
- Equity at exit
- $10,799
Cash invested: $34,972 (down + closing). Projections, not guarantees.
Landlord ↔ Tenant lean methodology
- Overall (STATE)
- 18 Strongly Tenant-Friendly
- State California
- 18 Strongly Tenant-Friendly · D+13
- County
- — inherits STATE
- City
- — inherits STATE
ZIP-level market 96130
- Active inventory
- 240
- Price-to-rent
- 6.1×
Monthly cashflow live
- Estimated rent
- $1,700 medium interval (Pro) →
- Mortgage (P&I)
- −$655
- Tax from tax record
- −$154 /mo · $1,852/yr
- Insurance
- −$52
- HOA
- −$0
- Lot rent
- −$0
- Vacancy / Maint / Mgmt
- −$357
- Net cashflow
- $482
Break-even live
Sensitivity live
| Price | -10% $552 | -5% $517 | +0% $482 | +5% $446 | +10% $411 |
|---|---|---|---|---|---|
| Rent | -10% $347 | -5% $415 | +0% $482 | +5% $549 | +10% $616 |
| Rate | -1.0pp $545 | -0.5pp $513 | base $482 | +0.5pp $449 | +1.0pp $416 |
UW: 25.0% down · 7.5% · 30yr · 1.5% tax · 5.0% vac · 8.0% maint · 8.0% mgmt
Financing live
Cash to close
- Down payment
- $31,225
- Closing costs
- $3,747
- Reserves months
- —
- Total cash needed
- —
Loan-product check · same deal, 3 products live
Conventional
25% down · 7.5% · 30yr
- Down + closing
- —
- Monthly P&I
- —
- Monthly cashflow
- —
- DSCR
- —
- Eligible?
- —
Personal DTI + credit; lowest rate.
DSCR
20% down · 8.5% · 30yr
- Down + closing
- —
- Monthly P&I
- —
- Monthly cashflow
- —
- DSCR
- —
- Eligible?
- —
No personal income docs; deal must DSCR.
Hard money
10% down · 12.0% · 12mo
- Down + closing
- —
- Monthly P&I
- —
- Monthly cashflow
- —
- DSCR
- —
- Eligible?
- —
Short-term bridge; refi at stabilization.
Rent comps 1 comps
| Address | Beds | Baths | Sqft | Rent | $/sqft | DOM | Units | Dist |
|---|---|---|---|---|---|---|---|---|
| 709-895 Alder St Susanville, CA | 3.0 | 2.0 | 1152 | $1,700 | $1.48 | 16d | 1 | 0.25mi |
Listing history 11 events
-
2026-06-18status $124,900 Pending 12 DOM
-
2026-06-18days on market $124,900 Active 12 DOM
-
2026-06-17days on market $124,900 Active 11 DOM
-
2026-06-16days on market $124,900 Active 10 DOM
-
2026-06-15days on market $124,900 Active 9 DOM
-
2026-06-14days on market $124,900 Active 7 DOM
-
2026-06-12days on market $124,900 Active 6 DOM
-
2026-06-09days on market $124,900 Active 3 DOM
-
2026-06-08days on market $124,900 Active 2 DOM
-
2026-06-07remarks 567-char remark
-
2026-06-07$124,900 Active 1 DOM
ⓘ Source: listings_history table (triggers on properties + properties_extension) + one-shot
backfill from property_details.listing_events for pre-trigger history.
Tax reassessment forecast CA · Resets to sale price
- Current annual tax
- $1,852 · $154/mo
- Projected year-2 tax
- $1,852 · $154/mo
- Expected delta
- $0/yr ($0/mo · 0.0%)
ⓘ Screening estimate from a state-policy table — verify with the county assessor before closing.
Climate risk First Street
- Flood 1/10 Low FEMA zone X (unshaded) · 0% chance over 30 yrs
- Wildfire 7/10 Severe
- Heat 4/10 Moderate 7 d/yr ≥93°F today · 18 d/yr by 30 yrs out
- Wind 1/10 Low
- Air quality 10/10 Extreme 22 unhealthy d/yr today · 24 by 30 yrs out
Nearby sold comps map
Loading sold comps map…
Walkable amenities ~0.75 mi
Loading nearby amenities…
Taxation est. · year 1
- Rental income
- $20,400
- − Mortgage interest
- −$6,996
- − Property taxes
- −$1,852
- − Insurance
- −$624
- − Repairs & maintenance
- −$1,632
- − Management
- −$1,632
- − Depreciation
- −$3,633
- Taxable income
- $4,030
- Est. tax owed @ 24.0%
- −$967
- After-tax cash flow
- $4,813/yr
For passive investors: Depreciation is non-cash, so a rental often shows a tax loss while cash-flowing — sheltering income. Rental losses are passive: they offset passive income freely, and up to $25,000/yr can offset ordinary (W-2) income if you actively participate and your MAGI is under $100k (phasing out to $0 by $150k); unused losses carry forward. On sale, claimed depreciation is recaptured at up to 25%, and gains may owe capital-gains tax (a 1031 exchange can defer both). Figures are a year-1 estimate at your 24.0% rate — not tax advice; consult a CPA.
Schools (NCES district)
- District
- Shaffer Union Elementary
- NCES district ID
- 0636420
- Math proficiency
- 30% ▼ -5.00%
- Reading proficiency
- 35% ▼ -5.00%
- Median HH income
- $55,545
- Composite
- 31.53/100
- National rank
- #11160
- State rank
- #925 of 1400 in CA
Livability — Johnstonville
- Score
- 70/100
- State rank
- #234
- US rank
- #7626
Category grades
Schools grade is shown separately in the Schools card above.
Census & demographics
- Population (ZIP)
- 20,892
Population outlook (Lassen County) Hauer SSP2
- Today (2025)
- 27,112 people
- By 2030
- 26,732 · -1.4%
- By 2040
- 25,536 · -5.8%
- By 2050
- 23,262 · -14.2%
- By 2075
- 18,620 · -31.3%
- By 2100
- 14,679 · -45.9%
Race, ethnicity, and origin ACS 2023
- Neighborhood character
- Diverse neighborhood (Simpson 0.60)
- Race & ethnicity
- White 57% Hispanic / Latino 26% Two or more races 17% Black 9% Native American 2% Pacific Islander 1% Asian 1%
- Hispanic origin (detail)
- Mexican 23%
- Common ancestry
- Iranian 2% Lithuanian 2% Slovak 2%
- Foreign-born
- 5% · Canada
- Languages at home
- 80% English-only · Spanish 16% Other Asian/Pacific 1% Other Indo-European 1%
Political lean MEDSL · Lassen
- 2024 margin
- Solid R (+54.0) · D 21.8% · R 75.8% · Other 2.4%
- 2008→2024 swing
- -19.8pp toward R · 2008: -34.2pp · 2024: -54.0pp
- All cycles
- 2024: R+54.0 2020: R+51.5 2016: R+51.3 2012: R+39.8 2008: R+34.2
Not yet ingested
- Civics
- —
Market trends
- HPI YoY
- ▼ -126.12%
- Current HPI
- 136.1585
- Rent YoY
- —
- Metro
- —
- State GDP YoY
- ▲ 3.21%
- F500 in state
- 116
Industry mix (Fortune 500 HQ in CA)
| Industry | F500 HQs | Revenue |
|---|---|---|
| Technology | 27 | $1,492B |
|
||
| Financial Services | 3 | $174B |
|
||
| Retail | 3 | $44B |
|
||
| Insurance | 3 | $26B |
|
||
| Media / Entertainment | 2 | $115B |
|
||
| Pharmaceuticals / Biotech | 2 | $62B |
|
||
Price history
+95.2% since first listed8 events — show timeline
- 2026-06-06 Listed $124,900 LAORMLS
- 2021-01-29 Sold (Public Records) $165,000 Public Records
- 2021-01-22 Sold (MLS) $164,900 LAORMLS
- 2020-11-04 Listed $164,900 LAORMLS
- 2012-07-17 Sold (Public Records) $90,000 Public Records
- 2004-11-04 Sold (Public Records) $95,000 Public Records
- 2003-04-24 Sold (Public Records) $85,000 Public Records
- 1995-06-19 Sold (Public Records) $64,000 Public Records
Property tax history
+7.8%/yrLatest (2025): $1,852 · +8.9% YoY. Source: county tax records.
Cash-flow waterfall
monthlySold comps — $/sqft
last 12 mo · ≤1 miLoading sold comps…