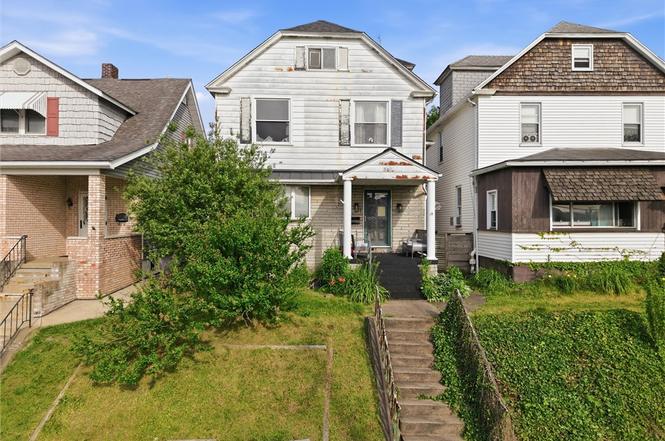
519 Jackson Ave · Vandergrift, PA
Flood risk 1/10 · Minimal
- FEMA flood zone
- X (unshaded)
- Chance of flooding over 30 yrs
- 0.0%
- Est. flood insurance / yr
- $507 – $1,088
Fire risk 1/10 · Minimal
- Est. fire insurance / yr
- $511 – $949
Heat risk 4/10 · Minor
- Hot days now (above 97°F)
- 7 days/yr
- Hot days in 30 yrs
- 19 days/yr
Wind risk 2/10 · Minimal
- Chance of severe wind over 30 yrs
- 0.0%
Air-quality risk 3/10 · Minor
- Unhealthy air days now
- 3 days/yr
- Unhealthy air days in 30 yrs
- 5 days/yr
Risk factors via First Street. Map © Google.
Why this score? — see what drove the D grade
The composite is a weighted blend of 9 inputs, each scored 0–100. Each bar is that input's sub-score; the figure is the points it added to the 100-point composite (weight × sub-score).
- Appreciation +10.0/10.0
- Cash flow +7.9/30.0
- ARV discount +7.5/15.0
- Schools +4.0/10.0
- Livability +3.5/5.0
- Rent growth +2.5/5.0
- Condition / age +2.5/5.0
- 1% rule +2.2/10.0
- DSCR +2.0/10.0
$150,000
🖨 Deal sheet (PDF) 📄 Offer letter ✓ Due diligence
Listing remarks MLS
All but 1 window has been replaced. Hard wood flooring in the Kitchen. First floor laundry room. First floor powder room. Circuit Breakers. Large walk up attic, could be 2 more bedrooms. Nice large entry. Home warranty.
Key facts
- Covered front porch
- Grand entryway
- Beautiful staircase
Tags
Property features AI
Exterior
- Parking: Off-street parking; 2 parking spaces
- Utilities: Public water; Public sewer
- Home design: 3-story home; Resale property; Asphalt roof; Aluminum siding
- Construction: Aluminum siding construction; Asphalt roof; Has home warranty
- Exterior features: Small lot (approx. 0.0856 acres)
Interior
- Kitchen: Refrigerator; Stove; Microwave; Dishwasher
- Bedrooms: Upper-level bedrooms (including two bedrooms listed with dimensions 12x12 and 9x8); Upper-level bonus room (27x13)
- Flooring: Hardwood floors; Ceramic tile
- Bathrooms: One full bathroom; One half bathroom
- Heating & cooling: Forced air heating (gas); Central electric air conditioning
- Interior features: Window treatments; Finished full basement with interior entry
- Laundry & utility: Washer; Dryer; Main-level laundry room (11x10)
Neighborhood map
What this means for you Summary
Snapshot
- This is a 3-bed/1.5-bath other listed at $150k.
Deal economics
- At list price, monthly cash flow is $-161 ($-2k/yr) — negative.
- To cash-flow at today's rent, offer at most $122k (18.9% below list).
- To meet the 1% rule (rent ≥ 1% of price), the offer needs to be $108k (28.3% below list).
- Recommended offer: $108k (28.3% below list) — sets the bar for 1% rule.
Location & tenants
- Location reads 69/100 on livability (#837 in PA) — a middle-class / working-renter tenant base. Strengths: cost of living A+, housing A, health & safety A-; Watch: amenities F, commute F, employment F.
- Kiski Area SD (suburban): math 33% / reading 60% proficiency, ranked #247 of 539 in PA (top 46%) — families likely to look elsewhere, expect single-tenant / working-renter base with shorter leases.
- Zoned schools: Kiski Area East Primary Sch (math 32% / reading 52%, grade F, #883 of 1,518 statewide, top 61%, 423 students, 100% FRL); Kiski Area Ihs (math 20% / reading 56%, grade F, #283 of 512 statewide, top 57%, 543 students, 56% FRL); Kiski Area Hs (math 58%, 1,126 students, 31% FRL) — zoned schools average 62% FRL vs 35% district-wide (27 pts higher); higher-poverty schools than district average — tighter screening recommended.
- Market conditions: 44 active listings in the ZIP; 4 comparable units currently listed for rent nearby; rentals at typical pace (median 19d on market — plan ~3-4 weeks tenant-placement turnaround); 415 units permitted in Westmoreland County in 2024 (10 in 5+ unit buildings).
Forward outlook
- In year one you build about $16k of equity ($1k loan paydown + $15k appreciation (10.0% local appreciation)).
- Westmoreland County population projected at -19% by 2050 — secular population decline; favor cash flow + early exit over multi-decade hold.
- By year 3, paydown + projected appreciation supports a ~$41k cash-out refi (75% LTV) — recoverable capital for the next deal without selling this one.
Negotiation context
- Only 10 days on market — expect competitive offers; lowballing is unlikely to land.
- 3 sale attempts since 25y ago with the ask held roughly flat each time — persistent listings suggest the price (not the market) is what's stuck; bring a comps-based counter.
- Current owner paid $62k; list at $150k implies a 142% gain — meaningful room to come down on a strong offer.
Questions for the listing agent
- What do current leases actually rent for vs. the listed asking? Can we see a recent rent roll and the last 12 months of T-12 income?
- Is there a deadline driving the sale (1031 exchange, divorce, estate, relocation)? That informs how much negotiation room exists.
- Schools are B-rated — typically a magnet for longer-tenancy family renters. What's the average tenant stay here, and is there a school-zone premium baked into asking?
- The area grade is low — what's the realistic commute time and amenity access for the typical tenant pool here? Any planned neighborhood developments (good or bad) we should know about?
- What's the average days-on-market for RENTAL listings here right now (not sales)? A rising rental-DOM trend means longer vacancies and softer asking-rent achievability than the comps imply.
- What's the recent tenant-quality profile in this submarket — average credit score on applications, eviction rate, late-payment / NSF rate, and stable-employment percentage? A property-management company in the area should have these aggregated.
- How much new for-sale + rental construction is in the pipeline within 1–3 miles? Heavy new supply typically softens prices + rents 12–24 months out; constrained supply supports both.
Investment metrics
- 1% rule
- 0.72% ✗
- Cap rate
- 5.01%
- Cash-on-cash
- -4.60%
- DSCR
- 0.80
- GRM
- 11.6
CMA / ARV
No comps found within radius.
Projected returns pro-forma
10.0% appreciation · 3.0% rent growth · sell at horizon
- IRR
- 21.0%
- Equity multiple
- 2.70×
- Total profit
- $71,448
- Equity at exit
- $135,132
- IRR
- 19.0%
- Equity multiple
- 6.20×
- Total profit
- $218,460
- Equity at exit
- $291,417
Cash invested: $42,000 (down + closing). Projections, not guarantees.
Landlord ↔ Tenant lean methodology
- Overall (STATE)
- 62 Landlord-Friendly
- State Pennsylvania
- 62 Landlord-Friendly · EVEN
- County
- — inherits STATE
- City
- — inherits STATE
ZIP-level market 15690
- Home prices YoY
- 10.8%
- Active inventory
- 44
- Price-to-rent
- 11.6×
Monthly cashflow live
- Estimated rent
- $1,075 medium interval (Pro) →
- Mortgage (P&I)
- −$787
- Tax from tax record
- −$161 /mo · $1,934/yr
- Insurance
- −$62
- HOA
- −$0
- Vacancy / Maint / Mgmt
- −$226
- Net cashflow
- $-161
Break-even live
Sensitivity live
| Price | -10% $-76 | -5% $-118 | +0% $-161 | +5% $-203 | +10% $-246 |
|---|---|---|---|---|---|
| Rent | -10% $-246 | -5% $-203 | +0% $-161 | +5% $-118 | +10% $-76 |
| Rate | -1.0pp $-85 | -0.5pp $-123 | base $-161 | +0.5pp $-200 | +1.0pp $-239 |
UW: 25.0% down · 7.5% · 30yr · 1.5% tax · 5.0% vac · 8.0% maint · 8.0% mgmt
Financing live
Cash to close
- Down payment
- $37,500
- Closing costs
- $4,500
- Reserves months
- —
- Total cash needed
- —
Loan-product check · same deal, 3 products live
Conventional
25% down · 7.5% · 30yr
- Down + closing
- —
- Monthly P&I
- —
- Monthly cashflow
- —
- DSCR
- —
- Eligible?
- —
Personal DTI + credit; lowest rate.
DSCR
20% down · 8.5% · 30yr
- Down + closing
- —
- Monthly P&I
- —
- Monthly cashflow
- —
- DSCR
- —
- Eligible?
- —
No personal income docs; deal must DSCR.
Hard money
10% down · 12.0% · 12mo
- Down + closing
- —
- Monthly P&I
- —
- Monthly cashflow
- —
- DSCR
- —
- Eligible?
- —
Short-term bridge; refi at stabilization.
Rent comps 4 comps
| Address | Beds | Baths | Sqft | Rent | $/sqft | DOM | Units | Dist |
|---|---|---|---|---|---|---|---|---|
| 1005 Hancock Ave Vandergrift, PA | 3.0 | 2.0 | 1400 | $1,395 | $1.00 | 19d | 1 | 0.37mi |
| 121 McKinley Ave Vandergrift, PA | 2.0 | 1.0 | 1064 | $795 | $0.75 | 9d | 1 | 0.43mi |
| 121 McKinley Ave Unit 121-B Vandergrift, PA | 2.0 | 1.0 | 1064 | $850 | $0.80 | 45d | 1 | 0.43mi |
| 434 Mckinley Ave Vandergrift - WML, PA | 1.0–2.0 | 1.0 | 933 | $1,098 | $1.18 | 0d | 3 | 0.50mi |
Listing history 7 events
-
2026-06-21days on market $150,000 Active 10 DOM
-
2026-06-18days on market $150,000 Active 7 DOM
-
2026-06-17days on market $150,000 Active 6 DOM
-
2026-06-16days on market $150,000 Active 5 DOM
-
2026-06-15days on market $150,000 Active 4 DOM
-
2026-06-13remarks 699-char remark
-
2026-06-13$150,000 Active 2 DOM
ⓘ Source: listings_history table (triggers on properties + properties_extension) + one-shot
backfill from property_details.listing_events for pre-trigger history.
Tax reassessment forecast PA · Partial reset (capped growth)
- Current annual tax
- $1,934 · $161/mo
- Projected year-2 tax
- $2,152 · $179/mo
- Expected delta
- +$218/yr (+$18/mo · 11.3%)
ⓘ Screening estimate from a state-policy table — verify with the county assessor before closing.
Climate risk First Street
- Flood 1/10 Low FEMA zone X (unshaded) · 0% chance over 30 yrs
- Wildfire 1/10 Low
- Heat 4/10 Moderate 7 d/yr ≥97°F today · 19 d/yr by 30 yrs out
- Wind 2/10 Low 0% chance of damaging wind over 30 yrs
- Air quality 3/10 Moderate 3 unhealthy d/yr today · 5 by 30 yrs out
Nearby sold comps map
Loading sold comps map…
Walkable amenities ~0.75 mi
Loading nearby amenities…
Taxation est. · year 1
- Rental income
- $12,903
- − Mortgage interest
- −$8,402
- − Property taxes
- −$1,934
- − Insurance
- −$750
- − Repairs & maintenance
- −$1,032
- − Management
- −$1,032
- − Depreciation
- −$4,364
- Taxable loss
- −$4,612
- Est. tax savings @ 24.0%
- +$1,107
- After-tax cash flow
- $-824/yr
For passive investors: Depreciation is non-cash, so a rental often shows a tax loss while cash-flowing — sheltering income. Rental losses are passive: they offset passive income freely, and up to $25,000/yr can offset ordinary (W-2) income if you actively participate and your MAGI is under $100k (phasing out to $0 by $150k); unused losses carry forward. On sale, claimed depreciation is recaptured at up to 25%, and gains may owe capital-gains tax (a 1031 exchange can defer both). Figures are a year-1 estimate at your 24.0% rate — not tax advice; consult a CPA.
Schools (NCES district)
- District
- Kiski Area SD
- NCES district ID
- 4212840
- Math proficiency
- 33% ▼ -16.00%
- Reading proficiency
- 60% ▼ -10.00%
- Median HH income
- $49,407
- Composite
- 39.72/100
- National rank
- #3900
- State rank
- #247 of 539 in PA
Livability — Vandergrift
- Score
- 69/100
- State rank
- #837
- US rank
- #8777
Category grades
Schools grade is shown separately in the Schools card above.
Census & demographics
- Census place
- Vandergrift, PA
- Population (ZIP)
- 9,359
Population outlook (Westmoreland County) Hauer SSP2
- Today (2025)
- 342,555 people
- By 2030
- 331,717 · -3.2%
- By 2040
- 304,976 · -11.0%
- By 2050
- 277,444 · -19.0%
- By 2075
- 224,607 · -34.4%
- By 2100
- 171,084 · -50.1%
Race, ethnicity, and origin ACS 2023
- Neighborhood character
- Predominantly White (90%)
- Race & ethnicity
- White 90% Two or more races 7% Black 2% Hispanic / Latino 1%
- Common ancestry
- Romanian 8% Subsaharan African 3% Serbian 2%
- Foreign-born
- 2% · Canada
- Languages at home
- 98% English-only · Other Indo-European 1%
Political lean MEDSL · Westmoreland
- 2024 margin
- Strong R (+28.4) · D 35.4% · R 63.9%
- 2008→2024 swing
- -11.7pp toward R · 2008: -16.7pp · 2024: -28.4pp
- All cycles
- 2024: R+28.4 2020: R+28.3 2016: R+31.3 2012: R+23.7 2008: R+16.7
Not yet ingested
- Civics
- —
Market trends
- HPI YoY
- ▲ 24.69%
- Current HPI
- 253.8806
- Rent YoY
- —
- Metro
- —
- State GDP YoY
- ▲ 1.68%
- F500 in state
- 34
Industry mix (Fortune 500 HQ in PA)
| Industry | F500 HQs | Revenue |
|---|---|---|
| Healthcare | 2 | $309B |
|
||
| Insurance | 2 | $27B |
|
||
| Telecommunications / Media | 1 | $124B |
|
||
| Industrial Distribution | 1 | $22B |
|
||
| Financial Services | 1 | $20B |
|
||
| Chemicals / Materials | 1 | $18B |
|
||
Price history
+180.4% since first listed8 events — show timeline
- 2026-06-08 Listed $150,000 West Penn MLS
- 2009-11-10 Sold (Public Records) $62,000 Public Records
- 2009-11-10 Price Changed $58,900 West Penn MLS
- 2009-11-06 Sold (MLS) $62,000 West Penn MLS
- 2009-09-17 Listed $62,000 West Penn MLS
- 2001-05-01 Sold (Public Records) $50,000 Public Records
- 2001-04-30 Sold (MLS) $50,000 West Penn MLS
- 2001-01-29 Listed $53,500 West Penn MLS
Property tax history
+2.3%/yrLatest (2026): $1,934 · +1.2% YoY. Source: county tax records.
Cash-flow waterfall
monthlySold comps — $/sqft
last 12 mo · ≤1 miLoading sold comps…