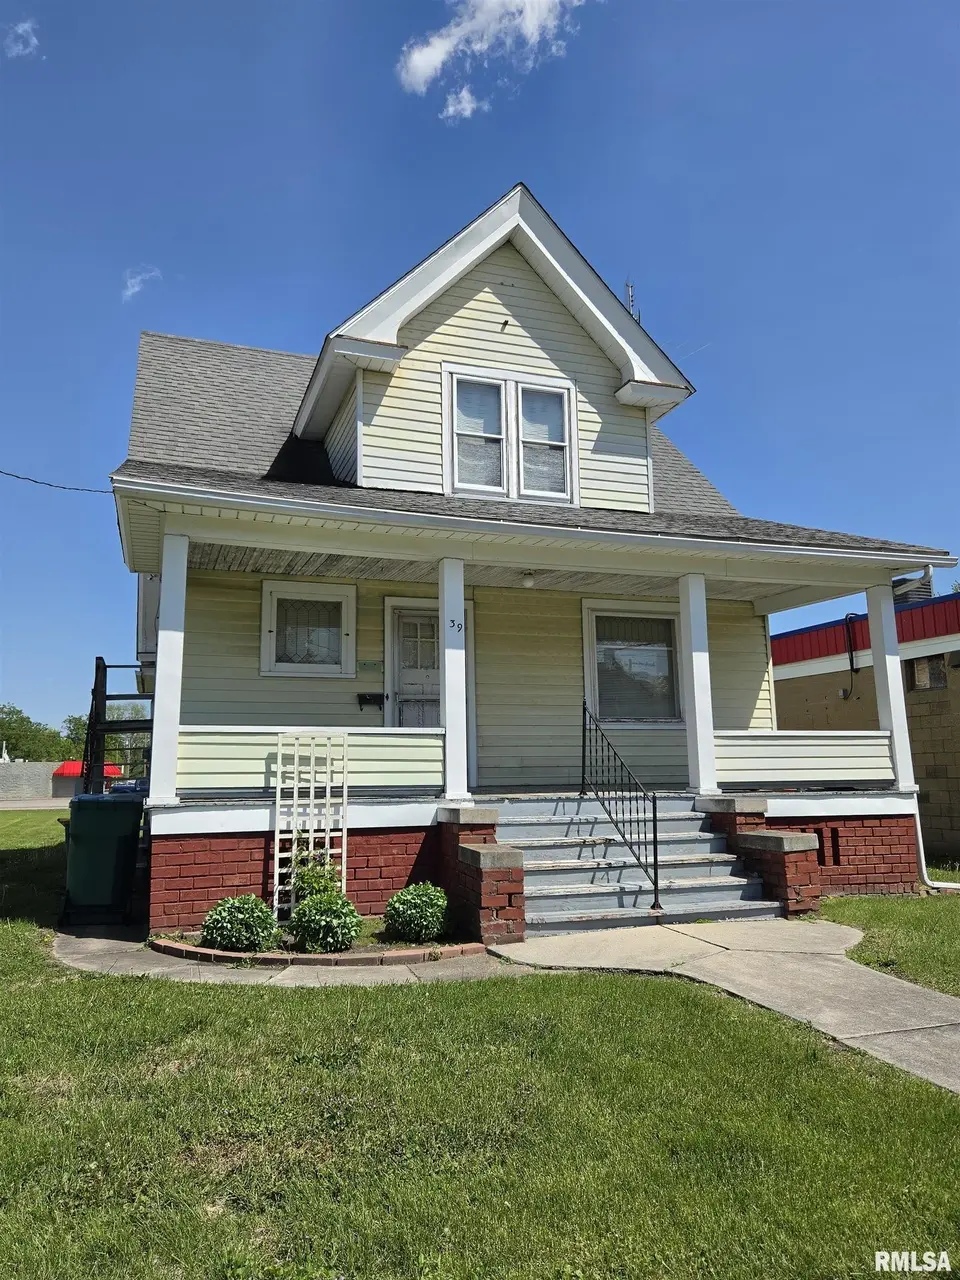
39 Arnold St · Galesburg, IL
Flood risk 1/10 · Minimal
- FEMA flood zone
- X (unshaded)
- Chance of flooding over 30 yrs
- 0.0%
- Est. flood insurance / yr
- $473 – $860
Fire risk 1/10 · Minimal
- Est. fire insurance / yr
- $804 – $1,492
Heat risk 3/10 · Minor
- Hot days now (above 104°F)
- 7 days/yr
- Hot days in 30 yrs
- 17 days/yr
Wind risk 2/10 · Minimal
- Chance of severe wind over 30 yrs
- 1.0%
Air-quality risk 3/10 · Minor
- Unhealthy air days now
- 2 days/yr
- Unhealthy air days in 30 yrs
- 3 days/yr
Risk factors via First Street. Map © Google.
Why this score? — see what drove the B grade
The composite is a weighted blend of 9 inputs, each scored 0–100. Each bar is that input's sub-score; the figure is the points it added to the 100-point composite (weight × sub-score).
- Cash flow +30.0/30.0
- ARV discount +15.0/15.0
- 1% rule +10.0/10.0
- DSCR +10.0/10.0
- Livability +3.5/5.0
- Rent growth +2.5/5.0
- Condition / age +2.5/5.0
- Schools +1.4/10.0
- Appreciation +0.0/10.0
$57,000
🖨 Deal sheet (PDF) 📄 Offer letter ✓ Due diligence
Listing remarks
This well-built Craftsman style home is priced to sell, complete with charming features such as leaded glass windows, hardwood floors under the carpet, and a sizeable front porch. The large entry foyer is currently a main floor bedroom, with a full bath off of the eat-in kitchen. Big pantry and formal dining room too! Upstairs are 3 bedrooms and another full bath. There is a separate entrance to the 2nd floor, which was once an apartment. The stove hookup and kitchen sink are still there, if a second unit is desired. Lots of storage with large closets! A nice dry basement offers plenty of room and can easily be finished living space as well. The washer and dryer are conveniently located at
Key facts
- Sizeable front porch
- Big pantry
- Leaded glass windows
Tags
Property features AI
Exterior
- Parking: No garage spaces listed; Other parking features
- Utilities: Public water; Public sewer
- Home design: Single family residence; Built in 1913
- Construction: 1002 total building area
- Exterior features: Shingle roof; Level lot; Lot dimensions approximately 44 x 101 x 44 x 101
Interior
- Kitchen: Refrigerator; Microwave
- Bedrooms: Three bedrooms — primary bedroom on the upper level (two other bedrooms also on upper level); Bedroom dimensions approximately: 12 x 10.2, 12 x 10, and 9.6 x 9.6; Bedrooms have egress windows
- Flooring: Hardwood in some upstairs bedrooms; Carpet in living areas, dining, and some bedrooms; Vinyl in basement laundry
- Bathrooms: Two full bathrooms and one half bathroom
- Heating & cooling: Forced air heating; Gas water heater; Window unit(s) for cooling
- Interior features: Full basement; Level lot (mentioned with interior/room info)
- Laundry & utility: Washer and Dryer; Basement laundry area (vinyl flooring)
Neighborhood map
What this means for you Summary
Snapshot
- This is a 3-bed/2.5-bath single-family listed at $57k.
Deal economics
- At list price, monthly cash flow is $458 ($5k/yr) — positive.
- The deal already cash-flows at list — no discount required.
- Meets the 1% rule at list price ($1k rent vs $57k).
- Recommended offer: $55k (3.0% below list) — sets the bar for market timing.
- Cap rate 15.9% vs local median 6.4% in Galesburg — top-decile yield for the area; either an underpriced asset or a hidden risk that comps aren't pricing in. Stress-test before assuming the spread holds.
Location & tenants
- Location reads 70/100 on livability (#367 in IL) — a middle-class / working-renter tenant base. Strengths: cost of living A+, housing A+, health & safety A+; Watch: crime F, commute F, employment D-.
- Galesburg CUSD 205 (town): math 13% / reading 22% proficiency, ranked #488 of 620 in IL (top 79%) — low school quality limits family demand, transient renter base, plan for 1-2y turnover.
- Zoned schools: King School (math 8% / reading 17%, grade F, #1,371 of 2,056 statewide, top 68%, 531 students, 0% FRL); Lombard Middle School (math 6% / reading 16%, grade F, #574 of 665 statewide, top 87%, 532 students, 0% FRL); Galesburg Senior High School (math 19% / reading 24%, grade F, #345 of 693 statewide, top 50%, 1,762 students, 0% FRL) — zoned schools average 0% FRL vs 60% district-wide (60 pts lower); this property's tenant base skews higher-income than the district average.
- Market conditions: 198 active listings in the ZIP.
Forward outlook
- Local home prices are declining (-3.0%/yr); year-one equity from $394 of loan paydown is wiped out by about $2k of value loss. Plan a longer hold.
- Knox County population projected at -19% by 2050 — secular population decline; favor cash flow + early exit over multi-decade hold.
- At projected returns (-3.0% appreciation + 3.0% rent growth), your $16k cash investment doubles in ~4 years — after that, you're playing with house money.
Negotiation context
- It's been on market 48 days — a 3% lower offer ($55k) is reasonable based on typical stale-listing flexibility.
Risks & watch-outs
- Watch-outs: built in 1913 — expect roof / HVAC / electrical / plumbing capex.
Questions for the listing agent
- It's been on market 48 days. Have you received any prior offers? Is the seller open to a 3% concession, seller financing, or rate buy-down credit?
- Built in 1913 — when were the roof, HVAC, electrical panel, plumbing, and water heater last replaced?
- Is there a deadline driving the sale (1031 exchange, divorce, estate, relocation)? That informs how much negotiation room exists.
- Schools are F-rated, which usually means shorter tenancies and higher turnover. Who's the typical renter profile here, and what's been the actual vacancy rate?
- Crime grade is F in this area — have there been break-ins, vandalism, or insurance claims at this property in the last 3 years? What carrier currently insures it and at what premium?
- What's the average days-on-market for RENTAL listings here right now (not sales)? A rising rental-DOM trend means longer vacancies and softer asking-rent achievability than the comps imply.
- What's the recent tenant-quality profile in this submarket — average credit score on applications, eviction rate, late-payment / NSF rate, and stable-employment percentage? A property-management company in the area should have these aggregated.
- How much new for-sale + rental construction is in the pipeline within 1–3 miles? Heavy new supply typically softens prices + rents 12–24 months out; constrained supply supports both.
Investment metrics
- 1% rule
- 1.89% ✓
- Cap rate
- 15.93%
- Cash-on-cash
- 34.42%
- DSCR
- 2.53
- GRM
- 4.4
CMA / ARV
- ARV (median comp)
- $68,716
- List price
- $57,000
- Delta
- -17.05%
- Verdict
- UNDERPRICED
- Comps
- 20 within 1.0 mi
Show comp detail 12 sales within ~0.75 mi
| Address | Dist | Beds/Ba | Sqft | Sold | Price | $/sf | Match |
|---|---|---|---|---|---|---|---|
| 187 Silver St | 0.22mi | 3/1.0 | 880 (+1%) | 7mo | $65,000 | $74 | 77 |
| 85 Phillips St | 0.09mi | 2/1.0 (-1) | 848 (-3%) | 9mo | $54,000 | $64 | 72 |
| 100 Lake St | 0.30mi | 2/1.0 (-1) | 860 (-1%) | 8mo | $84,000 | $98 | 66 |
| 95 Phillips St | 0.10mi | 2/1.0 (-1) | 964 (+11%) | 8mo | $55,000 | $57 | 60 |
| 1397 Haynor St | 0.22mi | 2/1.0 (-1) | 980 (+12%) | 3mo | $71,000 | $72 | 55 |
| 1961 Washington St | 0.35mi | 2/1.0 (-1) | 952 (+9%) | 9mo | $54,900 | $58 | 50 |
| 756 Arnold St | 0.58mi | 3/1.0 | 960 (+10%) | 1mo | $77,000 | $80 | 50 |
| 1586 E North St | 0.22mi | 2/1.0 (-1) | 768 (-12%) | 11mo | $25,000 | $33 | 49 |
| 1526 Grand Ave | 0.43mi | 2/1.0 (-1) | 792 (-9%) | 9mo | $44,400 | $56 | 46 |
| 763 Mulberry St | 0.63mi | 2/1.0 (-1) | 960 (+10%) | 2mo | $35,000 | $36 | 41 |
| 1828 Baird Ave | 0.73mi | 2/1.0 (-1) | 780 (-11%) | 4mo | $82,500 | $106 | 33 |
| 1837 Baird Ave | 0.73mi | 2/1.0 (-1) | 978 (+12%) | 9mo | $97,000 | $99 | 27 |
Match score weights: distance 35% · size 25% · config 20% · recency 20%. Top-matched comps best support the ARV.
Projected returns pro-forma
-3.0% appreciation · 3.0% rent growth · sell at horizon
- IRR
- 29.9%
- Equity multiple
- 2.25×
- Total profit
- $19,937
- Equity at exit
- $8,499
- IRR
- 37.2%
- Equity multiple
- 4.44×
- Total profit
- $54,972
- Equity at exit
- $4,928
Cash invested: $15,960 (down + closing). Projections, not guarantees.
Landlord ↔ Tenant lean methodology
- Overall (STATE)
- 43 Moderately Tenant-Leaning
- State Illinois
- 43 Moderately Tenant-Leaning · D+7
- County
- — inherits STATE
- City
- — inherits STATE
ZIP-level market 61401
- Active inventory
- 198
- Price-to-rent
- 4.4×
Monthly cashflow live
- Estimated rent
- $1,078 medium interval (Pro) →
- Mortgage (P&I)
- −$299
- Tax est. 1.5%
- −$71 /mo · $855/yr
- Insurance
- −$24
- HOA
- −$0
- Vacancy / Maint / Mgmt
- −$226
- Net cashflow
- $458
Break-even live
Sensitivity live
| Price | -10% $497 | -5% $477 | +0% $458 | +5% $438 | +10% $418 |
|---|---|---|---|---|---|
| Rent | -10% $373 | -5% $415 | +0% $458 | +5% $500 | +10% $543 |
| Rate | -1.0pp $487 | -0.5pp $472 | base $458 | +0.5pp $443 | +1.0pp $428 |
UW: 25.0% down · 7.5% · 30yr · 1.5% tax · 5.0% vac · 8.0% maint · 8.0% mgmt
Financing live
Cash to close
- Down payment
- $14,250
- Closing costs
- $1,710
- Reserves months
- —
- Total cash needed
- —
Loan-product check · same deal, 3 products live
Conventional
25% down · 7.5% · 30yr
- Down + closing
- —
- Monthly P&I
- —
- Monthly cashflow
- —
- DSCR
- —
- Eligible?
- —
Personal DTI + credit; lowest rate.
DSCR
20% down · 8.5% · 30yr
- Down + closing
- —
- Monthly P&I
- —
- Monthly cashflow
- —
- DSCR
- —
- Eligible?
- —
No personal income docs; deal must DSCR.
Hard money
10% down · 12.0% · 12mo
- Down + closing
- —
- Monthly P&I
- —
- Monthly cashflow
- —
- DSCR
- —
- Eligible?
- —
Short-term bridge; refi at stabilization.
Listing history 20 events
-
2026-06-22days on market $57,000 Active 48 DOM
-
2026-06-21days on market $57,000 Active 47 DOM
-
2026-06-21days on market $57,000 Active 46 DOM
-
2026-06-18days on market $57,000 Active 44 DOM
-
2026-06-17days on market $57,000 Active 43 DOM
-
2026-06-16days on market $57,000 Active 42 DOM
-
2026-06-15days on market $57,000 Active 41 DOM
-
2026-06-13days on market $57,000 Active 39 DOM
-
2026-06-12days on market $57,000 Active 38 DOM
-
2026-06-09days on market $57,000 Active 35 DOM
-
2026-06-09price $57,000 Active 34 DOM
-
2026-06-08days on market $67,000 Active 34 DOM
-
2026-06-07days on market $67,000 Active 33 DOM
-
2026-06-07days on market $67,000 Active 32 DOM
-
2026-06-04days on market $67,000 Active 29 DOM
-
2026-06-02days on market $67,000 Active 28 DOM
-
2026-06-01days on market $67,000 Active 27 DOM
-
2026-05-31days on market $67,000 Active 26 DOM
-
2026-05-31days on market $67,000 Active 25 DOM
-
2026-05-05$67,000 Active 1025-char remark
ⓘ Source: listings_history table (triggers on properties + properties_extension) + one-shot
backfill from property_details.listing_events for pre-trigger history.
Climate risk First Street
- Flood 1/10 Low FEMA zone X (unshaded) · 0% chance over 30 yrs
- Wildfire 1/10 Low
- Heat 3/10 Moderate 7 d/yr ≥104°F today · 17 d/yr by 30 yrs out
- Wind 2/10 Low 100% chance of damaging wind over 30 yrs
- Air quality 3/10 Moderate 2 unhealthy d/yr today · 3 by 30 yrs out
Nearby sold comps map
Loading sold comps map…
Walkable amenities ~0.75 mi
Loading nearby amenities…
Taxation est. · year 1
- Rental income
- $12,937
- − Mortgage interest
- −$3,193
- − Property taxes
- −$855
- − Insurance
- −$285
- − Repairs & maintenance
- −$1,035
- − Management
- −$1,035
- − Depreciation
- −$1,658
- Taxable income
- $4,876
- Est. tax owed @ 24.0%
- −$1,170
- After-tax cash flow
- $4,323/yr
For passive investors: Depreciation is non-cash, so a rental often shows a tax loss while cash-flowing — sheltering income. Rental losses are passive: they offset passive income freely, and up to $25,000/yr can offset ordinary (W-2) income if you actively participate and your MAGI is under $100k (phasing out to $0 by $150k); unused losses carry forward. On sale, claimed depreciation is recaptured at up to 25%, and gains may owe capital-gains tax (a 1031 exchange can defer both). Figures are a year-1 estimate at your 24.0% rate — not tax advice; consult a CPA.
Schools (NCES district)
- District
- Galesburg CUSD 205
- NCES district ID
- 1716080
- Math proficiency
- 13% ▼ -8.00%
- Reading proficiency
- 22% ▼ -11.00%
- Median HH income
- $35,901
- Composite
- 14.46/100
- National rank
- #9427
- State rank
- #488 of 620 in IL
Livability — Galesburg
- Score
- 70/100
- State rank
- #367
- US rank
- #7601
Category grades
Schools grade is shown separately in the Schools card above.
Census & demographics
- Census place
- Galesburg, IL
- City population
- 32,318
- Population (ZIP)
- 30,684
Population outlook (Knox County) Hauer SSP2
- Today (2025)
- 48,224 people
- By 2030
- 46,333 · -3.9%
- By 2040
- 42,424 · -12.0%
- By 2050
- 38,929 · -19.3%
- By 2075
- 31,523 · -34.6%
- By 2100
- 24,092 · -50.0%
Race, ethnicity, and origin ACS 2023
- Neighborhood character
- Predominantly White (77%)
- Race & ethnicity
- White 77% Black 8% Hispanic / Latino 8% Two or more races 8% Asian 1%
- Hispanic origin (detail)
- Mexican 6%
- Common ancestry
- Italian 2% Serbian 1% Slovak 1%
- Foreign-born
- 4% · Canada, Vietnam
- Languages at home
- 92% English-only · Spanish 5% French/Haitian/Cajun 1% Other Indo-European 1%
Political lean MEDSL · Knox
- 2024 margin
- Lean R (+9.4) · D 44.4% · R 53.7% · Other 1.9%
- 2008→2024 swing
- -29.3pp toward R · 2008: 19.9pp · 2024: -9.4pp
- All cycles
- 2024: R+9.4 2020: R+5.6 2016: R+3.3 2012: D+17.1 2008: D+19.9
Not yet ingested
- Civics
- —
Market trends
- HPI YoY
- ▼ -95.48%
- Current HPI
- 157.276
- Rent YoY
- —
- Metro
- —
- State GDP YoY
- ▲ 1.59%
- F500 in state
- 60
Industry mix (Fortune 500 HQ in IL)
| Industry | F500 HQs | Revenue |
|---|---|---|
| Insurance | 4 | $201B |
|
||
| Consumer Goods | 4 | $87B |
|
||
| Industrial Machinery | 3 | $64B |
|
||
| Healthcare | 2 | $55B |
|
||
| Retail / Pharmacy | 1 | $148B |
|
||
| Agriculture / Food | 1 | $86B |
|
||
Price history
-14.9% since first listed2 events — show timeline
- 2026-06-08 Price Changed $57,000 RMLSA as Distributed by MLS Grid
- 2026-05-05 Listed $67,000 RMLSA as Distributed by MLS Grid
Cash-flow waterfall
monthlySold comps — $/sqft
last 12 mo · ≤1 miLoading sold comps…