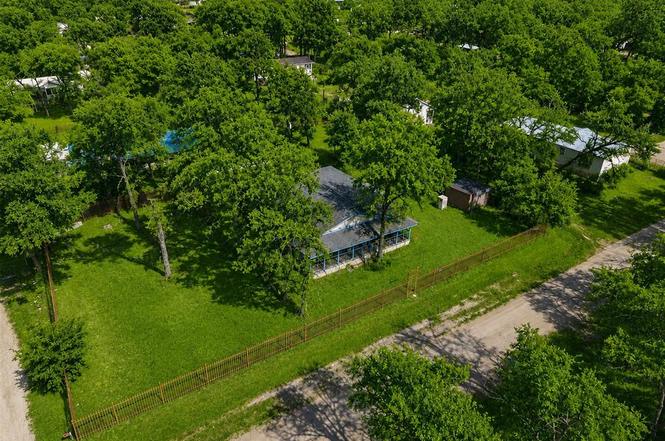
108 Blackfoot Dr · Enchanted Oaks, TX
Flood risk 1/10 · Minimal
- FEMA flood zone
- X (unshaded)
- Chance of flooding over 30 yrs
- 0.0%
- Est. flood insurance / yr
- $507 – $1,088
Fire risk 3/10 · Minor
- Est. fire insurance / yr
- $1,222 – $2,270
Heat risk 7/10 · Major
- Hot days now (above 109°F)
- 7 days/yr
- Hot days in 30 yrs
- 26 days/yr
Wind risk 6/10 · Moderate
- Chance of severe wind over 30 yrs
- 61.0%
Air-quality risk 2/10 · Minimal
- Unhealthy air days now
- 0 days/yr
- Unhealthy air days in 30 yrs
- 1 days/yr
Risk factors via First Street. Map © Google.
Why this score? — see what drove the B- grade
The composite is a weighted blend of 9 inputs, each scored 0–100. Each bar is that input's sub-score; the figure is the points it added to the 100-point composite (weight × sub-score).
- Cash flow +24.9/30.0
- ARV discount +15.0/15.0
- DSCR +8.1/10.0
- 1% rule +8.0/10.0
- Schools +3.2/10.0
- Livability +3.0/5.0
- Condition / age +2.5/5.0
- Rent growth +1.1/5.0
- Appreciation +0.0/10.0
$110,000
🖨 Deal sheet (PDF) 📄 Offer letter ✓ Due diligence
Listing remarks
Three adjoining lots offer a rare opportunity in an area experiencing ongoing growth and redevelopment. The property includes a 2-bedroom, 1-bath home with wraparound porches, a detached shop, and mature trees throughout the site. The existing improvements are in need of renovation and are being offered as-is, presenting an opportunity for investors, builders, or buyers seeking a project with significant upside potential. Located just minutes from the reservoir and surrounded by a mix of established homes and new construction, the property offers flexibility for renovation, redevelopment, or other future uses. With multiple lots included, buyers may wish to explore subdivision or developmen
Key facts
- Detached shop
- Wraparound porches
- Mature trees
Tags
Property features AI
Finance
- Other: Listing is active and offered for sale; Possession at closing/funding
- Financial info: Acceptable financing: Cash and Conventional; Treat as clear loan type; No second mortgage indicated
- HOA & community: Mandatory association; Annual association fee of 126; Association provides maintenance of grounds and full use of facilities; HOA managed by Indian Harbor
Exterior
- Parking: Carport (1 space); Covered parking (1 space); Gated on-site parking
- Security: Security features unknown
- Utilities: City sewer; Co-op water; Not in a municipal utility district
- Home design: Single family residence; One story; Not attached to another property; Development restrictions apply; Multiple parcel IDs
- Construction: Built in 1992 (preowned); Siding exterior; Composition and metal roof; Pillar/post/pier foundation
- Exterior features: Covered porch(es); Front porch; Side porch; Deck; Storage; Wrought iron fencing; Partially wooded yard; Interior lot with many trees; Easements: other
Interior
- Kitchen: Gas range; Refrigerator
- Bedrooms: Primary bedroom on level 1 (one)
- Flooring: Carpet
- Bathrooms: 1 full bathroom
- Heating & cooling: Central heating (electric); Central air conditioning (electric)
- Interior features: Vaulted ceilings; One living area; One dining area; 3 total rooms
- Laundry & utility: On-site laundry
Neighborhood map
What this means for you Summary
Snapshot
- This is a 2-bed/1.0-bath single-family listed at $110k.
Deal economics
- At list price, monthly cash flow is $236 ($3k/yr) — positive.
- The deal already cash-flows at list — no discount required.
- Meets the 1% rule at list price ($1k rent vs $110k).
- Cap rate 8.9% vs local median 2.2% in Enchanted Oaks — top-decile yield for the area; either an underpriced asset or a hidden risk that comps aren't pricing in. Stress-test before assuming the spread holds.
Location & tenants
- Location reads 60/100 on livability (#1,103 in TX) — a middle-class / working-renter tenant base. Strengths: cost of living A+, crime A, housing A; Watch: amenities F, commute F, health & safety F.
- Eustace ISD (rural): math 32% / reading 45% proficiency, ranked #455 of 826 in TX (top 55%) — families likely to look elsewhere, expect single-tenant / working-renter base with shorter leases; 62% free/reduced lunch — lower-income household profile, screen leases tightly.
- Zoned schools: Eustace Pri (497 students, 74% FRL); Eustace Middle (math 34% / reading 44%, grade F, #690 of 1,662 statewide, top 42%, 382 students, 63% FRL); Eustace H S (math 22% / reading 57%, grade F, #821 of 1,632 statewide, top 53%, 473 students, 56% FRL) — zoned schools at 64% FRL track the district average.
- Market conditions: Rents falling (-5.8%/yr); 699 active listings in the ZIP; 1 comparable units currently listed for rent nearby; 263 units permitted in Henderson County in 2024 (0 in 5+ unit buildings).
Forward outlook
- Local home prices are declining (-3.0%/yr); year-one equity from $761 of loan paydown is wiped out by about $3k of value loss. Plan a longer hold.
Negotiation context
- Only 2 days on market — expect competitive offers; lowballing is unlikely to land.
- 3 sale attempts with the ask held roughly flat each time — persistent listings suggest the price (not the market) is what's stuck; bring a comps-based counter.
Risks & watch-outs
- Watch-outs: property tax is 2.8% of price.
- Climate carrying-cost: major wind risk, 61% chance of damaging wind over 30y; extreme-heat days projected 7→26/yr by 2055 (HVAC capex compounding) — expect insurance premiums to compound above CPI over the hold.
Questions for the listing agent
- Property tax is high relative to price — has the assessment been appealed recently, and will the sale trigger a re-assessment?
- What does the HOA fee cover, when was the last increase, and are there any pending special assessments or reserve-fund shortfalls?
- Is there a deadline driving the sale (1031 exchange, divorce, estate, relocation)? That informs how much negotiation room exists.
- Schools are F-rated, which usually means shorter tenancies and higher turnover. Who's the typical renter profile here, and what's been the actual vacancy rate?
- What's the average days-on-market for RENTAL listings here right now (not sales)? A rising rental-DOM trend means longer vacancies and softer asking-rent achievability than the comps imply.
- What's the recent tenant-quality profile in this submarket — average credit score on applications, eviction rate, late-payment / NSF rate, and stable-employment percentage? A property-management company in the area should have these aggregated.
- How much new for-sale + rental construction is in the pipeline within 1–3 miles? Heavy new supply typically softens prices + rents 12–24 months out; constrained supply supports both.
Investment metrics
- 1% rule
- 1.30% ✓
- Cap rate
- 8.86%
- Cash-on-cash
- 9.18%
- DSCR
- 1.41
- GRM
- 6.4
CMA / ARV
- ARV (on-the-fly)
- $194,400
- Comps found
- 12
Show comp detail 12 sales within ~0.75 mi
| Address | Dist | Beds/Ba | Sqft | Sold | Price | $/sf | Match |
|---|---|---|---|---|---|---|---|
| 106 Comanche Dr | 0.25mi | 3/2.0 (+1) | 1,200 (0%) | 7mo | $190,000 | $158 | 74 |
| 6142 Inca Dr | 0.12mi | 3/2.0 (+1) | 1,248 (+4%) | 8mo | $213,000 | $171 | 72 |
| 6130 Inca Dr | 0.12mi | 3/2.0 (+1) | 1,250 (+4%) | 10mo | $202,000 | $162 | 70 |
| 116 Navajo Dr | 0.10mi | 3/2.0 (+1) | 1,080 (-10%) | 7mo | $174,900 | $162 | 64 |
| 6105 Chickasaw Dr | 0.18mi | 3/2.0 (+1) | 1,350 (+12%) | 2mo | $196,500 | $146 | 60 |
| 112 Pierce Dr | 0.25mi | 3/2.0 (+1) | 1,296 (+8%) | 7mo | $149,000 | $115 | 60 |
| 140 Mohican Trl | 0.51mi | 3/2.0 (+1) | 1,200 (0%) | 11mo | $180,000 | $150 | 58 |
| 6185 Apache Dr | 0.34mi | 2/2.0 | 1,056 (-12%) | 6mo | $349,900 | $331 | 56 |
| 162 Aztec Dr | 0.23mi | 3/2.0 (+1) | 1,377 (+15%) | 4mo | $539,000 | $391 | 52 |
| 6114 Inca Dr | 0.16mi | 3/2.0 (+1) | 1,364 (+14%) | 11mo | $215,000 | $158 | 52 |
| 106 Ute Trl | 0.64mi | 3/2.0 (+1) | 1,250 (+4%) | 3mo | $209,000 | $167 | 51 |
| 6171 Inca Dr | 0.25mi | 1/2.0 (-1) | 1,368 (+14%) | 11mo | $230,000 | $168 | 47 |
Match score weights: distance 35% · size 25% · config 20% · recency 20%. Top-matched comps best support the ARV.
Projected returns pro-forma
-3.0% appreciation · 0.0% rent growth · sell at horizon
- IRR
- -6.3%
- Equity multiple
- 0.78×
- Total profit
- $-6,900
- Equity at exit
- $16,401
- IRR
- -1.4%
- Equity multiple
- 0.92×
- Total profit
- $-2,460
- Equity at exit
- $9,511
Cash invested: $30,800 (down + closing). Projections, not guarantees.
Landlord ↔ Tenant lean methodology
- Overall (STATE)
- 87 Strongly Landlord-Friendly
- State Texas
- 87 Strongly Landlord-Friendly · R+5
- County
- — inherits STATE
- City
- — inherits STATE
ZIP-level market 75156
- Rents YoY
- -5.8%
- Active inventory
- 699
- Price-to-rent
- 6.4×
Monthly cashflow live
- Estimated rent
- $1,431 medium interval (Pro) →
- Mortgage (P&I)
- −$577
- Tax from tax record
- −$261 /mo · $3,135/yr
- Insurance
- −$46
- HOA
- −$11
- Vacancy / Maint / Mgmt
- −$301
- Net cashflow
- $236
Break-even live
Sensitivity live
| Price | -10% $298 | -5% $267 | +0% $236 | +5% $205 | +10% $173 |
|---|---|---|---|---|---|
| Rent | -10% $123 | -5% $179 | +0% $236 | +5% $292 | +10% $349 |
| Rate | -1.0pp $291 | -0.5pp $264 | base $236 | +0.5pp $207 | +1.0pp $178 |
UW: 25.0% down · 7.5% · 30yr · 1.5% tax · 5.0% vac · 8.0% maint · 8.0% mgmt
Financing live
Cash to close
- Down payment
- $27,500
- Closing costs
- $3,300
- Reserves months
- —
- Total cash needed
- —
Loan-product check · same deal, 3 products live
Conventional
25% down · 7.5% · 30yr
- Down + closing
- —
- Monthly P&I
- —
- Monthly cashflow
- —
- DSCR
- —
- Eligible?
- —
Personal DTI + credit; lowest rate.
DSCR
20% down · 8.5% · 30yr
- Down + closing
- —
- Monthly P&I
- —
- Monthly cashflow
- —
- DSCR
- —
- Eligible?
- —
No personal income docs; deal must DSCR.
Hard money
10% down · 12.0% · 12mo
- Down + closing
- —
- Monthly P&I
- —
- Monthly cashflow
- —
- DSCR
- —
- Eligible?
- —
Short-term bridge; refi at stabilization.
Rent comps 1 comps
| Address | Beds | Baths | Sqft | Rent | $/sqft | DOM | Units | Dist |
|---|---|---|---|---|---|---|---|---|
| 114 Sierra Madre St Mabank, TX | 3.0 | 2.0 | 1268 | $1,800 | $1.42 | 45d | 1 | 1.27mi |
HOA detail
- Monthly dues
- $11 · $132/yr
Listing history 3 events
-
2026-06-19days on market $110,000 Active 2 DOM
-
2026-06-18remarks 699-char remark
-
2026-06-18$110,000 Active 1 DOM
ⓘ Source: listings_history table (triggers on properties + properties_extension) + one-shot
backfill from property_details.listing_events for pre-trigger history.
Tax reassessment forecast TX · Resets to sale price
- Current annual tax
- $3,135 · $261/mo
- Projected year-2 tax
- $3,135 · $261/mo
- Expected delta
- $0/yr ($0/mo · 0.0%)
ⓘ Screening estimate from a state-policy table — verify with the county assessor before closing.
Climate risk First Street
- Flood 1/10 Low FEMA zone X (unshaded) · 0% chance over 30 yrs
- Wildfire 3/10 Moderate
- Heat 7/10 Severe 7 d/yr ≥109°F today · 26 d/yr by 30 yrs out
- Wind 6/10 Major 61% chance of damaging wind over 30 yrs
- Air quality 2/10 Low 0 unhealthy d/yr today · 1 by 30 yrs out
Nearby sold comps map
Loading sold comps map…
Walkable amenities ~0.75 mi
Loading nearby amenities…
Taxation est. · year 1
- Rental income
- $17,174
- − Mortgage interest
- −$6,162
- − Property taxes
- −$3,135
- − Insurance
- −$550
- − Repairs & maintenance
- −$1,374
- − Management
- −$1,374
- − HOA
- −$132
- − Depreciation
- −$3,200
- Taxable income
- $1,248
- Est. tax owed @ 24.0%
- −$300
- After-tax cash flow
- $2,529/yr
For passive investors: Depreciation is non-cash, so a rental often shows a tax loss while cash-flowing — sheltering income. Rental losses are passive: they offset passive income freely, and up to $25,000/yr can offset ordinary (W-2) income if you actively participate and your MAGI is under $100k (phasing out to $0 by $150k); unused losses carry forward. On sale, claimed depreciation is recaptured at up to 25%, and gains may owe capital-gains tax (a 1031 exchange can defer both). Figures are a year-1 estimate at your 24.0% rate — not tax advice; consult a CPA.
Schools (NCES district)
- District
- Eustace ISD
- NCES district ID
- 4818720
- Math proficiency
- 32% ▼ -18.00%
- Reading proficiency
- 45% ▼ -7.00%
- Median HH income
- $42,425
- Composite
- 32.48/100
- National rank
- #5711
- State rank
- #455 of 826 in TX
Livability — Enchanted Oaks
- Score
- 60/100
- State rank
- #1103
- US rank
- #19536
Category grades
Schools grade is shown separately in the Schools card above.
Census & demographics
- County
- Henderson County · 34,977 people
- Metro
- Athens, TX
- Population (ZIP)
- 16,333
- Household income
- $60,867
- Rent vs Own
- Severe rent burden
- 400.0
Population outlook (Henderson County) Hauer SSP2
- Today (2025)
- 80,471 people
- By 2030
- 80,608 · +0.2%
- By 2040
- 80,087 · -0.5%
- By 2050
- 78,208 · -2.8%
- By 2075
- 72,423 · -10.0%
- By 2100
- 61,012 · -24.2%
Race, ethnicity, and origin ACS 2023
- Neighborhood character
- Predominantly White (85%)
- Race & ethnicity
- White 85% Hispanic / Latino 7% Two or more races 7% Black 1%
- Hispanic origin (detail)
- Mexican 5%
- Common ancestry
- Slovak 3% Serbian 2% European 2%
- Foreign-born
- 4% · Canada, Jamaica
- Languages at home
- 94% English-only · Spanish 4% Other Indo-European 1%
Political lean MEDSL · Henderson
- 2024 margin
- Solid R (+63.5) · D 18.0% · R 81.4%
- 2008→2024 swing
- -18.8pp toward R · 2008: -44.6pp · 2024: -63.5pp
- All cycles
- 2024: R+63.5 2020: R+60.2 2016: R+60.0 2012: R+54.8 2008: R+44.6
Not yet ingested
- Civics
- —
Market trends
- HPI YoY
- ▼ -216.77%
- Current HPI
- 199.8108
- Rent YoY
- ▼ -5.76%
- Metro
- Athens, TX
- State GDP YoY
- ▲ 3.95%
- F500 in state
- 110
Industry mix (Fortune 500 HQ in TX)
| Industry | F500 HQs | Revenue |
|---|---|---|
| Energy | 16 | $1,198B |
|
||
| Technology | 5 | $198B |
|
||
| Engineering / Construction | 4 | $72B |
|
||
| Energy Services | 3 | $60B |
|
||
| Utilities | 3 | $41B |
|
||
| Healthcare | 2 | $330B |
|
||
Price history
-22.5% since first listed7 events — show timeline
- 2026-06-17 Listed $110,000 NTREIS
- 2026-04-27 Listing Removed — NTREIS
- 2026-02-09 Listed $110,000 NTREIS
- 2025-04-15 Listing Removed — NTREIS
- 2025-02-20 Price Changed $126,000 NTREIS
- 2025-02-11 Price Changed $136,000 NTREIS
- 2025-01-28 Listed $142,000 NTREIS
Property tax history
+6.3%/yrLatest (2025): $3,135 · -1.1% YoY. Source: county tax records.
Cash-flow waterfall
monthlySold comps — $/sqft
last 12 mo · ≤1 miLoading sold comps…