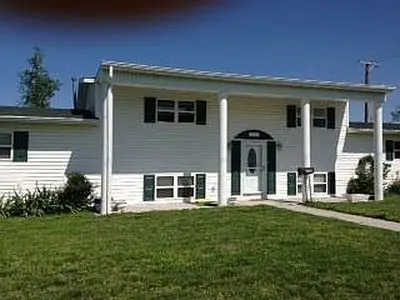
2521 Wisconsin Ave · Joplin, MO
Flood risk 1/10 · Minimal
- FEMA flood zone
- X (unshaded)
- Chance of flooding over 30 yrs
- 0.0%
- Est. flood insurance / yr
- $507 – $1,088
Fire risk 4/10 · Minor
- Est. fire insurance / yr
- $1,054 – $1,958
Heat risk 5/10 · Moderate
- Hot days now (above 107°F)
- 7 days/yr
- Hot days in 30 yrs
- 20 days/yr
Wind risk 2/10 · Minimal
- Chance of severe wind over 30 yrs
- 2.0%
Air-quality risk 2/10 · Minimal
- Unhealthy air days now
- 1 days/yr
- Unhealthy air days in 30 yrs
- 1 days/yr
Risk factors via First Street. Map © Google.
Why this score? — see what drove the D grade
The composite is a weighted blend of 9 inputs, each scored 0–100. Each bar is that input's sub-score; the figure is the points it added to the 100-point composite (weight × sub-score).
- Cash flow +13.2/30.0
- ARV discount +7.5/15.0
- Rent growth +5.0/5.0
- DSCR +4.0/10.0
- Livability +3.2/5.0
- Schools +2.9/10.0
- 1% rule +2.6/10.0
- Condition / age +2.5/5.0
- Appreciation +0.0/10.0
$244,300
🖨 Deal sheet (PDF) 📄 Offer letter ✓ Due diligence
Listing remarks
This unique Georgian Style has a charm of its own. Complete remodel from the studs up! Everything is new and Awesome!! Spacious home with 4 bedroom and a split floor plan. Something for everyone! Neighborhood Description Wonderful neighborhood with extra nice neighbors. Walking distance to Kelsey Norman Elementary and High School. Central location easy access to businesses.
Key facts
- Complete remodel
- Central location
- Georgian style
Tags
Neighborhood map
What this means for you Summary
Snapshot
- This is a 4-bed/2.0-bath other listed at $244k.
Deal economics
- At list price, monthly cash flow is $-3 ($-31/yr) — negative.
- To cash-flow at today's rent, offer at most $244k (0.2% below list).
- To meet the 1% rule (rent ≥ 1% of price), the offer needs to be $187k (23.6% below list).
- Recommended offer: $187k (23.6% below list) — sets the bar for 1% rule.
- Cap rate 6.3% vs local median 5.1% in Joplin — meaningfully above typical; check what's discounted (condition, days-on-market, listing class) to confirm the premium yield is real.
Location & tenants
- Location reads 64/100 on livability (#318 in MO) — a middle-class / working-renter tenant base. Strengths: cost of living A+, housing A+; Watch: schools D+, crime F, amenities F.
- Joplin Schools (urban): math 30% / reading 39% proficiency, ranked #231 of 324 in MO (top 71%) — families likely to look elsewhere, expect single-tenant / working-renter base with shorter leases.
- Market conditions: Rents rising fast (+15.7%/yr); 353 active listings in the ZIP; 6 comparable units currently listed for rent nearby; rentals at typical pace (median 22d on market — plan ~3-4 weeks tenant-placement turnaround); 602 units permitted in Jasper County in 2024 (0 in 5+ unit buildings).
- This rent runs 36% of the median local income ($63k/yr) — at the standard rent-burdened threshold; future hikes will face affordability resistance.
Forward outlook
- Local home prices are declining (-3.0%/yr); year-one equity from $2k of loan paydown is wiped out by about $7k of value loss. Plan a longer hold.
Negotiation context
- It's been on market 24 days — a 2% lower offer ($241k) is reasonable based on typical stale-listing flexibility.
Risks & watch-outs
- Watch-outs: built in 1958 — expect roof / HVAC / electrical / plumbing capex.
- Climate carrying-cost: extreme-heat days projected 7→20/yr by 2055 (HVAC capex compounding) — expect insurance premiums to compound above CPI over the hold.
Questions for the listing agent
- What do current leases actually rent for vs. the listed asking? Can we see a recent rent roll and the last 12 months of T-12 income?
- Built in 1958 — when were the roof, HVAC, electrical panel, plumbing, and water heater last replaced?
- Is there a deadline driving the sale (1031 exchange, divorce, estate, relocation)? That informs how much negotiation room exists.
- Schools are D-rated, which usually means shorter tenancies and higher turnover. Who's the typical renter profile here, and what's been the actual vacancy rate?
- Crime grade is F in this area — have there been break-ins, vandalism, or insurance claims at this property in the last 3 years? What carrier currently insures it and at what premium?
- The area grade is low — what's the realistic commute time and amenity access for the typical tenant pool here? Any planned neighborhood developments (good or bad) we should know about?
- What's the average days-on-market for RENTAL listings here right now (not sales)? A rising rental-DOM trend means longer vacancies and softer asking-rent achievability than the comps imply.
- What's the recent tenant-quality profile in this submarket — average credit score on applications, eviction rate, late-payment / NSF rate, and stable-employment percentage? A property-management company in the area should have these aggregated.
- How much new for-sale + rental construction is in the pipeline within 1–3 miles? Heavy new supply typically softens prices + rents 12–24 months out; constrained supply supports both.
Investment metrics
- 1% rule
- 0.76% ✗
- Cap rate
- 6.28%
- Cash-on-cash
- -0.05%
- DSCR
- 1.00
- GRM
- 10.9
CMA / ARV
No comps found within radius.
Projected returns pro-forma
-3.0% appreciation · 8.0% rent growth · sell at horizon
- IRR
- -11.6%
- Equity multiple
- 0.56×
- Total profit
- $-29,991
- Equity at exit
- $36,426
- IRR
- 3.1%
- Equity multiple
- 1.27×
- Total profit
- $18,147
- Equity at exit
- $21,123
Cash invested: $68,404 (down + closing). Projections, not guarantees.
Landlord ↔ Tenant lean methodology
- Overall (STATE)
- 81 Strongly Landlord-Friendly
- State Missouri
- 81 Strongly Landlord-Friendly · R+10
- County
- — inherits STATE
- City
- — inherits STATE
ZIP-level market 64804
- Rents YoY
- 15.7%
- Active inventory
- 353
- Price-to-rent
- 10.9×
Monthly cashflow live
- Estimated rent
- $1,866 high interval (Pro) →
- Mortgage (P&I)
- −$1,281
- Tax from tax record
- −$94 /mo · $1,127/yr
- Insurance
- −$102
- HOA
- −$0
- Vacancy / Maint / Mgmt
- −$392
- Net cashflow
- $-3
Break-even live
Sensitivity live
| Price | -10% $136 | -5% $67 | +0% $-3 | +5% $-72 | +10% $-141 |
|---|---|---|---|---|---|
| Rent | -10% $-150 | -5% $-76 | +0% $-3 | +5% $71 | +10% $145 |
| Rate | -1.0pp $120 | -0.5pp $60 | base $-3 | +0.5pp $-66 | +1.0pp $-130 |
UW: 25.0% down · 7.5% · 30yr · 1.5% tax · 5.0% vac · 8.0% maint · 8.0% mgmt
Financing live
Cash to close
- Down payment
- $61,075
- Closing costs
- $7,329
- Reserves months
- —
- Total cash needed
- —
Loan-product check · same deal, 3 products live
Conventional
25% down · 7.5% · 30yr
- Down + closing
- —
- Monthly P&I
- —
- Monthly cashflow
- —
- DSCR
- —
- Eligible?
- —
Personal DTI + credit; lowest rate.
DSCR
20% down · 8.5% · 30yr
- Down + closing
- —
- Monthly P&I
- —
- Monthly cashflow
- —
- DSCR
- —
- Eligible?
- —
No personal income docs; deal must DSCR.
Hard money
10% down · 12.0% · 12mo
- Down + closing
- —
- Monthly P&I
- —
- Monthly cashflow
- —
- DSCR
- —
- Eligible?
- —
Short-term bridge; refi at stabilization.
Rent comps 6 comps
| Address | Beds | Baths | Sqft | Rent | $/sqft | DOM | Units | Dist |
|---|---|---|---|---|---|---|---|---|
| 2517 Ohio Ave Joplin, MO | 3.0 | 2.0 | 1503 | $1,695 | $1.13 | 21d | 1 | 0.21mi |
| 2114 S Patterson Ave Joplin, MO | 3.0 | 2.0 | 1715 | $1,700 | $0.99 | 21d | 1 | 0.80mi |
| 2201 S Pearl Ave Joplin, MO | 3.0 | 2.0 | 1487 | $1,475 | $0.99 | 21d | 1 | 0.91mi |
| 2226 S Moffet Ave Joplin, MO | 4.0 | 2.0 | 1818 | $1,600 | $0.88 | 21d | 1 | 1.05mi |
| 2528 E 15th St Joplin, MO | 3.0 | 2.5 | 1800 | $2,750 | $1.53 | 21d | 1 | 1.17mi |
| 2811 E 15th St Joplin, MO | 3.0 | 1.5 | 1500 | $1,500 | $1.00 | 21d | 1 | 1.43mi |
Listing history 23 events
-
2026-06-19days on market $244,300 Active 24 DOM
-
2026-06-18days on market $244,300 Active 23 DOM
-
2026-06-17days on market $244,300 Active 22 DOM
-
2026-06-16days on market $244,300 Active 21 DOM
-
2026-06-15days on market $244,300 Active 20 DOM
-
2026-06-14days on market $244,300 Active 18 DOM
-
2026-06-13days on market $244,300 Active 17 DOM
-
2026-06-10days on market $244,300 Active 15 DOM
-
2026-06-09days on market $244,300 Active 14 DOM
-
2026-06-08days on market $244,300 Active 13 DOM
-
2026-06-07days on market $244,300 Active 12 DOM
-
2026-06-05days on market $244,300 Active 9 DOM
-
2026-06-03days on market $244,300 Active 8 DOM
-
2026-06-02days on market $244,300 Active 7 DOM
-
2026-06-01days on market $244,300 Active 6 DOM
-
2026-05-31days on market $244,300 Active 5 DOM
-
2026-05-30days on market $244,300 Active 4 DOM
-
2026-05-26$244,300 Active
-
2026-02-14price $250,000
-
2025-11-14price $262,500
-
2025-08-18price $279,500
-
2025-07-15price $284,900
-
2002-03-19soldstatus
ⓘ Source: listings_history table (triggers on properties + properties_extension) + one-shot
backfill from property_details.listing_events for pre-trigger history.
Tax reassessment forecast MO · Resets to sale price
- Current annual tax
- $1,127 · $94/mo
- Projected year-2 tax
- $2,370 · $197/mo
- Expected delta
- +$1,242/yr (+$104/mo · 110.2%)
ⓘ Screening estimate from a state-policy table — verify with the county assessor before closing.
Climate risk First Street
- Flood 1/10 Low FEMA zone X (unshaded) · 0% chance over 30 yrs
- Wildfire 4/10 Moderate
- Heat 5/10 Major 7 d/yr ≥107°F today · 20 d/yr by 30 yrs out
- Wind 2/10 Low 2% chance of damaging wind over 30 yrs
- Air quality 2/10 Low 1 unhealthy d/yr today · 1 by 30 yrs out
Nearby sold comps map
Loading sold comps map…
Walkable amenities ~0.75 mi
Loading nearby amenities…
Taxation est. · year 1
- Rental income
- $22,394
- − Mortgage interest
- −$13,685
- − Property taxes
- −$1,127
- − Insurance
- −$1,222
- − Repairs & maintenance
- −$1,792
- − Management
- −$1,792
- − Depreciation
- −$7,107
- Taxable loss
- −$4,329
- Est. tax savings @ 24.0%
- +$1,039
- After-tax cash flow
- $1,008/yr
For passive investors: Depreciation is non-cash, so a rental often shows a tax loss while cash-flowing — sheltering income. Rental losses are passive: they offset passive income freely, and up to $25,000/yr can offset ordinary (W-2) income if you actively participate and your MAGI is under $100k (phasing out to $0 by $150k); unused losses carry forward. On sale, claimed depreciation is recaptured at up to 25%, and gains may owe capital-gains tax (a 1031 exchange can defer both). Figures are a year-1 estimate at your 24.0% rate — not tax advice; consult a CPA.
Schools (NCES district)
- District
- Joplin Schools
- NCES district ID
- 2916350
- Math proficiency
- 30% ▼ -3.00%
- Reading proficiency
- 39% ▼ -3.00%
- Median HH income
- $38,648
- Composite
- 28.82/100
- National rank
- #6657
- State rank
- #231 of 324 in MO
Livability — Joplin
- Score
- 64/100
- State rank
- #318
- US rank
- #14578
Category grades
Schools grade is shown separately in the Schools card above.
Census & demographics
- Census place
- Joplin, MO
- County
- Newton County · 37,016 people
- City population
- 73,303
- Metro
- Joplin, MO
- Population (ZIP)
- 37,016
- Household income
- $62,574
- Rent vs Own
- Severe rent burden
- 1082.0
Population outlook (Jasper County) Hauer SSP2
- Today (2025)
- 120,033 people
- By 2030
- 120,091 · +0.0%
- By 2040
- 119,297 · -0.6%
- By 2050
- 117,705 · -1.9%
- By 2075
- 110,402 · -8.0%
- By 2100
- 99,719 · -16.9%
Race, ethnicity, and origin ACS 2023
- Neighborhood character
- Predominantly White (84%)
- Race & ethnicity
- White 84% Two or more races 9% Hispanic / Latino 6% Black 2% Asian 2%
- Hispanic origin (detail)
- Mexican 3%
- Common ancestry
- Slovak 3% Italian 2% Lithuanian 2%
- Foreign-born
- 3% · Canada, Vietnam
- Languages at home
- 96% English-only · Spanish 1% Other Indo-European 1% Vietnamese 1%
Political lean MEDSL · Jasper
- 2024 margin
- Solid R (+46.8) · D 25.9% · R 72.7% · Other 1.4%
- 2008→2024 swing
- -13.6pp toward R · 2008: -33.2pp · 2024: -46.8pp
- All cycles
- 2024: R+46.8 2020: R+46.2 2016: R+50.8 2012: R+41.0 2008: R+33.2
Not yet ingested
- Civics
- —
Market trends
- HPI YoY
- ▼ -204.80%
- Current HPI
- 279.4471
- Rent YoY
- ▲ 15.66%
- Metro
- Joplin, MO
- State GDP YoY
- ▲ 1.84%
- F500 in state
- 20
Industry mix (Fortune 500 HQ in MO)
| Industry | F500 HQs | Revenue |
|---|---|---|
| Healthcare | 1 | $163B |
|
||
| Insurance | 1 | $21B |
|
||
| Industrial Technology | 1 | $17B |
|
||
| Retail | 1 | $16B |
|
||
| Industrial Distribution | 1 | $10B |
|
||
| Utilities | 1 | $9B |
|
||
Price history
-14.3% since first listed6 events — show timeline
- 2026-05-26 Listed $244,300 FSBO.com
- 2026-02-14 Price Changed $250,000 OGAR
- 2025-11-14 Price Changed $262,500 OGAR
- 2025-08-18 Price Changed $279,500 OGAR
- 2025-07-15 Price Changed $284,900 OGAR
- 2002-03-19 Sold (Public Records) — Public Records
Property tax history
+3.3%/yrLatest (2025): $1,127 · +2.4% YoY. Source: county tax records.
Cash-flow waterfall
monthlySold comps — $/sqft
last 12 mo · ≤1 miLoading sold comps…