1 Lakeside 714-O · Manson, WA
Flood risk 1/10 · Minimal
- FEMA flood zone
- X
- Chance of flooding over 30 yrs
- 0.0%
- Est. flood insurance / yr
- $507 – $1,088
Fire risk 7/10 · Major
- Est. fire insurance / yr
- $604 – $1,122
Heat risk 4/10 · Minor
- Hot days now (above 95°F)
- 8 days/yr
- Hot days in 30 yrs
- 18 days/yr
Wind risk 1/10 · Minimal
- Chance of severe wind over 30 yrs
- —
Air-quality risk 10/10 · Severe
- Unhealthy air days now
- 23 days/yr
- Unhealthy air days in 30 yrs
- 25 days/yr
Risk factors via First Street. Map © Google.
Why this score? — see what drove the C- grade
The composite is a weighted blend of 9 inputs, each scored 0–100. Each bar is that input's sub-score; the figure is the points it added to the 100-point composite (weight × sub-score).
- Cash flow +15.0/30.0
- ARV discount +15.0/15.0
- 1% rule +5.0/10.0
- DSCR +5.0/10.0
- Schools +3.8/10.0
- Livability +3.1/5.0
- Rent growth +2.5/5.0
- Condition / age +2.5/5.0
- Appreciation +0.0/10.0
$2,500
🖨 Deal sheet 📄 Offer letter ✓ Due diligence
Listing remarks
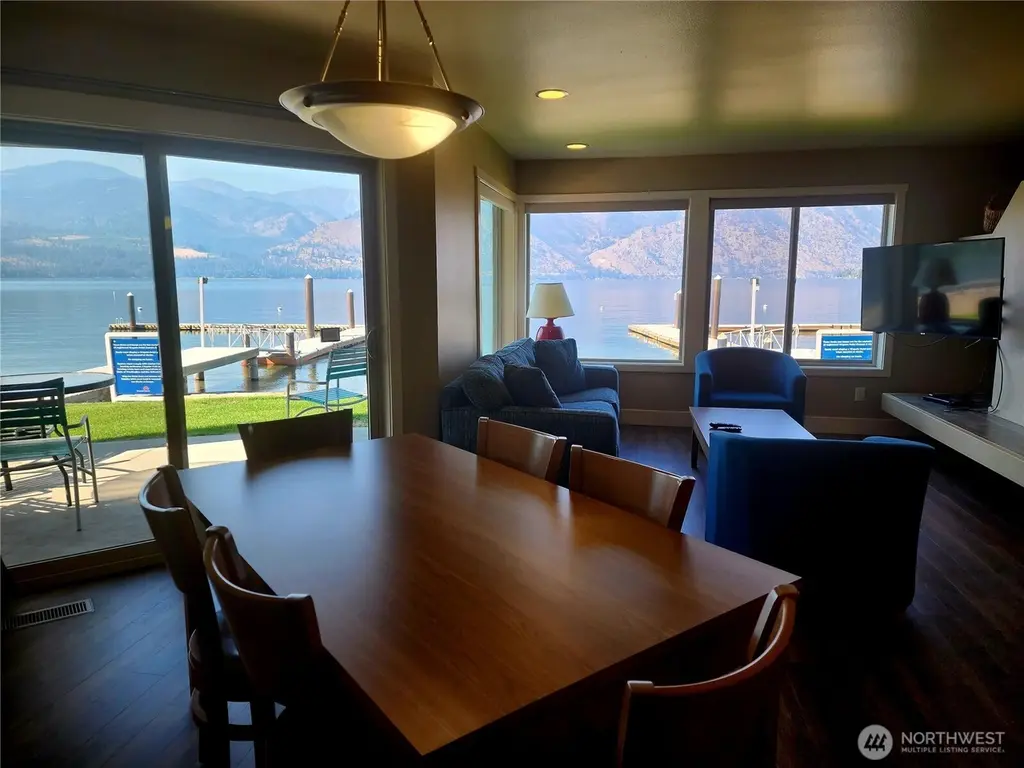
Ground Floor 2 bed 2 bath luxury suite with unobstructed lake & mountain views with outdoor pool, lawn, swimming area, waterfront & boat moorage in your front yard. No stairs access from parking lot to condo entry door. Newly remodeled in 2022. Best upcoming weeks: March 29-April 5, July 26-Aug 2 & Thanksgiving Nov 22-29 in 2026. April 25-May 2, Aug 22-29 & Christmas Dec 19-26 in 2027. 2 Holiday Weeks January 16-23, May 28-June 4 & Best Fall Week Sept 24-Oct 1 in 2028. HOA Fees $925/quarter - 3 rotating weeks every year to enjoy all seasons. Use your weeks, rent for income or trade thru RCI or Interval International & visit other places. Located in th
Key facts
- Outdoor pool
- Lake views
- Waterfront
Tags
Neighborhood map
What this means for you Summary
Snapshot
- This is a 2-bed/2.0-bath timeshare listed at $2k.
Deal economics
- At list price, monthly cash flow is $698 ($8k/yr) — positive.
- The deal already cash-flows at list — no discount required.
- Meets the 1% rule at list price ($1k rent vs $2k).
- Recommended offer: $2k (12.0% below list) — sets the bar for market timing.
- Cap rate 341.2% vs local median 2.9% in Manson — top-decile yield for the area; either an underpriced asset or a hidden risk that comps aren't pricing in. Stress-test before assuming the spread holds.
Location & tenants
- Location reads 62/100 on livability (#421 in WA) — a middle-class / working-renter tenant base. Strengths: crime A+; Watch: health & safety C-, cost of living D+, employment D.
- Manson School District (town): math 42% / reading 40% proficiency, ranked #211 of 291 in WA (top 72%) — families likely to look elsewhere, expect single-tenant / working-renter base with shorter leases; 64% free/reduced lunch — lower-income household profile, screen leases tightly.
- Market conditions: 212 active listings in the ZIP; 1 comparable units currently listed for rent nearby; 762 units permitted in Chelan County in 2024 (377 in 5+ unit buildings).
Forward outlook
- Local home prices are declining (-3.0%/yr); year-one equity from $17 of loan paydown is wiped out by about $75 of value loss. Plan a longer hold.
- Chelan County population projected at +13% by 2050 — modest demand growth; plan on rents tracking national, not racing it.
- At projected returns (-3.0% appreciation + 3.0% rent growth), your $700 cash investment doubles in ~1 year — after that, you're playing with house money.
Negotiation context
- It's been on market 231 days — a 12% lower offer ($2k) is reasonable based on typical stale-listing flexibility.
Risks & watch-outs
- Watch-outs: HOA is 24% of rent.
- Climate carrying-cost: major wildfire risk — expect insurance premiums to compound above CPI over the hold.
Questions for the listing agent
- It's been on market 231 days. Have you received any prior offers? Is the seller open to a 12% concession, seller financing, or rate buy-down credit?
- What does the HOA fee cover, when was the last increase, and are there any pending special assessments or reserve-fund shortfalls?
- Why hasn't it sold? Are there any deal-killer items the seller is aware of (foundation, flood, title, zoning, code violations)?
- Is there a deadline driving the sale (1031 exchange, divorce, estate, relocation)? That informs how much negotiation room exists.
- Schools are D-rated, which usually means shorter tenancies and higher turnover. Who's the typical renter profile here, and what's been the actual vacancy rate?
- What's the average days-on-market for RENTAL listings here right now (not sales)? A rising rental-DOM trend means longer vacancies and softer asking-rent achievability than the comps imply.
- What's the recent tenant-quality profile in this submarket — average credit score on applications, eviction rate, late-payment / NSF rate, and stable-employment percentage? A property-management company in the area should have these aggregated.
- How much new for-sale + rental construction is in the pipeline within 1–3 miles? Heavy new supply typically softens prices + rents 12–24 months out; constrained supply supports both.
Investment metrics
- 1% rule
- 51.80% ✓
- Cap rate
- 341.22%
- Cash-on-cash
- 1196.18%
- DSCR
- 54.22
- GRM
- 0.2
CMA / ARV
- ARV (median comp)
- $3,016
- List price
- $2,500
- Delta
- -17.11%
- Verdict
- UNDERPRICED
- Comps
- 20 within 1.0 mi
Show comp detail 12 sales within ~0.75 mi
| Address | Dist | Beds/Ba | Sqft | Sold | Price | $/sf | Match |
|---|---|---|---|---|---|---|---|
| 1 Lakeside 720-P | 0.01mi | 2/2.0 | 981 (0%) | 4mo | $1,000 | $1 | 96 |
| 1 Lakeside 701-B | 0.05mi | 2/2.0 | 981 (0%) | 2mo | $2,000 | $2 | 96 |
| 1 Lakeside 711-F | 0.02mi | 2/2.0 | 981 (0%) | 4mo | $4,500 | $5 | 96 |
| 1 Lakeside 720-H | 0.00mi | 2/2.0 | 981 (0%) | 6mo | $1 | — | 94 |
| 1 Lakeside 715-Q | 0.01mi | 2/2.0 | 981 (0%) | 8mo | $3,500 | $4 | 93 |
| 1 Lodge 632-C | 0.13mi | 2/2.0 | 981 (0%) | 4mo | $500 | $1 | 91 |
| 1 Beach 553-A | 0.21mi | 2/2.0 | 964 (-2%) | 4mo | $3,500 | $4 | 84 |
| 1 Beach 549-I | 0.25mi | 2/2.0 | 964 (-2%) | 2mo | $1 | — | 84 |
| 1 Beach 534-O | 0.23mi | 2/2.0 | 964 (-2%) | 4mo | $2,600 | $3 | 83 |
| 1 Beach 536-J | 0.21mi | 2/2.0 | 964 (-2%) | 8mo | $1 | — | 80 |
| 1 Beach 538-C | 0.58mi | 2/2.0 | 964 (-2%) | 1mo | $1 | — | 70 |
| 1 Beach 542-C | 0.58mi | 2/2.0 | 964 (-2%) | 5mo | $3,500 | $4 | 66 |
Match score weights: distance 35% · size 25% · config 20% · recency 20%. Top-matched comps best support the ARV.
Projected returns pro-forma
-3.0% appreciation · 3.0% rent growth · sell at horizon
- IRR
- —
- Equity multiple
- 64.21×
- Total profit
- $44,245
- Equity at exit
- $373
- IRR
- —
- Equity multiple
- 139.00×
- Total profit
- $96,602
- Equity at exit
- $216
Cash invested: $700 (down + closing). Projections, not guarantees.
Landlord ↔ Tenant lean methodology
- Overall (STATE)
- 28 Tenant-Leaning
- State Washington
- 28 Tenant-Leaning · D+8
- County
- — inherits STATE
- City
- — inherits STATE
ZIP-level market 98831
- Active inventory
- 212
- Price-to-rent
- 0.2×
Monthly cashflow live
- Estimated rent
- $1,295 medium interval (Pro) →
- Mortgage (P&I)
- −$13
- Tax est. 1.5%
- −$3 /mo · $38/yr
- Insurance
- −$1
- HOA
- −$308
- Vacancy / Maint / Mgmt
- −$272
- Net cashflow
- $698
Break-even live
UW: 25.0% down · 7.5% · 30yr · 1.5% tax · 5.0% vac · 8.0% maint · 8.0% mgmt
Financing live
Cash to close
- Down payment
- $625
- Closing costs
- $75
- Reserves months
- —
- Total cash needed
- —
Loan-product check · same deal, 3 products live
Conventional
25% down · 7.5% · 30yr
- Down + closing
- —
- Monthly P&I
- —
- Monthly cashflow
- —
- DSCR
- —
- Eligible?
- —
Personal DTI + credit; lowest rate.
DSCR
20% down · 8.5% · 30yr
- Down + closing
- —
- Monthly P&I
- —
- Monthly cashflow
- —
- DSCR
- —
- Eligible?
- —
No personal income docs; deal must DSCR.
Hard money
10% down · 12.0% · 12mo
- Down + closing
- —
- Monthly P&I
- —
- Monthly cashflow
- —
- DSCR
- —
- Eligible?
- —
Short-term bridge; refi at stabilization.
Rent comps 1 comps
| Address | Beds | Baths | Sqft | Rent | $/sqft | DOM | Units | Dist |
|---|---|---|---|---|---|---|---|---|
| 139 Chandler Rd Unit 16D Manson, WA | 1.0 | 1.0 | 800 | $1,295 | $1.62 | 43d | 1 | 1.33mi |
HOA detail
- Monthly dues
- $308 · $3,696/yr
- Likely covers
- waterpool
Listing history 18 events
-
2026-06-18days on market $2,500 Active 231 DOM
-
2026-06-17days on market $2,500 Active 230 DOM
-
2026-06-16days on market $2,500 Active 229 DOM
-
2026-06-15days on market $2,500 Active 228 DOM
-
2026-06-15days on market $2,500 Active 227 DOM
-
2026-06-13days on market $2,500 Active 226 DOM
-
2026-06-12days on market $2,500 Active 225 DOM
-
2026-06-09days on market $2,500 Active 222 DOM
-
2026-06-08days on market $2,500 Active 221 DOM
-
2026-06-08days on market $2,500 Active 220 DOM
-
2026-06-07days on market $2,500 Active 219 DOM
-
2026-06-03days on market $2,500 Active 216 DOM
-
2026-06-02days on market $2,500 Active 215 DOM
-
2026-06-01days on market $2,500 Active 214 DOM
-
2026-05-31days on market $2,500 Active 213 DOM
-
2026-02-25price $2,500
-
2025-11-16price $3,500
-
2025-10-30$4,500 Active
ⓘ Source: listings_history table (triggers on properties + properties_extension) + one-shot
backfill from property_details.listing_events for pre-trigger history.
Climate risk First Street
- Flood 1/10 Low FEMA zone X · 0% chance over 30 yrs
- Wildfire 7/10 Severe
- Heat 4/10 Moderate 8 d/yr ≥95°F today · 18 d/yr by 30 yrs out
- Wind 1/10 Low
- Air quality 10/10 Extreme 23 unhealthy d/yr today · 25 by 30 yrs out
Nearby sold comps map
Loading sold comps map…
Walkable amenities ~0.75 mi
Loading nearby amenities…
Taxation est. · year 1
- Rental income
- $15,540
- − Mortgage interest
- −$140
- − Property taxes
- −$38
- − Insurance
- −$12
- − Repairs & maintenance
- −$1,243
- − Management
- −$1,243
- − HOA
- −$3,696
- − Depreciation
- −$73
- Taxable income
- $9,095
- Est. tax owed @ 24.0%
- −$2,183
- After-tax cash flow
- $6,191/yr
For passive investors: Depreciation is non-cash, so a rental often shows a tax loss while cash-flowing — sheltering income. Rental losses are passive: they offset passive income freely, and up to $25,000/yr can offset ordinary (W-2) income if you actively participate and your MAGI is under $100k (phasing out to $0 by $150k); unused losses carry forward. On sale, claimed depreciation is recaptured at up to 25%, and gains may owe capital-gains tax (a 1031 exchange can defer both). Figures are a year-1 estimate at your 24.0% rate — not tax advice; consult a CPA.
Schools (NCES district)
- District
- Manson School District
- NCES district ID
- 5304740
- Math proficiency
- 42% ▲ 10.00%
- Reading proficiency
- 40% ▲ 4.00%
- Median HH income
- $48,123
- Composite
- 37.53/100
- National rank
- #8876
- State rank
- #211 of 291 in WA
Livability — Manson
- Score
- 62/100
- State rank
- #421
- US rank
- #16741
Category grades
Schools grade is shown separately in the Schools card above.
Census & demographics
- Census place
- Manson, WA
- Population (ZIP)
- 4,020
Population outlook (Chelan County) Hauer SSP2
- Today (2025)
- 81,630 people
- By 2030
- 84,312 · +3.3%
- By 2040
- 88,619 · +8.6%
- By 2050
- 91,915 · +12.6%
- By 2075
- 99,409 · +21.8%
- By 2100
- 100,032 · +22.5%
Race, ethnicity, and origin ACS 2023
- Neighborhood character
- Majority White (57%)
- Race & ethnicity
- White 57% Hispanic / Latino 40% Two or more races 10%
- Hispanic origin (detail)
- Mexican 37%
- Common ancestry
- Lithuanian 5% Portuguese 5% Iranian 2%
- Foreign-born
- 25% · Canada
- Languages at home
- 61% English-only · Spanish 38% German/W. Germanic 1%
Political lean MEDSL · Chelan
- 2024 margin
- Lean R (+9.5) · D 43.9% · R 53.4% · Other 2.7%
- 2008→2024 swing
- +2.5pp toward D · 2008: -12.0pp · 2024: -9.5pp
- All cycles
- 2024: R+9.5 2020: R+7.8 2016: R+15.7 2012: R+16.9 2008: R+12.0
Not yet ingested
- Civics
- —
Market trends
- HPI YoY
- ▼ -325.60%
- Current HPI
- 249.0392
- Rent YoY
- —
- Metro
- —
- State GDP YoY
- ▲ 4.65%
- F500 in state
- 22
Industry mix (Fortune 500 HQ in WA)
| Industry | F500 HQs | Revenue |
|---|---|---|
| Retail | 2 | $269B |
|
||
| Technology / Retail | 1 | $638B |
|
||
| Technology | 1 | $245B |
|
||
| Telecommunications | 1 | $38B |
|
||
| Food / Beverage | 1 | $36B |
|
||
| Automotive / Trucks | 1 | $34B |
|
||
Price history
-44.4% since first listed3 events — show timeline
- 2026-02-25 Price Changed $2,500 NWMLS as Distributed by MLS Grid
- 2025-11-16 Price Changed $3,500 NWMLS as Distributed by MLS Grid
- 2025-10-30 Listed $4,500 NWMLS as Distributed by MLS Grid
Cash-flow waterfall
monthlySold comps — $/sqft
last 12 mo · ≤1 miLoading sold comps…