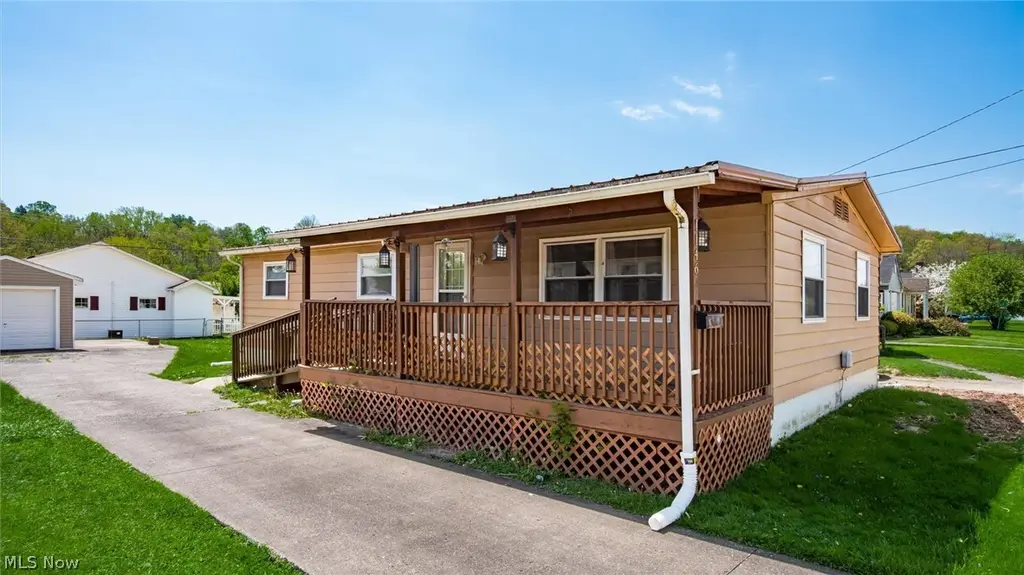
1146 Seborn Ave · Zanesville, OH
Flood risk 3/10 · Minor
- FEMA flood zone
- X (unshaded)
- Chance of flooding over 30 yrs
- 0.2%
- Est. flood insurance / yr
- $507 – $1,088
Fire risk 3/10 · Minor
- Est. fire insurance / yr
- $713 – $1,323
Heat risk 4/10 · Minor
- Hot days now (above 98°F)
- 7 days/yr
- Hot days in 30 yrs
- 18 days/yr
Wind risk 2/10 · Minimal
- Chance of severe wind over 30 yrs
- 0.0%
Air-quality risk 2/10 · Minimal
- Unhealthy air days now
- 0 days/yr
- Unhealthy air days in 30 yrs
- 1 days/yr
Risk factors via First Street. Map © Google.
Why this score? — see what drove the C- grade
The composite is a weighted blend of 9 inputs, each scored 0–100. Each bar is that input's sub-score; the figure is the points it added to the 100-point composite (weight × sub-score).
- Cash flow +17.1/30.0
- ARV discount +14.1/15.0
- DSCR +5.3/10.0
- Livability +3.7/5.0
- 1% rule +3.6/10.0
- Rent growth +3.6/5.0
- Schools +2.7/10.0
- Condition / age +2.5/5.0
- Appreciation +0.0/10.0
$130,000
🖨 Deal sheet 📄 Offer letter ✓ Due diligence
Listing remarks
Affordable, move-in ready, and easy to maintain—this one checks the boxes. This ranch-style real estate ready mobile home offers convenient one-level living with 2 bedrooms, 1 full bath, and a comfortable layout that makes the most of its space. Natural light fills the home, creating a warm and inviting feel. Outside, you’ll find a flat level lot and a detached garage plus a storage shed, giving you the extra space buyers are always looking for. Whether you’re a first-time buyer, downsizing, or adding to your investment portfolio, this is a smart opportunity in a convenient Zanesville location. This modular was built prior to 1976
Key facts
- Flat level lot
- Storage shed
- Convenient location
Tags
Property features AI
Exterior
- Parking: Detached garage (1 car)
- Utilities: Public water; Public sewer
- Home design: Single-story home
- Construction: Built according to public records; Aluminum siding construction; Metal roofing
- Exterior features: Metal roof; Aluminum siding; 0.14-acre lot
Interior
- Bedrooms: 2 main-level bedrooms
- Bathrooms: 1 full bathroom (main level)
- Heating & cooling: Electric forced-air heating; Central air conditioning
- Interior features: 5 total rooms
Neighborhood map
What this means for you Summary
Snapshot
- This is a 2-bed/1.0-bath single-family listed at $130k.
Deal economics
- At list price, monthly cash flow is $90 ($1k/yr) — positive.
- The deal already cash-flows at list — no discount required.
- To meet the 1% rule (rent ≥ 1% of price), the offer needs to be $112k (14.2% below list).
- Recommended offer: $112k (14.2% below list) — sets the bar for 1% rule.
- Cap rate 7.1% vs local median 3.3% in Zanesville — top-decile yield for the area; either an underpriced asset or a hidden risk that comps aren't pricing in. Stress-test before assuming the spread holds.
Location & tenants
- Location reads 74/100 on livability (#290 in OH, #4,764 nationally) — a middle-class / working-renter tenant base. Strengths: cost of living A+, housing A+, health & safety A+; Watch: schools C-, crime D, commute F.
- Zanesville City (town): math 29% / reading 38% proficiency, ranked #570 of 656 in OH (top 87%) — families likely to look elsewhere, expect single-tenant / working-renter base with shorter leases; 73% free/reduced lunch — lower-income household profile, screen leases tightly.
- Market conditions: Rents rising fast (+4.2%/yr); 299 active listings in the ZIP; 1 comparable units currently listed for rent nearby; 140 units permitted in Muskingum County in 2024 (100 in 5+ unit buildings).
Forward outlook
- Local home prices are declining (-3.0%/yr); year-one equity from $899 of loan paydown is wiped out by about $4k of value loss. Plan a longer hold.
- Muskingum County population projected at -10% by 2050 — secular population decline; favor cash flow + early exit over multi-decade hold.
Negotiation context
- It's been on market 54 days — a 3% lower offer ($126k) is reasonable based on typical stale-listing flexibility.
- 2 sale attempts with the ask held roughly flat each time — persistent listings suggest the price (not the market) is what's stuck; bring a comps-based counter.
- Current owner paid $29k; list at $130k implies a 350% gain — meaningful room to come down on a strong offer.
Questions for the listing agent
- It's been on market 54 days. Have you received any prior offers? Is the seller open to a 14% concession, seller financing, or rate buy-down credit?
- Built in 1972 — when were the roof, HVAC, electrical panel, plumbing, and water heater last replaced?
- Is there a deadline driving the sale (1031 exchange, divorce, estate, relocation)? That informs how much negotiation room exists.
- Crime grade is D in this area — have there been break-ins, vandalism, or insurance claims at this property in the last 3 years? What carrier currently insures it and at what premium?
- What's the average days-on-market for RENTAL listings here right now (not sales)? A rising rental-DOM trend means longer vacancies and softer asking-rent achievability than the comps imply.
- What's the recent tenant-quality profile in this submarket — average credit score on applications, eviction rate, late-payment / NSF rate, and stable-employment percentage? A property-management company in the area should have these aggregated.
- How much new for-sale + rental construction is in the pipeline within 1–3 miles? Heavy new supply typically softens prices + rents 12–24 months out; constrained supply supports both.
Investment metrics
- 1% rule
- 0.86% ✗
- Cap rate
- 7.13%
- Cash-on-cash
- 2.98%
- DSCR
- 1.13
- GRM
- 9.7
CMA / ARV
- ARV (median comp)
- $152,181
- List price
- $130,000
- Delta
- -14.58%
- Verdict
- UNDERPRICED
- Comps
- 20 within 1.0 mi
Show comp detail 12 sales within ~0.75 mi
| Address | Dist | Beds/Ba | Sqft | Sold | Price | $/sf | Match |
|---|---|---|---|---|---|---|---|
| 1140 Lindbergh Ave | 0.06mi | 2/1.0 | 992 (-8%) | 3mo | $68,000 | $69 | 82 |
| 817 Superior St | 0.56mi | 3/1.0 (+1) | 1,077 (-0%) | 2mo | $174,900 | $162 | 67 |
| 403 Seborn Ave | 0.56mi | 2/1.0 | 1,132 (+5%) | 1mo | $174,000 | $154 | 66 |
| 630 Alfred St | 0.54mi | 2/2.0 | 1,133 (+5%) | 1mo | $199,000 | $176 | 62 |
| 816 Eppley Ave | 0.26mi | 2/1.0 | 956 (-12%) | 10mo | $149,150 | $156 | 60 |
| 1049 Benjamin Ave | 0.38mi | 3/1.0 (+1) | 1,164 (+8%) | 7mo | $141,400 | $121 | 59 |
| 771 Luck Ave | 0.54mi | 3/1.0 (+1) | 1,024 (-5%) | 8mo | $40,700 | $40 | 55 |
| 1126 Melick Ave | 0.50mi | 2/1.0 | 925 (-14%) | 3mo | $156,300 | $169 | 50 |
| 724 Luck Ave | 0.62mi | 3/1.0 (+1) | 960 (-11%) | 5mo | $73,500 | $77 | 44 |
| 752 Larzelere Ave | 0.57mi | 3/1.5 (+1) | 1,240 (+15%) | 1mo | $181,000 | $146 | 41 |
| 1215 Lake Dr | 0.67mi | 2/1.5 | 1,235 (+14%) | 8mo | $149,900 | $121 | 36 |
| 607 Larzelere Ave | 0.71mi | 3/— (+1) | 1,232 (+14%) | 10mo | $202,700 | $165 | 30 |
Match score weights: distance 35% · size 25% · config 20% · recency 20%. Top-matched comps best support the ARV.
Projected returns pro-forma
-3.0% appreciation · 4.23% rent growth · sell at horizon
- IRR
- -10.4%
- Equity multiple
- 0.62×
- Total profit
- $-13,954
- Equity at exit
- $19,383
- IRR
- 0.4%
- Equity multiple
- 1.03×
- Total profit
- $952
- Equity at exit
- $11,240
Cash invested: $36,400 (down + closing). Projections, not guarantees.
Landlord ↔ Tenant lean methodology
- Overall (STATE)
- 73 Landlord-Friendly
- State Ohio
- 73 Landlord-Friendly · R+6
- County
- — inherits STATE
- City
- — inherits STATE
ZIP-level market 43701
- Home prices YoY
- -23.2%
- Rents YoY
- 4.2%
- Active inventory
- 299
- Price-to-rent
- 9.7×
Monthly cashflow live
- Estimated rent
- $1,116 medium interval (Pro) →
- Mortgage (P&I)
- −$682
- Tax from tax record
- −$55 /mo · $660/yr
- Insurance
- −$54
- HOA
- −$0
- Vacancy / Maint / Mgmt
- −$234
- Net cashflow
- $90
Break-even live
UW: 25.0% down · 7.5% · 30yr · 1.5% tax · 5.0% vac · 8.0% maint · 8.0% mgmt
Financing live
Cash to close
- Down payment
- $32,500
- Closing costs
- $3,900
- Reserves months
- —
- Total cash needed
- —
Loan-product check · same deal, 3 products live
Conventional
25% down · 7.5% · 30yr
- Down + closing
- —
- Monthly P&I
- —
- Monthly cashflow
- —
- DSCR
- —
- Eligible?
- —
Personal DTI + credit; lowest rate.
DSCR
20% down · 8.5% · 30yr
- Down + closing
- —
- Monthly P&I
- —
- Monthly cashflow
- —
- DSCR
- —
- Eligible?
- —
No personal income docs; deal must DSCR.
Hard money
10% down · 12.0% · 12mo
- Down + closing
- —
- Monthly P&I
- —
- Monthly cashflow
- —
- DSCR
- —
- Eligible?
- —
Short-term bridge; refi at stabilization.
Rent comps 1 comps
| Address | Beds | Baths | Sqft | Rent | $/sqft | DOM | Units | Dist |
|---|---|---|---|---|---|---|---|---|
| 804 Westbourne Ave Zanesville, OH | 2.0 | 1.0 | 840 | $1,372 | $1.63 | 43d | 1 | 0.54mi |
Listing history 16 events
-
2026-06-17status $130,000 Pending 54 DOM
-
2026-06-16days on market $130,000 Contingent 54 DOM
-
2026-06-15days on market $130,000 Contingent 53 DOM
-
2026-06-14days on market $130,000 Contingent 51 DOM
-
2026-06-12statusdays on market $130,000 Contingent 50 DOM
-
2026-06-09days on market $130,000 Active 47 DOM
-
2026-06-08days on market $130,000 Active 46 DOM
-
2026-06-07days on market $130,000 Active 45 DOM
-
2026-06-05days on market $130,000 Active 42 DOM
-
2026-06-02days on market $130,000 Active 40 DOM
-
2026-06-01days on market $130,000 Active 39 DOM
-
2026-05-31days on market $130,000 Active 38 DOM
-
2026-05-30days on market $130,000 Active 37 DOM
-
2026-05-12historical Contingent 594-char remark
-
2026-04-22$130,000 Active 594-char remark
-
1991-07-29soldstatus $28,900
ⓘ Source: listings_history table (triggers on properties + properties_extension) + one-shot
backfill from property_details.listing_events for pre-trigger history.
Tax reassessment forecast OH · Partial reset (capped growth)
- Current annual tax
- $660 · $55/mo
- Projected year-2 tax
- $1,344 · $112/mo
- Expected delta
- +$684/yr (+$57/mo · 103.7%)
ⓘ Screening estimate from a state-policy table — verify with the county assessor before closing.
Climate risk First Street
- Flood 3/10 Moderate FEMA zone X (unshaded) · 20% chance over 30 yrs
- Wildfire 3/10 Moderate
- Heat 4/10 Moderate 7 d/yr ≥98°F today · 18 d/yr by 30 yrs out
- Wind 2/10 Low 0% chance of damaging wind over 30 yrs
- Air quality 2/10 Low 0 unhealthy d/yr today · 1 by 30 yrs out
Nearby sold comps map
Loading sold comps map…
Walkable amenities ~0.75 mi
Loading nearby amenities…
Taxation est. · year 1
- Rental income
- $13,388
- − Mortgage interest
- −$7,282
- − Property taxes
- −$660
- − Insurance
- −$650
- − Repairs & maintenance
- −$1,071
- − Management
- −$1,071
- − Depreciation
- −$3,782
- Taxable loss
- −$1,128
- Est. tax savings @ 24.0%
- +$271
- After-tax cash flow
- $1,357/yr
For passive investors: Depreciation is non-cash, so a rental often shows a tax loss while cash-flowing — sheltering income. Rental losses are passive: they offset passive income freely, and up to $25,000/yr can offset ordinary (W-2) income if you actively participate and your MAGI is under $100k (phasing out to $0 by $150k); unused losses carry forward. On sale, claimed depreciation is recaptured at up to 25%, and gains may owe capital-gains tax (a 1031 exchange can defer both). Figures are a year-1 estimate at your 24.0% rate — not tax advice; consult a CPA.
Schools (NCES district)
- District
- Zanesville City
- NCES district ID
- 3904517
- Math proficiency
- 29% ▼ -19.00%
- Reading proficiency
- 38% ▼ -11.00%
- Median HH income
- $29,695
- Composite
- 27.13/100
- National rank
- #7035
- State rank
- #570 of 656 in OH
Livability — Zanesville
- Score
- 74/100
- State rank
- #290
- US rank
- #4764
Category grades
Schools grade is shown separately in the Schools card above.
Census & demographics
- Census place
- Zanesville, OH
- County
- Muskingum County · 56,402 people
- City population
- 56,402
- Metro
- Zanesville, OH
- Population (ZIP)
- 56,402
- Household income
- $57,565
- Rent vs Own
- Severe rent burden
- 1619.0
Population outlook (Muskingum County) Hauer SSP2
- Today (2025)
- 85,625 people
- By 2030
- 84,592 · -1.2%
- By 2040
- 81,288 · -5.1%
- By 2050
- 76,751 · -10.4%
- By 2075
- 64,143 · -25.1%
- By 2100
- 47,598 · -44.4%
Race, ethnicity, and origin ACS 2023
- Neighborhood character
- Predominantly White (88%)
- Race & ethnicity
- White 88% Two or more races 6% Black 4% Hispanic / Latino 2%
- Common ancestry
- Slovak 2% Iranian 1% Italian 1%
- Foreign-born
- 1% · Canada
- Languages at home
- 98% English-only · Spanish 1%
Political lean MEDSL · Muskingum
- 2024 margin
- Solid R (+43.9) · D 27.6% · R 71.6%
- 2008→2024 swing
- -36.7pp toward R · 2008: -7.2pp · 2024: -43.9pp
- All cycles
- 2024: R+43.9 2020: R+39.3 2016: R+35.0 2012: R+7.0 2008: R+7.2
Not yet ingested
- Civics
- —
Market trends
- HPI YoY
- ▼ -90.41%
- Current HPI
- 298.9994
- Rent YoY
- ▲ 4.23%
- Metro
- Zanesville, OH
- State GDP YoY
- ▲ 1.98%
- F500 in state
- 48
Industry mix (Fortune 500 HQ in OH)
| Industry | F500 HQs | Revenue |
|---|---|---|
| Insurance | 3 | $145B |
|
||
| Industrial Machinery | 3 | $49B |
|
||
| Financial Services | 3 | $24B |
|
||
| Consumer Goods | 2 | $93B |
|
||
| Aerospace / Defense | 2 | $47B |
|
||
| Utilities | 2 | $33B |
|
||
Price history
+349.8% since first listed6 events — show timeline
- 2026-06-16 Pending — MLSNOW
- 2026-06-11 Contingent — MLSNOW
- 2026-05-21 Relisted — MLSNOW
- 2026-05-12 Contingent — MLSNOW
- 2026-04-22 Listed $130,000 MLSNOW
- 1991-07-29 Sold (Public Records) $28,900 Public Records
Property tax history
+1.9%/yrLatest (2025): $660 · -5.2% YoY. Source: county tax records.
Cash-flow waterfall
monthlySold comps — $/sqft
last 12 mo · ≤1 miLoading sold comps…