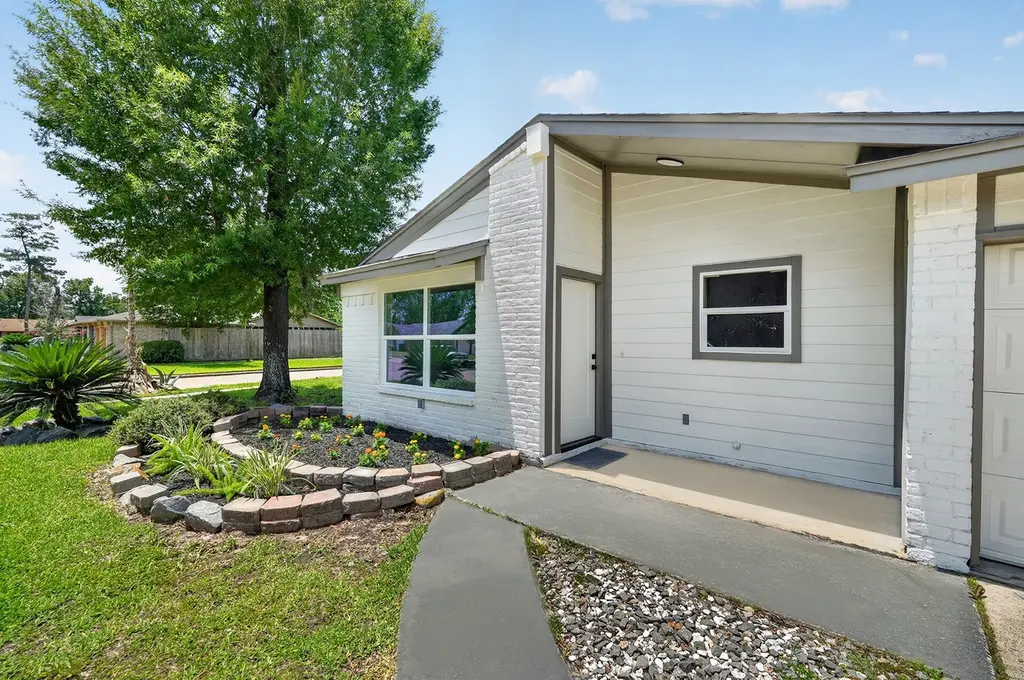
9623 Seeker St · Houston, TX
Flood risk 1/10 · Minimal
- FEMA flood zone
- X (unshaded)
- Chance of flooding over 30 yrs
- 0.0%
- Est. flood insurance / yr
- $507 – $1,088
Fire risk 4/10 · Minor
- Est. fire insurance / yr
- $1,222 – $2,270
Heat risk 9/10 · Severe
- Hot days now (above 111°F)
- 7 days/yr
- Hot days in 30 yrs
- 25 days/yr
Wind risk 9/10 · Severe
- Chance of severe wind over 30 yrs
- 99.0%
Air-quality risk 3/10 · Minor
- Unhealthy air days now
- 3 days/yr
- Unhealthy air days in 30 yrs
- 3 days/yr
Risk factors via First Street. Map © Google.
Why this score? — see what drove the D grade
The composite is a weighted blend of 9 inputs, each scored 0–100. Each bar is that input's sub-score; the figure is the points it added to the 100-point composite (weight × sub-score).
- Cash flow +10.2/30.0
- ARV discount +8.3/15.0
- Appreciation +6.2/10.0
- 1% rule +3.8/10.0
- Livability +3.7/5.0
- DSCR +2.9/10.0
- Schools +2.7/10.0
- Rent growth +2.5/5.0
- Condition / age +2.5/5.0
$179,999
🖨 Deal sheet 📄 Offer letter ✓ Due diligence
Listing remarks
Completely remodeled and move-in ready 3 bedrooms and 2 full bathrooms sitting on an oversized lot with a covered patio! 9623 Seeker Street offers a beautifully refreshed interior and exterior with modern updates throughout and a clean, turnkey feel from the moment you arrive. This 1-story home features updated flooring throughout with no carpet, a fully redesigned kitchen with new finishes and appliances, and completely renovated bathrooms with a modern touch. Extensive upgrades include a newly replaced roof completed in May 2026, along with all major systems recently installed in the last few weeks, for peace of mind. Fresh exterior paint and thoughtful renovations throughout the home cre
Key facts
- Refreshed interior
- Covered patio
- Refreshed exterior
Tags
Property features AI
Exterior
- Parking: Attached 2-car garage; Driveway; Garage with door opener
- Utilities: Public water; Public sewer
- Home design: Residential property; Slab foundation; Shingle and wood roof; Brick and vinyl siding exterior; Built in 1975
- Construction: Brick and vinyl siding construction; Shingle and wood roof; Slab foundation; Year built: 1975
- Exterior features: Covered patio; Patio; Deck; Private yard; Fenced backyard; Subdivision lot
Interior
- Kitchen: Dishwasher; Electric cooktop; Electric range; Oven; Disposal; ENERGY STAR qualified appliances
- Bedrooms: Primary bedroom on first floor (approx. 14 x 11); Bedroom on first floor (approx. 9 x 9); Bedroom on first floor (approx. 9 x 9)
- Flooring: Plank flooring; Tile flooring; Vinyl flooring
- Bathrooms: 2 full bathrooms
- Heating & cooling: Central heating (electric); Central air (electric)
- Interior features: Kitchen island; Kitchen/family room combo; Self-closing cabinet doors; Tub/shower; Ceiling fans; Living/dining room
- Laundry & utility: Washer hookup; Electric dryer hookup
Neighborhood map
What this means for you Summary
Snapshot
- This is a 3-bed/2.0-bath single-family listed at $180k.
Deal economics
- At list price, monthly cash flow is $-103 ($-1k/yr) — negative.
- To cash-flow at today's rent, offer at most $162k (10.2% below list).
- To meet the 1% rule (rent ≥ 1% of price), the offer needs to be $158k (12.1% below list).
- Recommended offer: $158k (12.1% below list) — sets the bar for 1% rule.
- Cap rate 5.6% vs local median 3.2% in Houston — top-decile yield for the area; either an underpriced asset or a hidden risk that comps aren't pricing in. Stress-test before assuming the spread holds.
Location & tenants
- Location reads 74/100 on livability (#184 in TX, #4,771 nationally) — a middle-class / working-renter tenant base. Strengths: amenities A+, cost of living A+, housing A+; Watch: crime F.
- Houston ISD (urban): math 27% / reading 35% proficiency, ranked #593 of 826 in TX (top 72%) — families likely to look elsewhere, expect single-tenant / working-renter base with shorter leases; 71% free/reduced lunch — lower-income household profile, screen leases tightly.
- Zoned schools: Forest Brook Middle (math 12% / reading 14%, grade F, #1,609 of 1,662 statewide, top 97%, 613 students, 98% FRL); North Forest H S (math 13% / reading 18%, grade F, #1,505 of 1,632 statewide, top 92%, 974 students, 97% FRL) — zoned schools average 98% FRL vs 71% district-wide (27 pts higher); higher-poverty schools than district average — tighter screening recommended.
- Zoned-school proficiency averages 14% at this address vs 31% district-wide (-17 pts) — the specific schools serving this property underperform the Houston ISD average; the district grade overstates school quality for this exact location.
- Market conditions: 129 active listings in the ZIP; 40 comparable units currently listed for rent nearby; rentals lingering (median 44d on market — plan ~5-8 weeks vacancy on turnover, expect pricing pressure); 50% of comp listings sitting > 30 days — soft ceiling on asking rent; lower-income renter base — watch delinquency; 29,883 units permitted in Harris County in 2024 (8,621 in 5+ unit buildings).
Forward outlook
- In year one you build about $6k of equity ($1k loan paydown + $4k appreciation (2.5% local appreciation)).
- Harris County population projected at +47% by 2050 — long-run rental-demand tailwind backs the buy-and-hold thesis.
- By year 6, paydown + projected appreciation supports a ~$31k cash-out refi (75% LTV) — recoverable capital for the next deal without selling this one.
Negotiation context
- Only 9 days on market — expect competitive offers; lowballing is unlikely to land.
- 2 sale attempts with the ask held roughly flat each time — persistent listings suggest the price (not the market) is what's stuck; bring a comps-based counter.
- Current owner paid $20k; list at $180k implies a 778% gain — meaningful room to come down on a strong offer.
Risks & watch-outs
- Climate carrying-cost: severe wind risk, 99% chance of damaging wind over 30y; extreme-heat days projected 7→25/yr by 2055 (HVAC capex compounding) — expect insurance premiums to compound above CPI over the hold.
Questions for the listing agent
- What do current leases actually rent for vs. the listed asking? Can we see a recent rent roll and the last 12 months of T-12 income?
- Built in 1975 — when were the roof, HVAC, electrical panel, plumbing, and water heater last replaced?
- Is there a deadline driving the sale (1031 exchange, divorce, estate, relocation)? That informs how much negotiation room exists.
- Schools are D-rated, which usually means shorter tenancies and higher turnover. Who's the typical renter profile here, and what's been the actual vacancy rate?
- Crime grade is F in this area — have there been break-ins, vandalism, or insurance claims at this property in the last 3 years? What carrier currently insures it and at what premium?
- The area grade is low — what's the realistic commute time and amenity access for the typical tenant pool here? Any planned neighborhood developments (good or bad) we should know about?
- What's the average days-on-market for RENTAL listings here right now (not sales)? A rising rental-DOM trend means longer vacancies and softer asking-rent achievability than the comps imply.
- What's the recent tenant-quality profile in this submarket — average credit score on applications, eviction rate, late-payment / NSF rate, and stable-employment percentage? A property-management company in the area should have these aggregated.
- How much new for-sale + rental construction is in the pipeline within 1–3 miles? Heavy new supply typically softens prices + rents 12–24 months out; constrained supply supports both.
Investment metrics
- 1% rule
- 0.88% ✗
- Cap rate
- 5.60%
- Cash-on-cash
- -2.46%
- DSCR
- 0.89
- GRM
- 9.5
CMA / ARV
- ARV (on-the-fly)
- $183,294
- Comps found
- 12
Show comp detail 12 sales within ~0.75 mi
| Address | Dist | Beds/Ba | Sqft | Sold | Price | $/sf | Match |
|---|---|---|---|---|---|---|---|
| 8414 Rinn St | 0.16mi | 4/1.5 (+1) | 1,253 (+5%) | 2mo | $190,000 | $152 | 76 |
| 8410 Rinn St | 0.15mi | 3/2.0 | 1,354 (+13%) | 4mo | $169,900 | $125 | 68 |
| 8117 Snowden St | 0.56mi | 3/2.0 | 1,201 (+0%) | 11mo | $200,000 | $167 | 65 |
| 8814 Shady Vista Ln Ln | 0.75mi | 3/2.0 | 1,206 (+1%) | 6mo | $188,800 | $157 | 59 |
| 7919 Cabot St | 0.51mi | 3/2.0 | 1,304 (+9%) | 11mo | $199,900 | $153 | 53 |
| 8702 Rinn St | 0.54mi | 3/2.0 | 1,358 (+13%) | 1mo | $189,900 | $140 | 52 |
| 8054 Parker Rd | 0.64mi | 3/2.0 | 1,140 (-5%) | 14mo | $180,000 | $158 | 50 |
| 8044 Parker Rd | 0.66mi | 3/2.0 | 1,140 (-5%) | 13mo | $175,000 | $154 | 50 |
| 8907 Shady Vista Ln | 0.71mi | 4/2.0 (+1) | 1,150 (-4%) | 10mo | $190,000 | $165 | 47 |
| 8162 Count St | 0.41mi | 3/1.0 | 1,352 (+13%) | 13mo | $140,000 | $104 | 45 |
| 8546 Talton St | 0.72mi | 3/1.0 | 1,120 (-6%) | 10mo | $129,900 | $116 | 43 |
| 8121 Homewood Ln | 0.75mi | 3/1.0 | 1,120 (-6%) | 15mo | $155,000 | $138 | 38 |
Match score weights: distance 35% · size 25% · config 20% · recency 20%. Top-matched comps best support the ARV.
Projected returns pro-forma
2.5% appreciation · 3.0% rent growth · sell at horizon
- IRR
- 3.7%
- Equity multiple
- 1.21×
- Total profit
- $10,438
- Equity at exit
- $75,887
- IRR
- 7.2%
- Equity multiple
- 2.04×
- Total profit
- $52,572
- Equity at exit
- $113,167
Cash invested: $50,400 (down + closing). Projections, not guarantees.
Landlord ↔ Tenant lean methodology
- Overall (STATE)
- 87 Strongly Landlord-Friendly
- State Texas
- 87 Strongly Landlord-Friendly · R+5
- County
- — inherits STATE
- City
- — inherits STATE
ZIP-level market 77078
- Home prices YoY
- 0.8%
- Active inventory
- 129
- Price-to-rent
- 9.5×
Monthly cashflow live
- Estimated rent
- $1,582 high interval (Pro) →
- Mortgage (P&I)
- −$944
- Tax from tax record
- −$334 /mo · $4,012/yr
- Insurance
- −$75
- HOA
- −$0
- Vacancy / Maint / Mgmt
- −$332
- Net cashflow
- $-103
Break-even live
UW: 25.0% down · 7.5% · 30yr · 1.5% tax · 5.0% vac · 8.0% maint · 8.0% mgmt
Financing live
Cash to close
- Down payment
- $45,000
- Closing costs
- $5,400
- Reserves months
- —
- Total cash needed
- —
Loan-product check · same deal, 3 products live
Conventional
25% down · 7.5% · 30yr
- Down + closing
- —
- Monthly P&I
- —
- Monthly cashflow
- —
- DSCR
- —
- Eligible?
- —
Personal DTI + credit; lowest rate.
DSCR
20% down · 8.5% · 30yr
- Down + closing
- —
- Monthly P&I
- —
- Monthly cashflow
- —
- DSCR
- —
- Eligible?
- —
No personal income docs; deal must DSCR.
Hard money
10% down · 12.0% · 12mo
- Down + closing
- —
- Monthly P&I
- —
- Monthly cashflow
- —
- DSCR
- —
- Eligible?
- —
Short-term bridge; refi at stabilization.
Rent comps 40 comps
| Address | Beds | Baths | Sqft | Rent | $/sqft | DOM | Units | Dist |
|---|---|---|---|---|---|---|---|---|
| 8346 Tidwell Rd Unit B Houston, TX | 3.0 | 2.0 | 980 | $1,000 | $1.02 | 43d | 1 | 0.17mi |
| 8350 Tidwell Rd Unit A Houston, TX | 3.0 | 2.0 | 980 | $975 | $0.99 | 43d | 1 | 0.18mi |
| 8126 Sterlingshire St Unit B Houston, TX | 3.0 | 2.0 | 1150 | $1,350 | $1.17 | 24d | 1 | 0.31mi |
| 8122 Sterlingshire St Unit A Houston, TX | 3.0 | 2.0 | 1160 | $1,525 | $1.31 | 15d | 1 | 0.32mi |
| 8122 Sterlingshire St Unit B Houston, TX | 3.0 | 2.0 | 1160 | $1,450 | $1.25 | 15d | 1 | 0.32mi |
| 8302 Caddo Rd Houston, TX | 2.0 | 1.0 | 896 | $1,450 | $1.62 | 43d | 1 | 0.34mi |
| 8213 Bigwood St Unit A Houston, TX | 3.0 | 2.5 | 1150 | $1,595 | $1.39 | 43d | 1 | 0.35mi |
| 9222 Hillis St Houston, TX | 3.0 | 2.0 | 1498 | $1,850 | $1.23 | 43d | 1 | 0.46mi |
| 8600 Sterlingshire St Houston, TX | 1.0–2.0 | 1.0 | 732 | $1,050 | $1.43 | 24d | 2 | 0.60mi |
| 9550 N Wayside Dr Houston, TX | 1.0–3.0 | 1.0–2.0 | 896 | $1,399 | $1.56 | 1d | 5 | 0.63mi |
| 8711 Southwark St Unit A Houston, TX | 3.0 | 2.0 | 1150 | $1,750 | $1.52 | 43d | 1 | 0.65mi |
| 9700 Mesa Dr Houston, TX | 1.0–3.0 | 1.0–2.0 | 784 | $989 | $1.26 | 1d | 8 | 0.69mi |
| 8006 Lynette St Houston, TX | 3.0 | 1.0 | 1400 | $1,475 | $1.05 | 24d | 1 | 0.74mi |
| 8623 Homewood Ln Unit B Houston, TX | 3.0 | 2.5 | 1150 | $1,850 | $1.61 | 18d | 1 | 0.79mi |
| 8623 Homewood Unit A Houston, TX | 3.0 | 2.5 | 1150 | $1,850 | $1.61 | 43d | 1 | 0.79mi |
| 8625 Homewood Ln Unit B Houston, TX | 3.0 | 3.0 | 1500 | $1,850 | $1.23 | 43d | 1 | 0.79mi |
| 8627 Homewood Ln Unit B Houston, TX | 3.0 | 2.5 | 1500 | $1,850 | $1.23 | 43d | 1 | 0.80mi |
| 8631 Homewood Ln Unit B Houston, TX | 3.0 | 3.0 | 1500 | $1,850 | $1.23 | 43d | 1 | 0.81mi |
| 8631 Homewood Ln Unit A Houston, TX | 3.0 | 2.5 | 1500 | $1,850 | $1.23 | 43d | 1 | 0.81mi |
| 9110 Tidwell Rd Houston, TX | 2.0 | 2.0 | 987 | $1,200 | $1.22 | 24d | 1 | 0.88mi |
| 9110 Tidwell Rd Houston, TX | 2.0 | 2.0 | 987 | $1,185 | $1.20 | 43d | 1 | 0.88mi |
| 8213 Linda Vista Rd Houston, TX | 3.0 | 2.0 | 1298 | $1,625 | $1.25 | 24d | 1 | 0.91mi |
| 8602 Wilkins Oaks Dr Houston, TX | 3.0 | 2.0 | 1307 | $1,775 | $1.36 | 43d | 1 | 0.94mi |
| 8216 Richland Dr Unit B Houston, TX | 3.0 | 2.0 | 1150 | $1,750 | $1.52 | 43d | 1 | 1.00mi |
| 7914 Laura Koppe Rd Houston, TX | 3.0 | 2.0 | 1400 | $1,850 | $1.32 | 43d | 1 | 1.02mi |
| 8309 Carolwood Dr Houston, TX | 3.0 | 1.0 | 938 | $1,350 | $1.44 | 43d | 1 | 1.08mi |
| 8113 Denton St Houston, TX | 3.0 | 2.0 | 1150 | $1,750 | $1.52 | 43d | 1 | 1.11mi |
| 10314 Woodwick St Unit 1283919P Houston, TX | 3.0 | 2.5 | 1496 | $3,782 | $2.53 | 7d | 1 | 1.12mi |
| 10708 Lavender Cotton Ln Houston, TX | 3.0 | 2.0 | 1406 | $2,150 | $1.53 | 43d | 1 | 1.20mi |
| 8003 Alpine Bearberry Dr Houston, TX | 3.0–4.0 | 2.0–2.5 | 1696 | $2,000 | $1.18 | 7d | 1 | 1.23mi |
| 9133 Woodlyn Rd Houston, TX | 3.0 | 1.0 | 1073 | $1,495 | $1.39 | 3d | 1 | 1.29mi |
| 7726 Spinet St Houston, TX | 4.0 | 2.0 | 1456 | $2,375 | $1.63 | 7d | 1 | 1.31mi |
| 7804 Crestview Dr Unit A Houston, TX | 3.0 | 2.0 | 1150 | $1,550 | $1.35 | 22d | 1 | 1.33mi |
| 7600 E Houston Rd Houston, TX | 1.0–3.0 | 1.0–2.0 | 1017 | $1,436 | $1.41 | 13d | 8 | 1.37mi |
| 7601 Springdale St Houston, TX | 3.0 | 2.0 | 1224 | $1,200 | $0.98 | 15d | 1 | 1.39mi |
| 9399 Tidwell Rd Houston, TX | 2.0 | 2.0 | 862 | $982 | $1.14 | 43d | 1 | 1.41mi |
| 9399 Tidwell Rd Houston, TX | 2.0 | 2.0 | 862 | $982 | $1.14 | 20d | 1 | 1.41mi |
| 9399 Tidwell Rd Houston, TX | 3.0 | 2.0 | 1031 | $1,107 | $1.07 | 24d | 1 | 1.41mi |
| 9393 Tidwell Rd Houston, TX | 3.0–4.0 | 2.0 | 1135 | $1,244 | $1.10 | 1d | 10 | 1.43mi |
| 7252 Parker Rd Houston, TX | 3.0 | 1.0 | 916 | $1,650 | $1.80 | 43d | 1 | 1.49mi |
Listing history 6 events
-
2026-06-07days on market $179,999 Pending 9 DOM
-
2026-06-04days on market $179,999 Pending 6 DOM
-
2026-06-03days on market $179,999 Pending 5 DOM
-
2026-06-02statusdays on market $179,999 Pending 4 DOM
-
2026-06-01days on market $179,999 Active 3 DOM
-
2026-05-31days on market $179,999 Active 2 DOM
ⓘ Source: listings_history table (triggers on properties + properties_extension) + one-shot
backfill from property_details.listing_events for pre-trigger history.
Tax reassessment forecast TX · Resets to sale price
- Current annual tax
- $4,012 · $334/mo
- Projected year-2 tax
- $4,012 · $334/mo
- Expected delta
- $0/yr ($0/mo · 0.0%)
ⓘ Screening estimate from a state-policy table — verify with the county assessor before closing.
Climate risk First Street
- Flood 1/10 Low FEMA zone X (unshaded) · 0% chance over 30 yrs
- Wildfire 4/10 Moderate
- Heat 9/10 Extreme 7 d/yr ≥111°F today · 25 d/yr by 30 yrs out
- Wind 9/10 Extreme 99% chance of damaging wind over 30 yrs
- Air quality 3/10 Moderate 3 unhealthy d/yr today · 3 by 30 yrs out
Nearby sold comps map
Loading sold comps map…
Walkable amenities ~0.75 mi
Loading nearby amenities…
Taxation est. · year 1
- Rental income
- $18,984
- − Mortgage interest
- −$10,083
- − Property taxes
- −$4,012
- − Insurance
- −$900
- − Repairs & maintenance
- −$1,519
- − Management
- −$1,519
- − Depreciation
- −$5,236
- Taxable loss
- −$4,285
- Est. tax savings @ 24.0%
- +$1,028
- After-tax cash flow
- $-214/yr
For passive investors: Depreciation is non-cash, so a rental often shows a tax loss while cash-flowing — sheltering income. Rental losses are passive: they offset passive income freely, and up to $25,000/yr can offset ordinary (W-2) income if you actively participate and your MAGI is under $100k (phasing out to $0 by $150k); unused losses carry forward. On sale, claimed depreciation is recaptured at up to 25%, and gains may owe capital-gains tax (a 1031 exchange can defer both). Figures are a year-1 estimate at your 24.0% rate — not tax advice; consult a CPA.
Schools (NCES district)
- District
- Houston ISD
- NCES district ID
- 4823640
- Math proficiency
- 27% ▼ -18.00%
- Reading proficiency
- 35% ▼ -6.00%
- Median HH income
- $46,054
- Composite
- 26.63/100
- National rank
- #7173
- State rank
- #593 of 826 in TX
Livability — Houston
- Score
- 74/100
- State rank
- #184
- US rank
- #4771
Category grades
Schools grade is shown separately in the Schools card above.
Census & demographics
- Census place
- Houston, TX
- County
- Harris County · 4,702,590 people
- City population
- 3,226,434
- Metro
- Houston-The Woodlands-Sugar Land, TX
- Population (ZIP)
- 14,247
- Household income
- $39,093
- Rent vs Own
- Severe rent burden
- 780.0
Population outlook (Harris County) Hauer SSP2
- Today (2025)
- 5,571,493 people
- By 2030
- 6,089,821 · +9.3%
- By 2040
- 7,142,806 · +28.2%
- By 2050
- 8,185,864 · +46.9%
- By 2075
- 10,574,329 · +89.8%
- By 2100
- 12,109,958 · +117.4%
Race, ethnicity, and origin ACS 2023
- Race & ethnicity
- Black 49% Hispanic / Latino 46% Two or more races 15% White 5%
- Hispanic origin (detail)
- Mexican 36% Cuban 1%
- Common ancestry
- Italian 1% Hispanic 1%
- Foreign-born
- 24% · Canada
- Languages at home
- 59% English-only · Spanish 41%
Political lean MEDSL · Harris
- 2024 margin
- Lean D (+5.5) · D 52.0% · R 46.4% · Other 1.6%
- 2008→2024 swing
- +3.9pp toward D · 2008: 1.6pp · 2024: 5.5pp
- All cycles
- 2024: D+5.5 2020: D+13.3 2016: D+12.4 2012: D+0.1 2008: D+1.6
Not yet ingested
- Civics
- —
Market trends
- HPI YoY
- ▲ 2.50%
- Current HPI
- 307.0842
- Rent YoY
- —
- Metro
- Houston-The Woodlands-Sugar Land, TX
- State GDP YoY
- ▲ 3.95%
- F500 in state
- 110
Industry mix (Fortune 500 HQ in TX)
| Industry | F500 HQs | Revenue |
|---|---|---|
| Energy | 16 | $1,198B |
|
||
| Technology | 5 | $198B |
|
||
| Engineering / Construction | 4 | $72B |
|
||
| Energy Services | 3 | $60B |
|
||
| Utilities | 3 | $41B |
|
||
| Healthcare | 2 | $330B |
|
||
Price history
+778.0% since first listed9 events — show timeline
- 2026-05-29 Listed $179,999 HARMLS
- 2026-01-01 Listing Removed — HARMLS
- 2025-12-01 Price Changed $125,000 HARMLS
- 2025-11-22 Listed $140,000 HARMLS
- 2025-10-23 Sold (Public Records) — Public Records
- 2025-10-10 Sold (Public Records) — Public Records
- 2025-09-08 Sold (Public Records) — Public Records
- 2025-09-08 Sold (Public Records) — Public Records
- 1998-06-01 Sold (Public Records) $20,500 Public Records
Property tax history
+5.7%/yrLatest (2025): $4,012 · +2.5% YoY. Source: county tax records.
Cash-flow waterfall
monthlySold comps — $/sqft
last 12 mo · ≤1 miLoading sold comps…