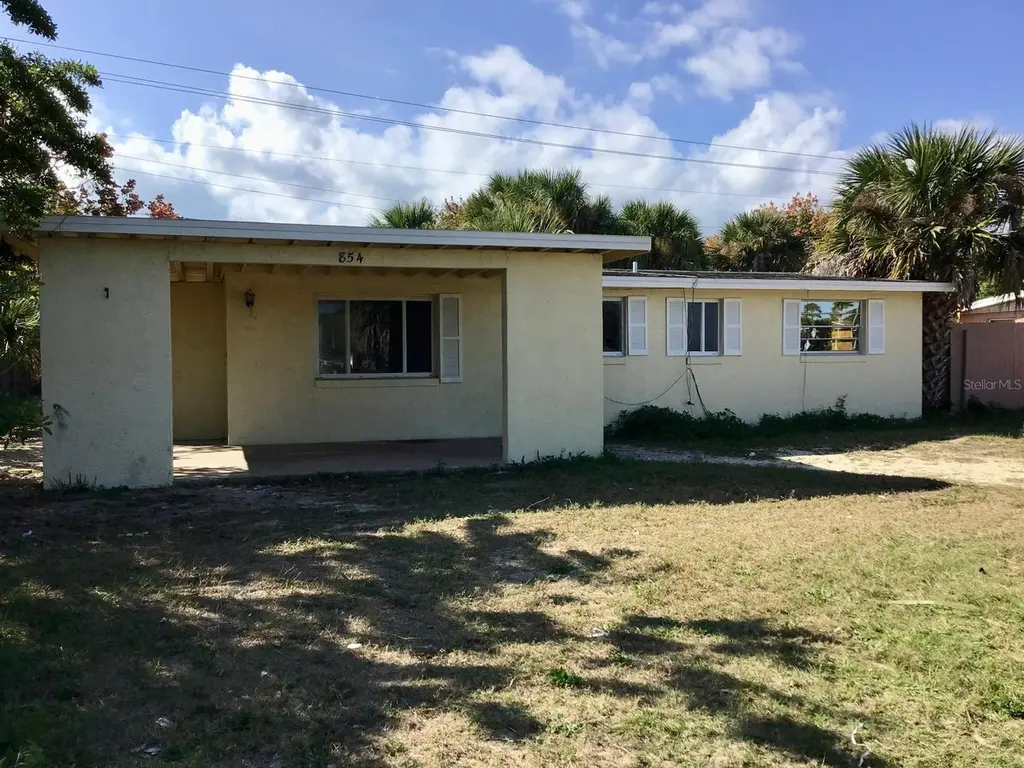
854 Derbyshire Rd · Daytona Beach, FL
Flood risk 1/10 · Minimal
- FEMA flood zone
- X (unshaded)
- Chance of flooding over 30 yrs
- 0.0%
- Est. flood insurance / yr
- $507 – $1,088
Fire risk 4/10 · Minor
- Est. fire insurance / yr
- $947 – $1,759
Heat risk 10/10 · Severe
- Hot days now (above 106°F)
- 7 days/yr
- Hot days in 30 yrs
- 21 days/yr
Wind risk 10/10 · Severe
- Chance of severe wind over 30 yrs
- 99.0%
Air-quality risk 2/10 · Minimal
- Unhealthy air days now
- 1 days/yr
- Unhealthy air days in 30 yrs
- 1 days/yr
Risk factors via First Street. Map © Google.
Why this score? — see what drove the C- grade
The composite is a weighted blend of 9 inputs, each scored 0–100. Each bar is that input's sub-score; the figure is the points it added to the 100-point composite (weight × sub-score).
- Cash flow +19.7/30.0
- ARV discount +7.5/15.0
- DSCR +6.2/10.0
- 1% rule +5.0/10.0
- Livability +4.2/5.0
- Schools +3.9/10.0
- Rent growth +2.8/5.0
- Condition / age +2.5/5.0
- Appreciation +0.0/10.0
$162,000
🖨 Deal sheet 📄 Offer letter ✓ Due diligence
Listing remarks MLS
* * * INVESTOR OPPORTUNITY * * * DAYTONA BEACH * * * 3 BEDROOMS 1.5 BATHROOM * * * 920SF PROPERTY with CASH FLOW POTENTIAL. NEW FAUCETRY, VYNIL WATERPROOF FLOORING, NEWER CABINETRY & COUNTERTOP. CLOSE TO BEACHES, SHOPPING, INTERNATIONAL SPEEDWAY & MINUTES FROM I-95 * * * SELLER MOTIVATED * * *
Key facts
- Cash flow potential
- New faucetry
- Newer cabinetry
Tags
Neighborhood map
What this means for you Summary
Snapshot
- This is a 3-bed/1.5-bath single-family listed at $162k.
Deal economics
- At list price, monthly cash flow is $188 ($2k/yr) — positive.
- The deal already cash-flows at list — no discount required.
- To meet the 1% rule (rent ≥ 1% of price), the offer needs to be $161k (0.3% below list).
- Recommended offer: $143k (12.0% below list) — sets the bar for market timing.
Location & tenants
- Location reads 83/100 on livability (#46 in FL, #867 nationally) — a professional / high-income tenant draw. Strengths: amenities A+, commute A+, cost of living A+; Watch: schools D+, employment D-.
- Volusia (suburban): math 44% / reading 49% proficiency, ranked #47 of 73 in FL (top 64%) — families likely to look elsewhere, expect single-tenant / working-renter base with shorter leases.
- Market conditions: Rents rising (+1.0%/yr); 332 active listings in the ZIP; 25 comparable units currently listed for rent nearby; rentals at typical pace (median 15d on market — plan ~3-4 weeks tenant-placement turnaround); 3,402 units permitted in Volusia County in 2024 (681 in 5+ unit buildings).
- This rent runs 34% of the median local income ($56k/yr) — at the standard rent-burdened threshold; future hikes will face affordability resistance.
Forward outlook
- Local home prices are declining (-3.0%/yr); year-one equity from $1k of loan paydown is wiped out by about $5k of value loss. Plan a longer hold.
- Volusia County population projected at +19% by 2050 — long-run rental-demand tailwind backs the buy-and-hold thesis.
Negotiation context
- It's been on market 185 days — a 12% lower offer ($143k) is reasonable based on typical stale-listing flexibility.
- 7 sale attempts since 10y ago; this cycle's ask has dropped $17k (9%) from the opening price — seller is motivated, your offer sets the floor, not the list.
- Current owner paid $60k; list at $162k implies a 170% gain — meaningful room to come down on a strong offer.
Risks & watch-outs
- Climate carrying-cost: severe wind risk, 99% chance of damaging wind over 30y; extreme-heat days projected 7→21/yr by 2055 (HVAC capex compounding) — expect insurance premiums to compound above CPI over the hold.
Questions for the listing agent
- It's been on market 185 days. Have you received any prior offers? Is the seller open to a 12% concession, seller financing, or rate buy-down credit?
- Built in 1961 — when were the roof, HVAC, electrical panel, plumbing, and water heater last replaced?
- Why hasn't it sold? Are there any deal-killer items the seller is aware of (foundation, flood, title, zoning, code violations)?
- Is there a deadline driving the sale (1031 exchange, divorce, estate, relocation)? That informs how much negotiation room exists.
- Schools are D-rated, which usually means shorter tenancies and higher turnover. Who's the typical renter profile here, and what's been the actual vacancy rate?
- What's the average days-on-market for RENTAL listings here right now (not sales)? A rising rental-DOM trend means longer vacancies and softer asking-rent achievability than the comps imply.
- What's the recent tenant-quality profile in this submarket — average credit score on applications, eviction rate, late-payment / NSF rate, and stable-employment percentage? A property-management company in the area should have these aggregated.
- How much new for-sale + rental construction is in the pipeline within 1–3 miles? Heavy new supply typically softens prices + rents 12–24 months out; constrained supply supports both.
Investment metrics
- 1% rule
- 1.00% ✗
- Cap rate
- 7.69%
- Cash-on-cash
- 4.98%
- DSCR
- 1.22
- GRM
- 8.4
CMA / ARV
No comps found within radius.
Projected returns pro-forma
-3.0% appreciation · 1.01% rent growth · sell at horizon
- IRR
- -10.8%
- Equity multiple
- 0.62×
- Total profit
- $-17,419
- Equity at exit
- $24,155
- IRR
- -4.5%
- Equity multiple
- 0.73×
- Total profit
- $-12,201
- Equity at exit
- $14,007
Cash invested: $45,360 (down + closing). Projections, not guarantees.
Landlord ↔ Tenant lean methodology
- Overall (STATE)
- 87 Strongly Landlord-Friendly
- State Florida
- 87 Strongly Landlord-Friendly · R+3
- County
- — inherits STATE
- City
- — inherits STATE
ZIP-level market 32117
- Home prices YoY
- -8.2%
- Rents YoY
- 1.0%
- Active inventory
- 332
- Price-to-rent
- 8.4×
Monthly cashflow live
- Estimated rent
- $1,615 high interval (Pro) →
- Mortgage (P&I)
- −$850
- Tax from tax record
- −$170 /mo · $2,044/yr
- Insurance
- −$68
- HOA
- −$0
- Vacancy / Maint / Mgmt
- −$339
- Net cashflow
- $188
Break-even live
UW: 25.0% down · 7.5% · 30yr · 1.5% tax · 5.0% vac · 8.0% maint · 8.0% mgmt
Financing live
Cash to close
- Down payment
- $40,500
- Closing costs
- $4,860
- Reserves months
- —
- Total cash needed
- —
Loan-product check · same deal, 3 products live
Conventional
25% down · 7.5% · 30yr
- Down + closing
- —
- Monthly P&I
- —
- Monthly cashflow
- —
- DSCR
- —
- Eligible?
- —
Personal DTI + credit; lowest rate.
DSCR
20% down · 8.5% · 30yr
- Down + closing
- —
- Monthly P&I
- —
- Monthly cashflow
- —
- DSCR
- —
- Eligible?
- —
No personal income docs; deal must DSCR.
Hard money
10% down · 12.0% · 12mo
- Down + closing
- —
- Monthly P&I
- —
- Monthly cashflow
- —
- DSCR
- —
- Eligible?
- —
Short-term bridge; refi at stabilization.
Rent comps 25 comps
| Address | Beds | Baths | Sqft | Rent | $/sqft | DOM | Units | Dist |
|---|---|---|---|---|---|---|---|---|
| 922 Lewis Dr Daytona Beach, FL | 3.0 | 1.0 | 1034 | $1,750 | $1.69 | 23d | 1 | 0.13mi |
| 875 Derbyshire Rd Daytona Beach, FL | 3.0 | 1.0–2.0 | 835 | $1,299 | $1.56 | 11d | 11 | 0.21mi |
| 736 White St Daytona Beach, FL | 3.0 | 2.0 | 1092 | $1,799 | $1.65 | 23d | 1 | 0.49mi |
| 1216 Kennedy Rd Unit 10 Daytona Beach, FL | 2.0 | 1.0 | 900 | $975 | $1.08 | 23d | 1 | 0.53mi |
| 1216 Kennedy Rd Unit 4 Daytona Beach, FL | 2.0 | 1.0 | 900 | $975 | $1.08 | 14d | 1 | 0.53mi |
| 1217 Kennedy Rd Unit 56 Daytona Beach, FL | 2.0 | 1.0 | 800 | $1,000 | $1.25 | 23d | 1 | 0.55mi |
| 1225 Kennedy Rd Daytona Beach, FL | 2.0 | 1.0 | 800 | $825 | $1.03 | 11d | 1 | 0.56mi |
| 1229 Kennedy Rd Daytona Beach, FL | 2.0 | 1.0 | 800 | $950 | $1.19 | 14d | 1 | 0.58mi |
| 736 Kentucky St Unit 3 Daytona Beach, FL | 2.0 | 1.0 | 850 | $1,300 | $1.53 | 14d | 1 | 0.86mi |
| 625 Holmes Ave Daytona Beach, FL | 2.0 | 1.0 | 768 | $995 | $1.30 | 21d | 1 | 0.94mi |
| 100 Windflower LN Daytona Beach, FL | 1.0–3.0 | 1.0–2.0 | 1021 | $2,516 | $2.46 | 11d | 63 | 1.04mi |
| 101 Claysburg LN Holly Hill, FL | 1.0–3.0 | 1.0–2.0 | 1163 | $2,800 | $2.41 | 14d | 25 | 1.04mi |
| 550 Ruth St Daytona Beach, FL | 3.0 | 2.0 | 1114 | $1,995 | $1.79 | 11d | 1 | 1.13mi |
| 660 8th St Daytona Beach, FL | 2.0 | 1.0 | 900 | $1,375 | $1.53 | 23d | 1 | 1.19mi |
| 512 Fulton St Daytona Beach, FL | 2.0 | 1.0 | 963 | $1,600 | $1.66 | 23d | 1 | 1.21mi |
| 601 Vera St Unit 601 Daytona Beach, FL | 2.0 | 1.0 | 1113 | $1,700 | $1.53 | 23d | 1 | 1.22mi |
| 840 Center Ave Apt 75 Holly Hill, FL | 2.0 | 1.0 | 900 | $1,250 | $1.39 | 23d | 1 | 1.25mi |
| 430 Dorothy Ave Daytona Beach, FL | 3.0 | 1.0 | 1103 | $1,700 | $1.54 | 14d | 1 | 1.29mi |
| 1600 Lpga Blvd Daytona Beach, FL | 1.0–3.0 | 1.0–2.0 | 1045 | $2,622 | $2.51 | 11d | 21 | 1.33mi |
| 464 Brentwood Dr Daytona Beach, FL | 1.0–2.0 | 1.0 | 850 | $1,365 | $1.61 | 11d | 8 | 1.36mi |
| 1851 Lpga Blvd Daytona Beach, FL | 1.0–3.0 | 1.0–3.0 | 966 | $2,516 | $2.60 | 11d | 49 | 1.36mi |
| 417 Jefferson St #1 Daytona Beach, FL | 2.0 | 1.0 | 700 | $1,890 | $2.70 | 23d | 1 | 1.41mi |
| 900 LPGA Blvd Daytona Beach, FL | 1.0–2.0 | 1.0–2.0 | 885 | $1,495 | $1.69 | 14d | 14 | 1.43mi |
| 119 Thomasson Ave Daytona Beach, FL | 2.0 | 1.0 | 851 | $1,199 | $1.41 | 11d | 2 | 1.49mi |
| 1381 N Clyde Morris Blvd Daytona Beach, FL | 1.0–3.0 | 1.0–2.0 | 919 | $1,964 | $2.14 | 11d | 10 | 1.50mi |
Listing history 27 events
-
2026-05-31days on market $162,000 Active 185 DOM
-
2026-02-04price $162,000 341-char remark
Show marketing remark (341 chars)
* * * INVESTOR OPPORTUNITY * * * DAYTONA BEACH * * * 3 BEDROOMS 1.5 BATHROOM * * * 920SF PROPERTY with CASH FLOW POTENTIAL. NEW FAUCETRY, VYNIL WATERPROOF FLOORING, NEWER CABINETRY & COUNTERTOP. CLOSE TO BEACHES, SHOPPING, INTERNATIONAL SPEEDWAY & MINUTES FROM I-95 * * * SELLER MOTIVATED * * *
-
2025-11-26$179,000 Active 341-char remark
Show marketing remark (341 chars)
* * * INVESTOR OPPORTUNITY * * * DAYTONA BEACH * * * 3 BEDROOMS 1.5 BATHROOM * * * 920SF PROPERTY with CASH FLOW POTENTIAL. NEW FAUCETRY, VYNIL WATERPROOF FLOORING, NEWER CABINETRY & COUNTERTOP. CLOSE TO BEACHES, SHOPPING, INTERNATIONAL SPEEDWAY & MINUTES FROM I-95 * * * SELLER MOTIVATED * * *
-
2025-05-31historical
-
2025-01-07price $210,000
-
2024-11-12status Active
-
2024-10-31historical
-
2024-09-05price $220,000
-
2024-08-06price $239,900
-
2024-05-21price $249,900
-
2024-05-08price $269,900
-
2024-04-01$285,000 Active
-
2018-09-30historical
-
2018-08-28price $95,000
-
2018-05-09status Active
-
2018-04-30historical
-
2018-04-25price $87,500
-
2018-04-09price $90,500
-
2018-02-16$92,500 Active
-
2017-10-06soldstatus $59,900
-
2016-12-07historical
-
2016-11-02historical Contingent
-
2016-11-02status Pending
-
2016-11-02historical
-
2016-09-28$75,000 Active
-
2016-09-22$75,000 Active
-
1969-02-01soldstatus $12,400
ⓘ Source: listings_history table (triggers on properties + properties_extension) + one-shot
backfill from property_details.listing_events for pre-trigger history.
Tax reassessment forecast FL · Resets to sale price
- Current annual tax
- $2,044 · $170/mo
- Projected year-2 tax
- $2,044 · $170/mo
- Expected delta
- $0/yr ($0/mo · 0.0%)
ⓘ Screening estimate from a state-policy table — verify with the county assessor before closing.
Climate risk First Street
- Flood 1/10 Low FEMA zone X (unshaded) · 0% chance over 30 yrs
- Wildfire 4/10 Moderate
- Heat 10/10 Extreme 7 d/yr ≥106°F today · 21 d/yr by 30 yrs out
- Wind 10/10 Extreme 99% chance of damaging wind over 30 yrs
- Air quality 2/10 Low 1 unhealthy d/yr today · 1 by 30 yrs out
Nearby sold comps map
Loading sold comps map…
Walkable amenities ~0.75 mi
Loading nearby amenities…
Taxation est. · year 1
- Rental income
- $19,378
- − Mortgage interest
- −$9,075
- − Property taxes
- −$2,044
- − Insurance
- −$810
- − Repairs & maintenance
- −$1,550
- − Management
- −$1,550
- − Depreciation
- −$4,713
- Taxable loss
- −$363
- Est. tax savings @ 24.0%
- +$87
- After-tax cash flow
- $2,348/yr
For passive investors: Depreciation is non-cash, so a rental often shows a tax loss while cash-flowing — sheltering income. Rental losses are passive: they offset passive income freely, and up to $25,000/yr can offset ordinary (W-2) income if you actively participate and your MAGI is under $100k (phasing out to $0 by $150k); unused losses carry forward. On sale, claimed depreciation is recaptured at up to 25%, and gains may owe capital-gains tax (a 1031 exchange can defer both). Figures are a year-1 estimate at your 24.0% rate — not tax advice; consult a CPA.
Schools (NCES district)
- District
- Volusia
- NCES district ID
- 1201920
- Math proficiency
- 44% ▼ -9.00%
- Reading proficiency
- 49% ▼ -3.00%
- Median HH income
- $42,946
- Composite
- 39.2/100
- National rank
- #4019
- State rank
- #47 of 73 in FL
Livability — Daytona Beach
- Score
- 83/100
- State rank
- #46
- US rank
- #867
Category grades
Schools grade is shown separately in the Schools card above.
Census & demographics
- Census place
- Daytona Beach, FL
- County
- Volusia County · 556,871 people
- City population
- 67,539
- Metro
- Deltona-Daytona Beach-Ormond Beach, FL
- Population (ZIP)
- 30,955
- Household income
- $56,419
- Rent vs Own
- Severe rent burden
- 1781.0
Population outlook (Volusia County) Hauer SSP2
- Today (2025)
- 572,749 people
- By 2030
- 598,695 · +4.5%
- By 2040
- 644,880 · +12.6%
- By 2050
- 681,451 · +19.0%
- By 2075
- 759,957 · +32.7%
- By 2100
- 778,902 · +36.0%
Race, ethnicity, and origin ACS 2023
- Neighborhood character
- Diverse neighborhood (Simpson 0.63)
- Race & ethnicity
- White 53% Black 27% Hispanic / Latino 10% Two or more races 9% Asian 3%
- Hispanic origin (detail)
- Mexican 2% Puerto Rican 3%
- Common ancestry
- Romanian 2% Lithuanian 2% Slovak 1%
- Foreign-born
- 8% · Canada, Vietnam, Jamaica
- Languages at home
- 86% English-only · Spanish 8% Vietnamese 1% Other Indo-European 1%
Political lean MEDSL · Volusia
- 2024 margin
- Strong R (+21.8) · D 38.7% · R 60.5%
- 2008→2024 swing
- -27.4pp toward R · 2008: 5.7pp · 2024: -21.8pp
- All cycles
- 2024: R+21.8 2020: R+14.1 2016: R+13.1 2012: R+1.2 2008: D+5.7
Not yet ingested
- Civics
- —
Market trends
- HPI YoY
- ▼ -96.62%
- Current HPI
- 1084.54
- Rent YoY
- ▲ 1.01%
- Metro
- Deltona-Daytona Beach-Ormond Beach, FL
- State GDP YoY
- ▲ 3.28%
- F500 in state
- 36
Industry mix (Fortune 500 HQ in FL)
| Industry | F500 HQs | Revenue |
|---|---|---|
| Industrial Technology | 2 | $29B |
|
||
| Insurance | 2 | $17B |
|
||
| Retail | 1 | $60B |
|
||
| Technology Distribution | 1 | $58B |
|
||
| Homebuilding | 1 | $35B |
|
||
| Technology Manufacturing | 1 | $35B |
|
||
Price history
+1206.5% since first listed26 events — show timeline
- 2026-02-04 Price Changed $162,000 Stellar MLS as Distributed by MLS Grid
- 2025-11-26 Listed $179,000 Stellar MLS as Distributed by MLS Grid
- 2025-05-31 Listing Removed — Stellar MLS as Distributed by MLS Grid
- 2025-01-07 Price Changed $210,000 Stellar MLS as Distributed by MLS Grid
- 2024-11-12 Relisted — Stellar MLS as Distributed by MLS Grid
- 2024-10-31 Listing Removed — Stellar MLS as Distributed by MLS Grid
- 2024-09-05 Price Changed $220,000 Stellar MLS as Distributed by MLS Grid
- 2024-08-06 Price Changed $239,900 Stellar MLS as Distributed by MLS Grid
- 2024-05-21 Price Changed $249,900 Stellar MLS as Distributed by MLS Grid
- 2024-05-08 Price Changed $269,900 Stellar MLS as Distributed by MLS Grid
- 2024-04-01 Listed $285,000 Stellar MLS as Distributed by MLS Grid
- 2018-09-30 Listing Removed — Stellar MLS as Distributed by MLS Grid
- 2018-08-28 Price Changed $95,000 Stellar MLS as Distributed by MLS Grid
- 2018-05-09 Relisted — Stellar MLS as Distributed by MLS Grid
- 2018-04-30 Listing Removed — Stellar MLS as Distributed by MLS Grid
- 2018-04-25 Price Changed $87,500 Stellar MLS as Distributed by MLS Grid
- 2018-04-09 Price Changed $90,500 Stellar MLS as Distributed by MLS Grid
- 2018-02-16 Listed $92,500 Stellar MLS as Distributed by MLS Grid
- 2017-10-06 Sold (Public Records) $59,900 Public Records
- 2016-12-07 Listing Removed — Daytona MLS
- 2016-11-02 Contingent — Daytona MLS
- 2016-11-02 Pending — Stellar MLS as Distributed by MLS Grid
- 2016-11-02 Listing Removed — Stellar MLS as Distributed by MLS Grid
- 2016-09-28 Listed $75,000 Daytona MLS
- 2016-09-22 Listed $75,000 Stellar MLS as Distributed by MLS Grid
- 1969-02-01 Sold (Public Records) $12,400 Public Records
Property tax history
+9.3%/yrLatest (2025): $2,044 · -1.8% YoY. Source: county tax records.
Cash-flow waterfall
monthlySold comps — $/sqft
last 12 mo · ≤1 miLoading sold comps…