20398 Birch Dr · Montgomery, TX
Flood risk 1/10 · Minimal
- FEMA flood zone
- X (unshaded)
- Chance of flooding over 30 yrs
- 0.0%
- Est. flood insurance / yr
- $507 – $1,088
Fire risk 4/10 · Minor
- Est. fire insurance / yr
- $1,222 – $2,270
Heat risk 8/10 · Major
- Hot days now (above 112°F)
- 7 days/yr
- Hot days in 30 yrs
- 24 days/yr
Wind risk 8/10 · Major
- Chance of severe wind over 30 yrs
- 98.0%
Air-quality risk 2/10 · Minimal
- Unhealthy air days now
- 1 days/yr
- Unhealthy air days in 30 yrs
- 1 days/yr
Risk factors via First Street. Map © Google.
Why this score? — see what drove the B grade
The composite is a weighted blend of 9 inputs, each scored 0–100. Each bar is that input's sub-score; the figure is the points it added to the 100-point composite (weight × sub-score).
- Cash flow +29.6/30.0
- ARV discount +10.2/15.0
- DSCR +10.0/10.0
- 1% rule +7.2/10.0
- Schools +5.4/10.0
- Condition / age +3.8/5.0
- Livability +3.5/5.0
- Rent growth +1.7/5.0
- Appreciation +0.0/10.0
$155,000
🖨 Deal sheet 📄 Offer letter ✓ Due diligence
Listing remarks MLS
Well-maintained 2002 manufactured home located in Hidden Forest Estates. This home is in great condition and offers a comfortable and functional layout, ideal for a variety of buyers. Situated in Montgomery County, the property provides convenient access to nearby amenities, shopping, and major roadways while maintaining a peaceful residential setting. Perfect opportunity for homeowners or investors seeking an affordable property in a growing area.
Key facts
- Convenient access
- Affordable property
- Growing area
Tags
Neighborhood map
What this means for you Summary
Snapshot
- This is a 3-bed/2.0-bath manufactured listed at $155k. Condition is rated good.
Deal economics
- At list price, monthly cash flow is $561 ($7k/yr) — positive.
- The deal already cash-flows at list — no discount required.
- Meets the 1% rule at list price ($2k rent vs $155k).
- Recommended offer: $146k (6.0% below list) — sets the bar for market timing.
- Cap rate 10.6% vs local median 2.0% in Montgomery — top-decile yield for the area; either an underpriced asset or a hidden risk that comps aren't pricing in. Stress-test before assuming the spread holds.
Location & tenants
- Location reads 70/100 on livability (#372 in TX) — a middle-class / working-renter tenant base. Strengths: crime A+, employment A+, housing A+; Watch: amenities F, commute F, health & safety F.
- Montgomery ISD (rural): math 63% / reading 57% proficiency, ranked #49 of 826 in TX (top 6%) — acceptable for families but not a draw, mixed tenant base, ~2y average lease.
- Market conditions: Rents falling (-3.3%/yr); 1056 active listings in the ZIP; 1 comparable units currently listed for rent nearby; solid renter incomes; 13,259 units permitted in Montgomery County in 2024 (1,402 in 5+ unit buildings).
Forward outlook
- Local home prices are declining (-3.0%/yr); year-one equity from $1k of loan paydown is wiped out by about $5k of value loss. Plan a longer hold.
- Montgomery County population projected at +65% by 2050 — long-run rental-demand tailwind backs the buy-and-hold thesis.
Negotiation context
- It's been on market 90 days — a 6% lower offer ($146k) is reasonable based on typical stale-listing flexibility.
- 2 sale attempts since 6y ago with the ask held roughly flat each time — persistent listings suggest the price (not the market) is what's stuck; bring a comps-based counter.
Risks & watch-outs
- Climate carrying-cost: severe wind risk, 98% chance of damaging wind over 30y; extreme-heat days projected 7→24/yr by 2055 (HVAC capex compounding) — expect insurance premiums to compound above CPI over the hold.
Questions for the listing agent
- It's been on market 90 days. Have you received any prior offers? Is the seller open to a 6% concession, seller financing, or rate buy-down credit?
- What does the HOA fee cover, when was the last increase, and are there any pending special assessments or reserve-fund shortfalls?
- Why hasn't it sold? Are there any deal-killer items the seller is aware of (foundation, flood, title, zoning, code violations)?
- Is there a deadline driving the sale (1031 exchange, divorce, estate, relocation)? That informs how much negotiation room exists.
- Schools are B-rated — typically a magnet for longer-tenancy family renters. What's the average tenant stay here, and is there a school-zone premium baked into asking?
- What's the average days-on-market for RENTAL listings here right now (not sales)? A rising rental-DOM trend means longer vacancies and softer asking-rent achievability than the comps imply.
- What's the recent tenant-quality profile in this submarket — average credit score on applications, eviction rate, late-payment / NSF rate, and stable-employment percentage? A property-management company in the area should have these aggregated.
- How much new for-sale + rental construction is in the pipeline within 1–3 miles? Heavy new supply typically softens prices + rents 12–24 months out; constrained supply supports both.
Investment metrics
- 1% rule
- 1.22% ✓
- Cap rate
- 10.63%
- Cash-on-cash
- 15.50%
- DSCR
- 1.69
- GRM
- 6.8
CMA / ARV
- ARV (median comp)
- $164,900
- List price
- $155,000
- Delta
- -6.00%
- Verdict
- FAIR
- Comps
- 1 within 2.0 mi
Show comp detail 1 sale within ~0.75 mi
| Address | Dist | Beds/Ba | Sqft | Sold | Price | $/sf | Match |
|---|---|---|---|---|---|---|---|
| 15443 Forest Dr | 0.23mi | 2/2.0 (-1) | 1,088 (+2%) | 1mo | $164,900 | $152 | 80 |
Match score weights: distance 35% · size 25% · config 20% · recency 20%. Top-matched comps best support the ARV.
Projected returns pro-forma
-3.0% appreciation · 0.0% rent growth · sell at horizon
- IRR
- 3.1%
- Equity multiple
- 1.11×
- Total profit
- $4,980
- Equity at exit
- $23,111
- IRR
- 9.8%
- Equity multiple
- 1.66×
- Total profit
- $28,609
- Equity at exit
- $13,402
Cash invested: $43,400 (down + closing). Projections, not guarantees.
Landlord ↔ Tenant lean methodology
- Overall (STATE)
- 87 Strongly Landlord-Friendly
- State Texas
- 87 Strongly Landlord-Friendly · R+5
- County
- — inherits STATE
- City
- — inherits STATE
ZIP-level market 77356
- Home prices YoY
- -30.3%
- Rents YoY
- -3.3%
- Active inventory
- 1056
- Price-to-rent
- 6.8×
Monthly cashflow live
- Estimated rent
- $1,898 medium interval (Pro) →
- Mortgage (P&I)
- −$813
- Tax from tax record
- −$41 /mo · $486/yr
- Insurance
- −$65
- HOA
- −$21
- Vacancy / Maint / Mgmt
- −$399
- Net cashflow
- $561
Break-even live
UW: 25.0% down · 7.5% · 30yr · 1.5% tax · 5.0% vac · 8.0% maint · 8.0% mgmt
Financing live
Cash to close
- Down payment
- $38,750
- Closing costs
- $4,650
- Reserves months
- —
- Total cash needed
- —
Loan-product check · same deal, 3 products live
Conventional
25% down · 7.5% · 30yr
- Down + closing
- —
- Monthly P&I
- —
- Monthly cashflow
- —
- DSCR
- —
- Eligible?
- —
Personal DTI + credit; lowest rate.
DSCR
20% down · 8.5% · 30yr
- Down + closing
- —
- Monthly P&I
- —
- Monthly cashflow
- —
- DSCR
- —
- Eligible?
- —
No personal income docs; deal must DSCR.
Hard money
10% down · 12.0% · 12mo
- Down + closing
- —
- Monthly P&I
- —
- Monthly cashflow
- —
- DSCR
- —
- Eligible?
- —
Short-term bridge; refi at stabilization.
Rent comps 1 comps
| Address | Beds | Baths | Sqft | Rent | $/sqft | DOM | Units | Dist |
|---|---|---|---|---|---|---|---|---|
| 20278 Willow Ln Montgomery, TX | 3.0 | 2.0 | 1114 | $1,850 | $1.66 | 12d | 1 | 0.70mi |
HOA detail
- Monthly dues
- $21 · $252/yr
Listing history 19 events
-
2026-06-18days on market $155,000 Active 90 DOM
-
2026-06-17days on market $155,000 Active 89 DOM
-
2026-06-16days on market $155,000 Active 88 DOM
-
2026-06-15days on market $155,000 Active 87 DOM
-
2026-06-13days on market $155,000 Active 85 DOM
-
2026-06-13days on market $155,000 Active 84 DOM
-
2026-06-09days on market $155,000 Active 81 DOM
-
2026-06-08days on market $155,000 Active 80 DOM
-
2026-06-07days on market $155,000 Active 79 DOM
-
2026-06-04days on market $155,000 Active 76 DOM
-
2026-06-03days on market $155,000 Active 75 DOM
-
2026-06-02days on market $155,000 Active 74 DOM
-
2026-06-01days on market $155,000 Active 73 DOM
-
2026-05-31days on market $155,000 Active 72 DOM
-
2026-05-02price $155,000 458-char remark
Show marketing remark (458 chars)
Well-maintained 2002 manufactured home located in Hidden Forest Estates. This home is in great condition and offers a comfortable and functional layout, ideal for a variety of buyers. Situated in Montgomery County, the property provides convenient access to nearby amenities, shopping, and major roadways while maintaining a peaceful residential setting. Perfect opportunity for homeowners or investors seeking an affordable property in a growing area.
-
2026-03-18$160,000 Active 458-char remark
Show marketing remark (458 chars)
Well-maintained 2002 manufactured home located in Hidden Forest Estates. This home is in great condition and offers a comfortable and functional layout, ideal for a variety of buyers. Situated in Montgomery County, the property provides convenient access to nearby amenities, shopping, and major roadways while maintaining a peaceful residential setting. Perfect opportunity for homeowners or investors seeking an affordable property in a growing area.
-
2020-07-16soldstatus Sold 527-char remark
Show marketing remark (527 chars)
Awesome new Studio Plan, 1000 sq. ft. with Living down stairs with extra 1/2 Bath. Upstairs 2 Bedrooms with 2 Baths and a 2 Car Garage. This Garage is over sized has a drive through front & back garage door, perfect for storage and or a Man-Cave. Home sits on an over sized Lot, roughly 9700 sq ft. in Hidden Forest Estates. Community backs up to the Sam Houston National Forest, community has a Lake and Community Pool. Lots of piece and quiet in this National Forest. Montgomery ISD, no MUD Tax, Very low tax rate 1.99.
-
2020-06-20status Pending, Continue to Show 527-char remark
Show marketing remark (527 chars)
Awesome new Studio Plan, 1000 sq. ft. with Living down stairs with extra 1/2 Bath. Upstairs 2 Bedrooms with 2 Baths and a 2 Car Garage. This Garage is over sized has a drive through front & back garage door, perfect for storage and or a Man-Cave. Home sits on an over sized Lot, roughly 9700 sq ft. in Hidden Forest Estates. Community backs up to the Sam Houston National Forest, community has a Lake and Community Pool. Lots of piece and quiet in this National Forest. Montgomery ISD, no MUD Tax, Very low tax rate 1.99.
-
2020-06-11$129,900 Active 527-char remark
Show marketing remark (527 chars)
Awesome new Studio Plan, 1000 sq. ft. with Living down stairs with extra 1/2 Bath. Upstairs 2 Bedrooms with 2 Baths and a 2 Car Garage. This Garage is over sized has a drive through front & back garage door, perfect for storage and or a Man-Cave. Home sits on an over sized Lot, roughly 9700 sq ft. in Hidden Forest Estates. Community backs up to the Sam Houston National Forest, community has a Lake and Community Pool. Lots of piece and quiet in this National Forest. Montgomery ISD, no MUD Tax, Very low tax rate 1.99.
ⓘ Source: listings_history table (triggers on properties + properties_extension) + one-shot
backfill from property_details.listing_events for pre-trigger history.
Tax reassessment forecast TX · Resets to sale price
- Current annual tax
- $486 · $41/mo
- Projected year-2 tax
- $2,836 · $236/mo
- Expected delta
- +$2,350/yr (+$196/mo · 483.2%)
ⓘ Screening estimate from a state-policy table — verify with the county assessor before closing.
Climate risk First Street
- Flood 1/10 Low FEMA zone X (unshaded) · 0% chance over 30 yrs
- Wildfire 4/10 Moderate
- Heat 8/10 Severe 7 d/yr ≥112°F today · 24 d/yr by 30 yrs out
- Wind 8/10 Severe 98% chance of damaging wind over 30 yrs
- Air quality 2/10 Low 1 unhealthy d/yr today · 1 by 30 yrs out
Nearby sold comps map
Loading sold comps map…
Walkable amenities ~0.75 mi
Loading nearby amenities…
Taxation est. · year 1
- Rental income
- $22,780
- − Mortgage interest
- −$8,682
- − Property taxes
- −$486
- − Insurance
- −$775
- − Repairs & maintenance
- −$1,822
- − Management
- −$1,822
- − HOA
- −$252
- − Depreciation
- −$4,509
- Taxable income
- $4,430
- Est. tax owed @ 24.0%
- −$1,063
- After-tax cash flow
- $5,665/yr
For passive investors: Depreciation is non-cash, so a rental often shows a tax loss while cash-flowing — sheltering income. Rental losses are passive: they offset passive income freely, and up to $25,000/yr can offset ordinary (W-2) income if you actively participate and your MAGI is under $100k (phasing out to $0 by $150k); unused losses carry forward. On sale, claimed depreciation is recaptured at up to 25%, and gains may owe capital-gains tax (a 1031 exchange can defer both). Figures are a year-1 estimate at your 24.0% rate — not tax advice; consult a CPA.
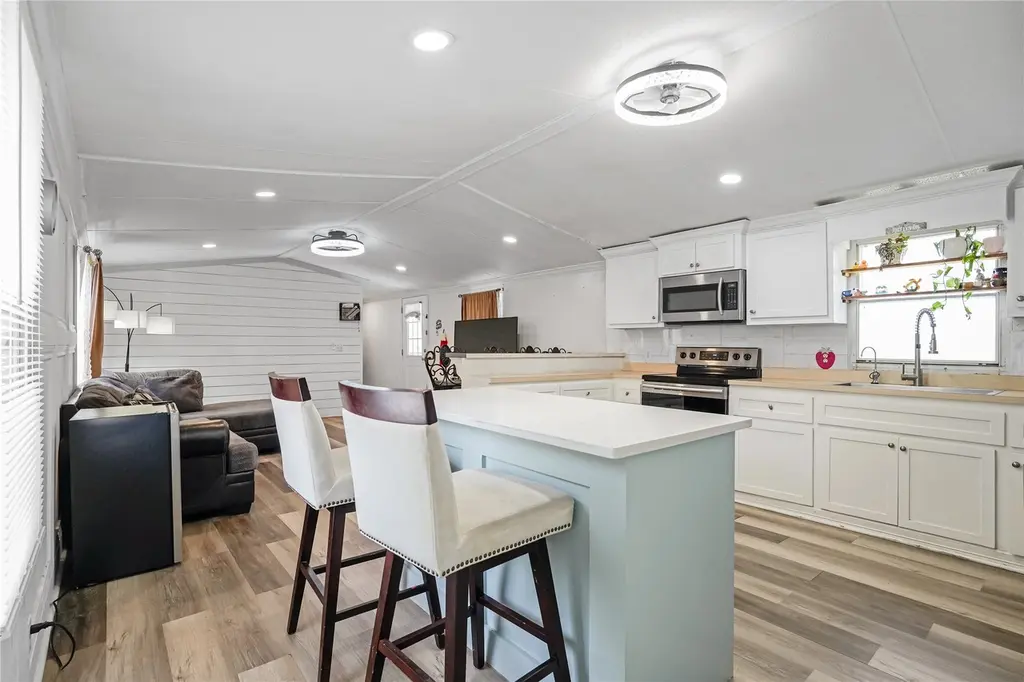
Condition & rehab AI · 12 photos
This well-maintained 2002 manufactured home in Hidden Forest Estates offers a comfortable and functional layout, ideal for a variety of buyers. The home is in good condition with minimal repairs needed and potential for value-adding updates.
Value-add opportunities
- Both Paint the exterior — Fresh paint can enhance curb appeal and property value
- Resale Replace the kitchen faucet — A new faucet can improve the kitchen's appearance and functionality
- Both Install new window treatments — New curtains can improve the home's aesthetics and energy efficiency
Renovation cost estimate screening
Value-add ROI direction
- Both Paint the exterior — Fresh paint can enhance curb appeal and property value ↑
- Resale Replace the kitchen faucet — A new faucet can improve the kitchen's appearance and functionality ↑
- Both Install new window treatments — New curtains can improve the home's aesthetics and energy efficiency ↑
ⓘ Cost ranges are severity-bucket heuristics (US national rule-of-thumb). Get contractor quotes + a written scope before underwriting a rehab budget.
Schools (NCES district)
- District
- Montgomery ISD
- NCES district ID
- 4831260
- Math proficiency
- 63% ▼ -3.00%
- Reading proficiency
- 57% ▼ -3.00%
- Median HH income
- $75,596
- Composite
- 53.55/100
- National rank
- #1445
- State rank
- #49 of 826 in TX
Livability — Montgomery
- Score
- 70/100
- State rank
- #372
- US rank
- #7894
Category grades
Schools grade is shown separately in the Schools card above.
Census & demographics
- County
- Montgomery County · 663,713 people
- City population
- 67,277
- Metro
- Houston-The Woodlands-Sugar Land, TX
- Population (ZIP)
- 32,583
- Household income
- $106,804
- Rent vs Own
- Severe rent burden
- 414.0
Population outlook (Montgomery County) Hauer SSP2
- Today (2025)
- 713,896 people
- By 2030
- 805,263 · +12.8%
- By 2040
- 992,708 · +39.1%
- By 2050
- 1,179,590 · +65.2%
- By 2075
- 1,628,084 · +128.1%
- By 2100
- 1,937,880 · +171.5%
Race, ethnicity, and origin ACS 2023
- Neighborhood character
- Predominantly White (87%)
- Race & ethnicity
- White 87% Two or more races 5% Hispanic / Latino 5% Black 4%
- Common ancestry
- Lithuanian 8% Slovak 2% Romanian 2%
- Foreign-born
- 3% · Canada, China
- Languages at home
- 96% English-only · Spanish 3%
Political lean MEDSL · Montgomery
- 2024 margin
- Solid R (+45.5) · D 26.8% · R 72.3%
- 2008→2024 swing
- +7.2pp toward D · 2008: -52.7pp · 2024: -45.5pp
- All cycles
- 2024: R+45.5 2020: R+43.8 2016: R+51.4 2012: R+60.7 2008: R+52.7
Not yet ingested
- Civics
- —
Market trends
- HPI YoY
- ▼ -101.28%
- Current HPI
- 233.0032
- Rent YoY
- ▼ -3.30%
- Metro
- Houston-The Woodlands-Sugar Land, TX
- State GDP YoY
- ▲ 3.95%
- F500 in state
- 110
Industry mix (Fortune 500 HQ in TX)
| Industry | F500 HQs | Revenue |
|---|---|---|
| Energy | 16 | $1,198B |
|
||
| Technology | 5 | $198B |
|
||
| Engineering / Construction | 4 | $72B |
|
||
| Energy Services | 3 | $60B |
|
||
| Utilities | 3 | $41B |
|
||
| Healthcare | 2 | $330B |
|
||
Price history
+19.3% since first listed5 events — show timeline
- 2026-05-02 Price Changed $155,000 HARMLS
- 2026-03-18 Listed $160,000 HARMLS
- 2020-07-16 Sold (MLS) — HARMLS
- 2020-06-20 Pending — HARMLS
- 2020-06-11 Listed $129,900 HARMLS
Property tax history
+10.0%/yrLatest (2025): $486 · +0.8% YoY. Source: county tax records.
Cash-flow waterfall
monthlySold comps — $/sqft
last 12 mo · ≤1 miLoading sold comps…