2107 Linden Ave SE · Grand Rapids, MI
Flood risk No data
- FEMA flood zone
- —
- Chance of flooding over 30 yrs
- —
- Est. flood insurance / yr
- —
Fire risk No data
- Est. fire insurance / yr
- —
Heat risk No data
- Hot days now (above threshold)
- —
- Hot days in 30 yrs
- —
Wind risk No data
- Chance of severe wind over 30 yrs
- —
Air-quality risk No data
- Unhealthy air days now
- —
- Unhealthy air days in 30 yrs
- —
Risk factors via First Street. Map © Google.
Why this score? — see what drove the D grade
The composite is a weighted blend of 9 inputs, each scored 0–100. Each bar is that input's sub-score; the figure is the points it added to the 100-point composite (weight × sub-score).
- ARV discount +13.5/15.0
- Cash flow +8.5/30.0
- Livability +4.2/5.0
- Condition / age +4.0/5.0
- Rent growth +3.7/5.0
- 1% rule +3.0/10.0
- DSCR +2.3/10.0
- Schools +1.9/10.0
- Appreciation +0.0/10.0
$230,000
🖨 Deal sheet (PDF) 📄 Offer letter ✓ Due diligence
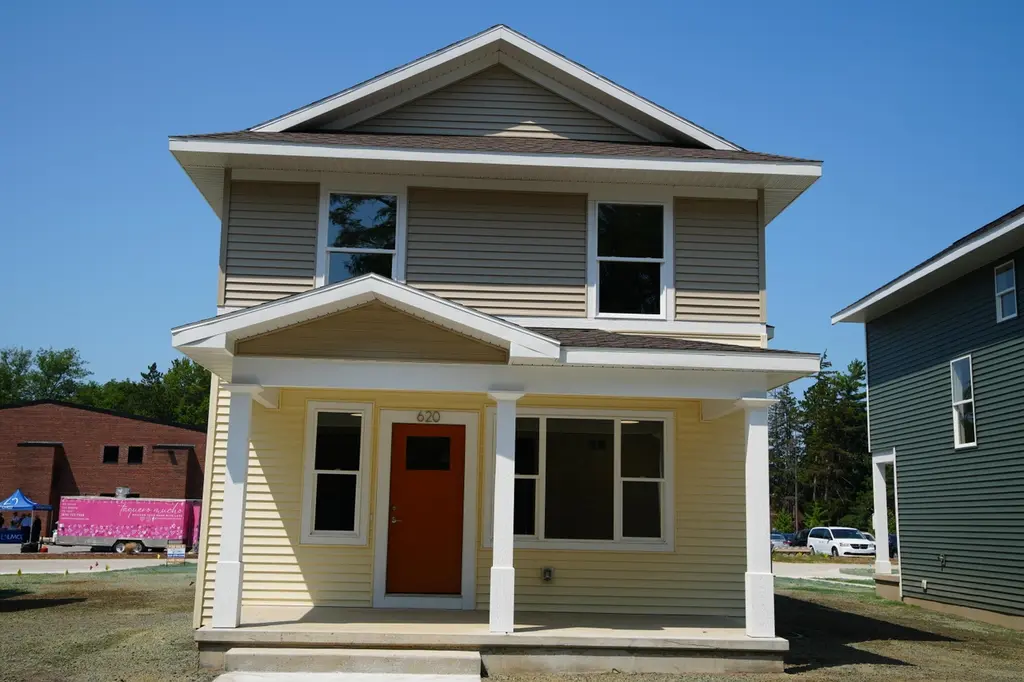
Key facts
- 3,920 sq ft lot
- Built 2024
- Listed 317 days
Neighborhood map
What this means for you Summary
Snapshot
- This is a 3-bed/1.5-bath condo listed at $230k. Condition is rated good.
Deal economics
- At list price, monthly cash flow is $-204 ($-2k/yr) — negative.
- To cash-flow at today's rent, offer at most $209k (9.1% below list).
- To meet the 1% rule (rent ≥ 1% of price), the offer needs to be $183k (20.5% below list).
- Recommended offer: $183k (20.5% below list) — sets the bar for 1% rule.
Location & tenants
- Location reads 83/100 on livability (#44 in MI, #939 nationally) — a professional / high-income tenant draw. Strengths: amenities A+, commute A+, cost of living A+; Watch: employment C-, crime F.
- Grand Rapids Public Schools (urban): math 15% / reading 29% proficiency, ranked #451 of 540 in MI (top 84%) — low school quality limits family demand, transient renter base, plan for 1-2y turnover; 80% free/reduced lunch — lower-income household profile, screen leases tightly.
- Zoned schools: Brookside Elementary (math 2% / reading 8%, grade F, #1,325 of 1,397 statewide, top 99%, 280 students, 85% FRL); Alger Middle School (math 2% / reading 12%, grade F, #481 of 493 statewide, top 98%, 342 students, 95% FRL); City Middlehigh (math 65% / reading 88%, grade A-, #16 of 713 statewide, top 2%, 908 students, 40% FRL).
- Market conditions: Rents rising fast (+4.7%/yr); 178 active listings in the ZIP; 15 comparable units currently listed for rent nearby; rentals lingering (median 46d on market — plan ~5-8 weeks vacancy on turnover, expect pricing pressure); 53% of comp listings sitting > 30 days — soft ceiling on asking rent; 2,253 units permitted in Kent County in 2024 (969 in 5+ unit buildings).
- This rent runs 36% of the median local income ($61k/yr) — at the standard rent-burdened threshold; future hikes will face affordability resistance.
Forward outlook
- Local home prices are declining (-3.0%/yr); year-one equity from $2k of loan paydown is wiped out by about $7k of value loss. Plan a longer hold.
- Kent County population projected at +22% by 2050 — long-run rental-demand tailwind backs the buy-and-hold thesis.
Negotiation context
- It's been on market 317 days — a 12% lower offer ($202k) is reasonable based on typical stale-listing flexibility.
- 3 sale attempts; this cycle's ask has dropped $20k (8%) from the opening price — seller is motivated, your offer sets the floor, not the list.
Questions for the listing agent
- What do current leases actually rent for vs. the listed asking? Can we see a recent rent roll and the last 12 months of T-12 income?
- It's been on market 317 days. Have you received any prior offers? Is the seller open to a 20% concession, seller financing, or rate buy-down credit?
- What does the HOA fee cover, when was the last increase, and are there any pending special assessments or reserve-fund shortfalls?
- Any open or pending special assessments — roof, HVAC, plumbing, elevator, façade? What's the per-unit balance and payoff schedule, and is the seller paying it off at close or rolling it to the buyer?
- Why hasn't it sold? Are there any deal-killer items the seller is aware of (foundation, flood, title, zoning, code violations)?
- Is there a deadline driving the sale (1031 exchange, divorce, estate, relocation)? That informs how much negotiation room exists.
- Crime grade is F in this area — have there been break-ins, vandalism, or insurance claims at this property in the last 3 years? What carrier currently insures it and at what premium?
- The area grade is low — what's the realistic commute time and amenity access for the typical tenant pool here? Any planned neighborhood developments (good or bad) we should know about?
- What's the average days-on-market for RENTAL listings here right now (not sales)? A rising rental-DOM trend means longer vacancies and softer asking-rent achievability than the comps imply.
- What's the recent tenant-quality profile in this submarket — average credit score on applications, eviction rate, late-payment / NSF rate, and stable-employment percentage? A property-management company in the area should have these aggregated.
- How much new apartment / multifamily construction is in the pipeline within 1–3 miles? Heavy new supply (>2% of stock underway) typically softens rents 12–24 months out; light construction supports rent growth.
Investment metrics
- 1% rule
- 0.80% ✗
- Cap rate
- 5.23%
- Cash-on-cash
- -3.80%
- DSCR
- 0.83
- GRM
- 10.5
CMA / ARV
- ARV (median comp)
- $265,193
- List price
- $230,000
- Delta
- -13.27%
- Verdict
- UNDERPRICED
- Comps
- 3 within 1.0 mi
Projected returns pro-forma
-3.0% appreciation · 4.74% rent growth · sell at horizon
- IRR
- -20.6%
- Equity multiple
- 0.27×
- Total profit
- $-46,925
- Equity at exit
- $34,294
- IRR
- -10.3%
- Equity multiple
- 0.33×
- Total profit
- $-43,463
- Equity at exit
- $19,886
Cash invested: $64,400 (down + closing). Projections, not guarantees.
Landlord ↔ Tenant lean methodology
- Overall (STATE)
- 62 Landlord-Friendly
- State Michigan
- 62 Landlord-Friendly · EVEN
- County
- — inherits STATE
- City
- — inherits STATE
ZIP-level market 49507
- Rents YoY
- 4.7%
- Active inventory
- 178
- Price-to-rent
- 10.5×
Monthly cashflow live
- Estimated rent
- $1,829 high interval (Pro) →
- Mortgage (P&I)
- −$1,206
- Tax est. 1.5%
- −$288 /mo · $3,450/yr
- Insurance
- −$96
- HOA est. from 2 same-building comps
- −$59
- Vacancy / Maint / Mgmt
- −$384
- Net cashflow
- $-204
Break-even live
Sensitivity live
| Price | -10% $-45 | -5% $-124 | +0% $-204 | +5% $-283 | +10% $-363 |
|---|---|---|---|---|---|
| Rent | -10% $-348 | -5% $-276 | +0% $-204 | +5% $-132 | +10% $-59 |
| Rate | -1.0pp $-88 | -0.5pp $-145 | base $-204 | +0.5pp $-263 | +1.0pp $-324 |
UW: 25.0% down · 7.5% · 30yr · 1.5% tax · 5.0% vac · 8.0% maint · 8.0% mgmt
Financing live
Cash to close
- Down payment
- $57,500
- Closing costs
- $6,900
- Reserves months
- —
- Total cash needed
- —
Loan-product check · same deal, 3 products live
Conventional
25% down · 7.5% · 30yr
- Down + closing
- —
- Monthly P&I
- —
- Monthly cashflow
- —
- DSCR
- —
- Eligible?
- —
Personal DTI + credit; lowest rate.
DSCR
20% down · 8.5% · 30yr
- Down + closing
- —
- Monthly P&I
- —
- Monthly cashflow
- —
- DSCR
- —
- Eligible?
- —
No personal income docs; deal must DSCR.
Hard money
10% down · 12.0% · 12mo
- Down + closing
- —
- Monthly P&I
- —
- Monthly cashflow
- —
- DSCR
- —
- Eligible?
- —
Short-term bridge; refi at stabilization.
Rent comps 15 comps
| Address | Beds | Baths | Sqft | Rent | $/sqft | DOM | Units | Dist |
|---|---|---|---|---|---|---|---|---|
| 950 Merritt St SE Grand Rapids, MI | 3.0 | 1.0 | 1000 | $2,100 | $2.10 | 45d | 1 | 0.40mi |
| 1031 Merrifield St SE Grand Rapids, MI | 3.0 | 2.0 | 1238 | $2,300 | $1.86 | 16d | 1 | 0.47mi |
| 459 Dickinson St SE Grand Rapids, MI | 2.0 | 1.0 | 731 | $1,195 | $1.63 | 45d | 1 | 0.60mi |
| 1057 Griggs St SE Grand Rapids, MI | 2.0 | 1.0 | 1100 | $1,550 | $1.41 | 45d | 1 | 0.64mi |
| 1220 Ottillia St SE Unit D Grand Rapids, MI | 2.0 | 1.0 | 750 | $1,150 | $1.53 | 45d | 1 | 0.75mi |
| 2040 Division Ave S Unit 207 Grand Rapids, MI | 2.0 | 1.0 | 768 | $1,703 | $2.22 | 4d | 1 | 0.78mi |
| 1309 Madison Ave SE Grand Rapids, MI | 1.0–2.0 | 1.0 | 775 | $1,560 | $2.01 | 4d | 1 | 1.05mi |
| 1555 Margaret Ave SE Grand Rapids, MI | 2.0 | 1.0 | 900 | $1,500 | $1.67 | 16d | 1 | 1.16mi |
| 242 Elm St SW Grand Rapids, MI | 2.0 | 1.5 | 1100 | $3,200 | $2.91 | 4d | 1 | 1.20mi |
| 19 La Belle St SE Grand Rapids, MI | 2.0 | 1.0 | 846 | $1,045 | $1.24 | 45d | 1 | 1.24mi |
| 1400 Rossman Ave SE Grand Rapids, MI | 3.0 | 1.0 | 1400 | $2,200 | $1.57 | 45d | 1 | 1.33mi |
| 2928 Vineland Ave SE Unit 2928 Grand Rapids, MI | 2.0 | 1.0 | 1000 | $1,450 | $1.45 | 25d | 1 | 1.35mi |
| 3202 Marshall Ave SE Grand Rapids, MI | 2.0 | 1.0 | 850 | $1,095 | $1.29 | 45d | 1 | 1.38mi |
| 143 Exchange St SE Unit D Grand Rapids, MI | 2.0 | 1.0 | 920 | $1,295 | $1.41 | 45d | 1 | 1.47mi |
| 143 Exchange St SE Apt B Grand Rapids, MI | 2.0 | 1.0 | 920 | $1,195 | $1.30 | 16d | 1 | 1.47mi |
HOA detail condo
- Monthly dues
- $0 · $0/yr
- Assessments
- None detected in remarks — confirm with the listing agent.
Listing history 22 events
-
2026-06-21days on market $230,000 Active 317 DOM
-
2026-06-18days on market $230,000 Active 314 DOM
-
2026-06-17days on market $230,000 Active 313 DOM
-
2026-06-16days on market $230,000 Active 312 DOM
-
2026-06-15days on market $230,000 Active 311 DOM
-
2026-06-14days on market $230,000 Active 309 DOM
-
2026-06-13days on market $230,000 Active 308 DOM
-
2026-06-10days on market $230,000 Active 306 DOM
-
2026-06-09days on market $230,000 Active 305 DOM
-
2026-06-08days on market $230,000 Active 304 DOM
-
2026-06-07days on market $230,000 Active 303 DOM
-
2026-06-05days on market $230,000 Active 300 DOM
-
2026-06-03days on market $230,000 Active 299 DOM
-
2026-06-03days on market $230,000 Active 298 DOM
-
2026-06-01days on market $230,000 Active 297 DOM
-
2026-05-31days on market $230,000 Active 296 DOM
-
2026-05-03price $230,000
-
2026-05-02price $230,000
-
2026-05-02price $230,000
-
2025-08-01$250,500 Active
-
2025-08-01$250,500 Active
-
2025-08-01$250,500 Active
ⓘ Source: listings_history table (triggers on properties + properties_extension) + one-shot
backfill from property_details.listing_events for pre-trigger history.
Nearby sold comps map
Loading sold comps map…
Walkable amenities ~0.75 mi
Loading nearby amenities…
Taxation est. · year 1
- Rental income
- $21,945
- − Mortgage interest
- −$12,884
- − Property taxes
- −$3,450
- − Insurance
- −$1,150
- − Repairs & maintenance
- −$1,756
- − Management
- −$1,756
- − HOA
- −$708
- − Depreciation
- −$6,691
- Taxable loss
- −$6,448
- Est. tax savings @ 24.0%
- +$1,548
- After-tax cash flow
- $-897/yr
For passive investors: Depreciation is non-cash, so a rental often shows a tax loss while cash-flowing — sheltering income. Rental losses are passive: they offset passive income freely, and up to $25,000/yr can offset ordinary (W-2) income if you actively participate and your MAGI is under $100k (phasing out to $0 by $150k); unused losses carry forward. On sale, claimed depreciation is recaptured at up to 25%, and gains may owe capital-gains tax (a 1031 exchange can defer both). Figures are a year-1 estimate at your 24.0% rate — not tax advice; consult a CPA.
Condition & rehab AI · 9 photos
This property is in excellent condition with a good condition score of 80. It is move-in ready and has a good curb appeal. The home has a good layout and modern finishes, making it an attractive option for both buyers and renters.
Value-add opportunities
- Both Painting the interior walls — Fresh paint can enhance the home's curb appeal and interior aesthetics.
- Both Adding a smart home system — Modern technology can increase the home's appeal and market value.
- Both Upgrading the kitchen appliances — Newer, more energy-efficient appliances can improve the home's energy rating and attract more buyers/renters.
- Both Landscaping the front yard — A well-maintained front yard can enhance the home's curb appeal and attract more buyers/renters.
Renovation cost estimate screening
Value-add ROI direction
- Both Painting the interior walls — Fresh paint can enhance the home's curb appeal and interior aesthetics. ↑
- Both Adding a smart home system — Modern technology can increase the home's appeal and market value. ↑
- Both Upgrading the kitchen appliances — Newer, more energy-efficient appliances can improve the home's energy rating and attract more buyers/renters. ↑
- Both Landscaping the front yard — A well-maintained front yard can enhance the home's curb appeal and attract more buyers/renters. ↑
ⓘ Cost ranges are severity-bucket heuristics (US national rule-of-thumb). Get contractor quotes + a written scope before underwriting a rehab budget.
Schools (NCES district)
- District
- Grand Rapids Public Schools
- NCES district ID
- 2616440
- Math proficiency
- 15% ▼ -5.00%
- Reading proficiency
- 29% ▼ -1.00%
- Median HH income
- $40,612
- Composite
- 18.62/100
- National rank
- #8899
- State rank
- #451 of 540 in MI
Livability — Grand Rapids
- Score
- 83/100
- State rank
- #44
- US rank
- #939
Category grades
Schools grade is shown separately in the Schools card above.
Census & demographics
- Census place
- Grand Rapids, MI
- County
- Kent County · 533,805 people
- City population
- 181,325
- Metro
- Grand Rapids-Kentwood, MI
- Population (ZIP)
- 38,487
- Household income
- $61,461
- Rent vs Own
- Severe rent burden
- 1625.0
Population outlook (Kent County) Hauer SSP2
- Today (2025)
- 712,484 people
- By 2030
- 748,618 · +5.1%
- By 2040
- 814,777 · +14.4%
- By 2050
- 868,556 · +21.9%
- By 2075
- 966,487 · +35.7%
- By 2100
- 967,975 · +35.9%
Race, ethnicity, and origin ACS 2023
- Neighborhood character
- Highly diverse neighborhood (Simpson 0.71)
- Race & ethnicity
- Hispanic / Latino 31% Black 31% White 30% Two or more races 21%
- Hispanic origin (detail)
- Mexican 18% Puerto Rican 3% Dominican 1%
- Common ancestry
- Iranian 8% Romanian 2% Lithuanian 1%
- Foreign-born
- 18% · Canada
- Languages at home
- 71% English-only · Spanish 23% Arabic 1% Other Indo-European 1%
Political lean MEDSL · Kent
- 2024 margin
- Lean D (+5.4) · D 51.8% · R 46.5% · Other 1.7%
- 2008→2024 swing
- +4.8pp toward D · 2008: 0.5pp · 2024: 5.4pp
- All cycles
- 2024: D+5.4 2020: D+6.1 2016: R+3.1 2012: R+7.9 2008: D+0.5
Not yet ingested
- Civics
- —
Market trends
- HPI YoY
- ▼ -301.99%
- Current HPI
- 325.3878
- Rent YoY
- ▲ 4.74%
- Metro
- Grand Rapids-Kentwood, MI
- State GDP YoY
- ▲ 1.37%
- F500 in state
- 28
Industry mix (Fortune 500 HQ in MI)
| Industry | F500 HQs | Revenue |
|---|---|---|
| Automotive Parts | 3 | $48B |
|
||
| Automotive | 2 | $372B |
|
||
| Chemicals | 1 | $45B |
|
||
| Automotive Retail | 1 | $29B |
|
||
| Healthcare / Medical Devices | 1 | $23B |
|
||
| Automotive Technology | 1 | $20B |
|
||
Price history
-8.2% since first listed6 events — show timeline
- 2026-05-03 Price Changed $230,000 MiRealSource-MiMLS
- 2026-05-02 Price Changed $230,000 REALCOMP
- 2026-05-02 Price Changed $230,000 SW Michigan MLS
- 2025-08-01 Listed $250,500 SW Michigan MLS
- 2025-08-01 Listed $250,500 REALCOMP
- 2025-08-01 Listed $250,500 MiRealSource-MiMLS
Cash-flow waterfall
monthlySold comps — $/sqft
last 12 mo · ≤1 miLoading sold comps…