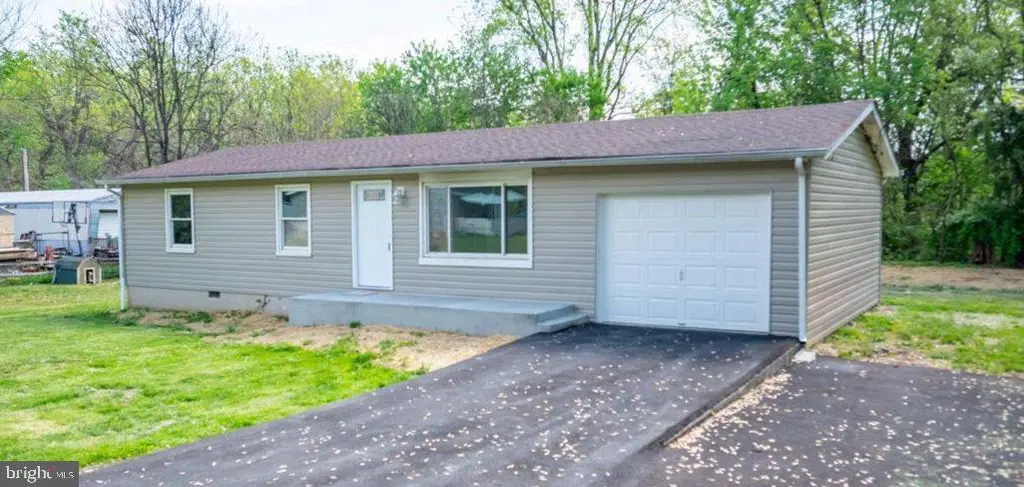
322 Reynard Rd · Ranson, WV
Flood risk 1/10 · Minimal
- FEMA flood zone
- X (unshaded)
- Chance of flooding over 30 yrs
- 0.0%
- Est. flood insurance / yr
- $507 – $1,088
Fire risk 3/10 · Minor
- Est. fire insurance / yr
- $787 – $1,461
Heat risk 5/10 · Moderate
- Hot days now (above 101°F)
- 7 days/yr
- Hot days in 30 yrs
- 16 days/yr
Wind risk 2/10 · Minimal
- Chance of severe wind over 30 yrs
- 2.0%
Air-quality risk 2/10 · Minimal
- Unhealthy air days now
- 0 days/yr
- Unhealthy air days in 30 yrs
- 1 days/yr
Risk factors via First Street. Map © Google.
Why this score? — see what drove the D grade
The composite is a weighted blend of 9 inputs, each scored 0–100. Each bar is that input's sub-score; the figure is the points it added to the 100-point composite (weight × sub-score).
- Cash flow +15.0/30.0
- Appreciation +10.0/10.0
- DSCR +4.6/10.0
- Schools +3.4/10.0
- Livability +3.3/5.0
- 1% rule +2.9/10.0
- Rent growth +2.5/5.0
- Condition / age +2.5/5.0
- ARV discount +0.0/15.0
$249,900
🖨 Deal sheet (PDF) 📄 Offer letter ✓ Due diligence
Listing remarks MLS
3BEDROOM, 1 BATH RANCHER WITH LARGE FAMILY ROOM. DECK. NICE LARGE PARTIALLY FENCED BACKYARD WITH STORAGE SHED. PRICED TO SELL. FIRST TIME HOME BUYERS SPECIAL.
Key facts
- 0.25 acre lot
- Garage
- Built 1975
Property features AI
Exterior
- Parking: Attached front-entry garage with garage door opener and inside access (oversized); One garage space; Asphalt driveway with four driveway spaces; Total of 5 garage/parking spaces
- Utilities: Public water (community/public); Public sewer; Electric hot water; Electric heating and cooling; Cable and satellite internet available; Cable TV and phone available
- Home design: Detached property; Estimated effective year of major renovation 2026; Excellent condition; Fee simple ownership; Not in a federal flood zone
- Construction: Vinyl siding; Architectural shingle roof; Crawl space foundation; Building not winterized
- Exterior features: Patio(s); Outbuilding(s); Shed; Backs to trees; Adjoins open space
Interior
- Kitchen: Built-in microwave; Dishwasher; Self-cleaning oven; Refrigerator
- Bedrooms: Master bedroom; Bedroom 2; Bedroom 3; Three bedrooms on the main level
- Flooring: Luxury vinyl plank
- Bathrooms: One full bathroom (on the main level)
- Heating & cooling: Heat pump(s) heating; Central A/C (electric); 200+ amp electrical service
- Interior features: Tub/shower; Breakfast area; Ceiling fan(s); Combination kitchen/dining; Family room off kitchen; Traditional floor plan; Pantry; Upgraded countertops; Drywall walls and ceilings
- Laundry & utility: Washer/dryer hookup on main floor; Water heater (electric)
Neighborhood map
What this means for you Summary
Snapshot
- This is a 3-bed/1.0-bath single-family listed at $250k.
Deal economics
- At list price, monthly cash flow is $76 ($914/yr) — positive.
- The deal already cash-flows at list — no discount required.
- To meet the 1% rule (rent ≥ 1% of price), the offer needs to be $198k (20.7% below list).
- Recommended offer: $198k (20.7% below list) — sets the bar for 1% rule.
- Cap rate 6.7% vs local median 3.8% in Ranson — top-decile yield for the area; either an underpriced asset or a hidden risk that comps aren't pricing in. Stress-test before assuming the spread holds.
Location & tenants
- Location reads 66/100 on livability (#100 in WV) — a middle-class / working-renter tenant base. Strengths: crime A+, housing A+, cost of living A-; Watch: schools F, amenities F, commute F.
- Jefferson County Schools (rural): math 29% / reading 46% proficiency, ranked #6 of 55 in WV (top 11%) — families likely to look elsewhere, expect single-tenant / working-renter base with shorter leases.
- Market conditions: 62 active listings in the ZIP; 1,162 units permitted in Jefferson County in 2024 (360 in 5+ unit buildings).
Forward outlook
- In year one you build about $27k of equity ($2k loan paydown + $25k appreciation (10.0% local appreciation)).
- Jefferson County population projected at +13% by 2050 — modest demand growth; plan on rents tracking national, not racing it.
- At projected returns (10.0% appreciation + 3.0% rent growth), your $70k cash investment doubles in ~3 years — after that, you're playing with house money.
- By year 2, paydown + projected appreciation supports a ~$43k cash-out refi (75% LTV) — recoverable capital for the next deal without selling this one.
Negotiation context
- It's been on market 36 days — a 3% lower offer ($242k) is reasonable based on typical stale-listing flexibility.
- 3 sale attempts since 17y ago; this cycle's ask has dropped $20k (7%) from the opening price — seller is motivated, your offer sets the floor, not the list.
- Current owner paid $140k; list at $250k implies a 78% gain — meaningful room to come down on a strong offer.
Risks & watch-outs
- Climate carrying-cost: extreme-heat days projected 7→16/yr by 2055 (HVAC capex compounding) — expect insurance premiums to compound above CPI over the hold.
Questions for the listing agent
- It's been on market 36 days. Have you received any prior offers? Is the seller open to a 21% concession, seller financing, or rate buy-down credit?
- Built in 1975 — when were the roof, HVAC, electrical panel, plumbing, and water heater last replaced?
- Is there a deadline driving the sale (1031 exchange, divorce, estate, relocation)? That informs how much negotiation room exists.
- Schools are F-rated, which usually means shorter tenancies and higher turnover. Who's the typical renter profile here, and what's been the actual vacancy rate?
- The area grade is low — what's the realistic commute time and amenity access for the typical tenant pool here? Any planned neighborhood developments (good or bad) we should know about?
- What's the average days-on-market for RENTAL listings here right now (not sales)? A rising rental-DOM trend means longer vacancies and softer asking-rent achievability than the comps imply.
- What's the recent tenant-quality profile in this submarket — average credit score on applications, eviction rate, late-payment / NSF rate, and stable-employment percentage? A property-management company in the area should have these aggregated.
- How much new for-sale + rental construction is in the pipeline within 1–3 miles? Heavy new supply typically softens prices + rents 12–24 months out; constrained supply supports both.
Investment metrics
- 1% rule
- 0.79% ✗
- Cap rate
- 6.66%
- Cash-on-cash
- 1.31%
- DSCR
- 1.06
- GRM
- 10.5
CMA / ARV
- ARV (on-the-fly)
- $172,224
- Comps found
- 2
Show comp detail 2 sales within ~0.75 mi
| Address | Dist | Beds/Ba | Sqft | Sold | Price | $/sf | Match |
|---|---|---|---|---|---|---|---|
| 31 Tally Ho Dr | 0.32mi | 3/1.0 | 1,200 (-4%) | 21mo | $165,000 | $138 | 61 |
| 32 Anvil Rd | 0.15mi | 4/2.0 (+1) | 1,392 (+12%) | 5mo | $100,000 | $72 | 60 |
Match score weights: distance 35% · size 25% · config 20% · recency 20%. Top-matched comps best support the ARV.
Projected returns pro-forma
10.0% appreciation · 3.0% rent growth · sell at horizon
- IRR
- 25.2%
- Equity multiple
- 3.01×
- Total profit
- $140,836
- Equity at exit
- $225,130
- IRR
- 22.2%
- Equity multiple
- 6.87×
- Total profit
- $410,692
- Equity at exit
- $485,501
Cash invested: $69,972 (down + closing). Projections, not guarantees.
Landlord ↔ Tenant lean methodology
- Overall (STATE)
- 83 Strongly Landlord-Friendly
- State West Virginia
- 83 Strongly Landlord-Friendly · R+22
- County
- — inherits STATE
- City
- — inherits STATE
ZIP-level market 25430
- Home prices YoY
- 15.4%
- Active inventory
- 62
- Price-to-rent
- 10.5×
Monthly cashflow live
- Estimated rent
- $1,981 medium interval (Pro) →
- Mortgage (P&I)
- −$1,311
- Tax from tax record
- −$74 /mo · $888/yr
- Insurance
- −$104
- HOA
- −$0
- Vacancy / Maint / Mgmt
- −$416
- Net cashflow
- $76
Break-even live
Sensitivity live
| Price | -10% $218 | -5% $147 | +0% $76 | +5% $5 | +10% $-65 |
|---|---|---|---|---|---|
| Rent | -10% $-80 | -5% $-2 | +0% $76 | +5% $154 | +10% $233 |
| Rate | -1.0pp $202 | -0.5pp $140 | base $76 | +0.5pp $11 | +1.0pp $-54 |
UW: 25.0% down · 7.5% · 30yr · 1.5% tax · 5.0% vac · 8.0% maint · 8.0% mgmt
Financing live
Cash to close
- Down payment
- $62,475
- Closing costs
- $7,497
- Reserves months
- —
- Total cash needed
- —
Loan-product check · same deal, 3 products live
Conventional
25% down · 7.5% · 30yr
- Down + closing
- —
- Monthly P&I
- —
- Monthly cashflow
- —
- DSCR
- —
- Eligible?
- —
Personal DTI + credit; lowest rate.
DSCR
20% down · 8.5% · 30yr
- Down + closing
- —
- Monthly P&I
- —
- Monthly cashflow
- —
- DSCR
- —
- Eligible?
- —
No personal income docs; deal must DSCR.
Hard money
10% down · 12.0% · 12mo
- Down + closing
- —
- Monthly P&I
- —
- Monthly cashflow
- —
- DSCR
- —
- Eligible?
- —
Short-term bridge; refi at stabilization.
Listing history 18 events
-
2026-06-01status $249,900 Pending 36 DOM
-
2026-05-31days on market $249,900 Active 36 DOM
-
2026-05-13price $259,900
-
2026-04-25$269,900 Active
-
2026-04-22historical $269,900
-
2026-01-15soldstatus $140,000
-
2025-11-24soldstatus $95,000
-
2018-05-23soldstatus $95,000
-
2010-01-14soldstatus $35,000 158-char remark
Show marketing remark (158 chars)
3BEDROOM, 1 BATH RANCHER WITH LARGE FAMILY ROOM. DECK. NICE LARGE PARTIALLY FENCED BACKYARD WITH STORAGE SHED. PRICED TO SELL. FIRST TIME HOME BUYERS SPECIAL.
-
2010-01-14soldstatus $35,000 Sold 158-char remark
Show marketing remark (158 chars)
3BEDROOM, 1 BATH RANCHER WITH LARGE FAMILY ROOM. DECK. NICE LARGE PARTIALLY FENCED BACKYARD WITH STORAGE SHED. PRICED TO SELL. FIRST TIME HOME BUYERS SPECIAL.
-
2009-12-23status Contract 158-char remark
Show marketing remark (158 chars)
3BEDROOM, 1 BATH RANCHER WITH LARGE FAMILY ROOM. DECK. NICE LARGE PARTIALLY FENCED BACKYARD WITH STORAGE SHED. PRICED TO SELL. FIRST TIME HOME BUYERS SPECIAL.
-
2009-12-21historical 158-char remark
Show marketing remark (158 chars)
3BEDROOM, 1 BATH RANCHER WITH LARGE FAMILY ROOM. DECK. NICE LARGE PARTIALLY FENCED BACKYARD WITH STORAGE SHED. PRICED TO SELL. FIRST TIME HOME BUYERS SPECIAL.
-
2009-12-10price $37,900 158-char remark
Show marketing remark (158 chars)
3BEDROOM, 1 BATH RANCHER WITH LARGE FAMILY ROOM. DECK. NICE LARGE PARTIALLY FENCED BACKYARD WITH STORAGE SHED. PRICED TO SELL. FIRST TIME HOME BUYERS SPECIAL.
-
2009-10-30price $49,900 158-char remark
Show marketing remark (158 chars)
3BEDROOM, 1 BATH RANCHER WITH LARGE FAMILY ROOM. DECK. NICE LARGE PARTIALLY FENCED BACKYARD WITH STORAGE SHED. PRICED TO SELL. FIRST TIME HOME BUYERS SPECIAL.
-
2009-10-04price $54,900 158-char remark
Show marketing remark (158 chars)
3BEDROOM, 1 BATH RANCHER WITH LARGE FAMILY ROOM. DECK. NICE LARGE PARTIALLY FENCED BACKYARD WITH STORAGE SHED. PRICED TO SELL. FIRST TIME HOME BUYERS SPECIAL.
-
2009-09-04$64,900 Active 158-char remark
Show marketing remark (158 chars)
3BEDROOM, 1 BATH RANCHER WITH LARGE FAMILY ROOM. DECK. NICE LARGE PARTIALLY FENCED BACKYARD WITH STORAGE SHED. PRICED TO SELL. FIRST TIME HOME BUYERS SPECIAL.
-
2009-09-04$37,900 158-char remark
Show marketing remark (158 chars)
3BEDROOM, 1 BATH RANCHER WITH LARGE FAMILY ROOM. DECK. NICE LARGE PARTIALLY FENCED BACKYARD WITH STORAGE SHED. PRICED TO SELL. FIRST TIME HOME BUYERS SPECIAL.
-
1999-07-16soldstatus $28,000
ⓘ Source: listings_history table (triggers on properties + properties_extension) + one-shot
backfill from property_details.listing_events for pre-trigger history.
Tax reassessment forecast WV · Resets to sale price
- Current annual tax
- $888 · $74/mo
- Projected year-2 tax
- $1,474 · $123/mo
- Expected delta
- +$587/yr (+$49/mo · 66.1%)
ⓘ Screening estimate from a state-policy table — verify with the county assessor before closing.
Climate risk First Street
- Flood 1/10 Low FEMA zone X (unshaded) · 0% chance over 30 yrs
- Wildfire 3/10 Moderate
- Heat 5/10 Major 7 d/yr ≥101°F today · 16 d/yr by 30 yrs out
- Wind 2/10 Low 2% chance of damaging wind over 30 yrs
- Air quality 2/10 Low 0 unhealthy d/yr today · 1 by 30 yrs out
Nearby sold comps map
Loading sold comps map…
Walkable amenities ~0.75 mi
Loading nearby amenities…
Taxation est. · year 1
- Rental income
- $23,769
- − Mortgage interest
- −$13,998
- − Property taxes
- −$888
- − Insurance
- −$1,250
- − Repairs & maintenance
- −$1,901
- − Management
- −$1,901
- − Depreciation
- −$7,270
- Taxable loss
- −$3,440
- Est. tax savings @ 24.0%
- +$826
- After-tax cash flow
- $1,739/yr
For passive investors: Depreciation is non-cash, so a rental often shows a tax loss while cash-flowing — sheltering income. Rental losses are passive: they offset passive income freely, and up to $25,000/yr can offset ordinary (W-2) income if you actively participate and your MAGI is under $100k (phasing out to $0 by $150k); unused losses carry forward. On sale, claimed depreciation is recaptured at up to 25%, and gains may owe capital-gains tax (a 1031 exchange can defer both). Figures are a year-1 estimate at your 24.0% rate — not tax advice; consult a CPA.
Schools (NCES district)
- District
- Jefferson County Schools
- NCES district ID
- 5400570
- Math proficiency
- 29% ▼ -13.00%
- Reading proficiency
- 46% ▼ -7.00%
- Median HH income
- $67,038
- Composite
- 33.98/100
- National rank
- #5322
- State rank
- #6 of 55 in WV
Livability — Ranson
- Score
- 66/100
- State rank
- #100
- US rank
- #11255
Category grades
Schools grade is shown separately in the Schools card above.
Census & demographics
- City population
- 7,330
- Population (ZIP)
- 8,215
Population outlook (Jefferson County) Hauer SSP2
- Today (2025)
- 61,715 people
- By 2030
- 64,052 · +3.8%
- By 2040
- 67,713 · +9.7%
- By 2050
- 69,843 · +13.2%
- By 2075
- 72,679 · +17.8%
- By 2100
- 71,872 · +16.5%
Race, ethnicity, and origin ACS 2023
- Neighborhood character
- Predominantly White (88%)
- Race & ethnicity
- White 88% Two or more races 5% Hispanic / Latino 4% Black 3%
- Common ancestry
- Italian 3% Iranian 3% Lithuanian 2%
- Foreign-born
- 3% · Canada, Guatemala
- Languages at home
- 96% English-only · Spanish 2% German/W. Germanic 1%
Political lean MEDSL · Jefferson
- 2024 margin
- R (+15.8) · D 41.0% · R 56.8% · Other 2.1%
- 2008→2024 swing
- -20.6pp toward R · 2008: 4.8pp · 2024: -15.8pp
- All cycles
- 2024: R+15.8 2020: R+10.5 2016: R+15.3 2012: R+4.0 2008: D+4.8
Not yet ingested
- Civics
- —
Market trends
- HPI YoY
- ▲ 43.13%
- Current HPI
- 322.5052
- Rent YoY
- —
- Metro
- —
- State GDP YoY
- —
- F500 in state
- 0
Price history
+828.2% since first listed16 events — show timeline
- 2026-05-13 Price Changed $259,900 BRIGHT MLS
- 2026-04-25 Listed $269,900 BRIGHT MLS
- 2026-04-22 Coming Soon $269,900 BRIGHT MLS
- 2026-01-15 Sold (Public Records) $140,000 Public Records
- 2025-11-24 Sold (Public Records) $95,000 Public Records
- 2018-05-23 Sold (Public Records) $95,000 Public Records
- 2010-01-14 Sold (MLS) $35,000 MRIS
- 2010-01-14 Sold (MLS) $35,000 BRIGHT MLS
- 2009-12-23 Pending — MRIS
- 2009-12-21 Listing Removed — BRIGHT MLS
- 2009-12-10 Price Changed $37,900 MRIS
- 2009-10-30 Price Changed $49,900 MRIS
- 2009-10-04 Price Changed $54,900 MRIS
- 2009-09-04 Listed $64,900 MRIS
- 2009-09-04 Listed $37,900 BRIGHT MLS
- 1999-07-16 Sold (Public Records) $28,000 Public Records
Property tax history
+2.2%/yrLatest (2025): $888 · +14.4% YoY. Source: county tax records.
Cash-flow waterfall
monthlySold comps — $/sqft
last 12 mo · ≤1 miLoading sold comps…