5480 Amarillo Del Sol · San Ysidro, NM
Flood risk 1/10 · Minimal
- FEMA flood zone
- X (unshaded)
- Chance of flooding over 30 yrs
- 0.0%
- Est. flood insurance / yr
- $507 – $1,088
Fire risk 4/10 · Minor
- Est. fire insurance / yr
- $706 – $1,312
Heat risk 6/10 · Moderate
- Hot days now (above 99°F)
- 7 days/yr
- Hot days in 30 yrs
- 25 days/yr
Wind risk 1/10 · Minimal
- Chance of severe wind over 30 yrs
- —
Air-quality risk 1/10 · Minimal
- Unhealthy air days now
- 0 days/yr
- Unhealthy air days in 30 yrs
- 0 days/yr
Risk factors via First Street. Map © Google.
Why this score? — see what drove the D grade
The composite is a weighted blend of 9 inputs, each scored 0–100. Each bar is that input's sub-score; the figure is the points it added to the 100-point composite (weight × sub-score).
- Cash flow +14.3/30.0
- ARV discount +7.5/15.0
- Schools +4.6/10.0
- DSCR +4.4/10.0
- Livability +3.2/5.0
- 1% rule +2.8/10.0
- Rent growth +2.5/5.0
- Condition / age +2.5/5.0
- Appreciation +0.0/10.0
$255,000
🖨 Deal sheet (PDF) 📄 Offer letter ✓ Due diligence
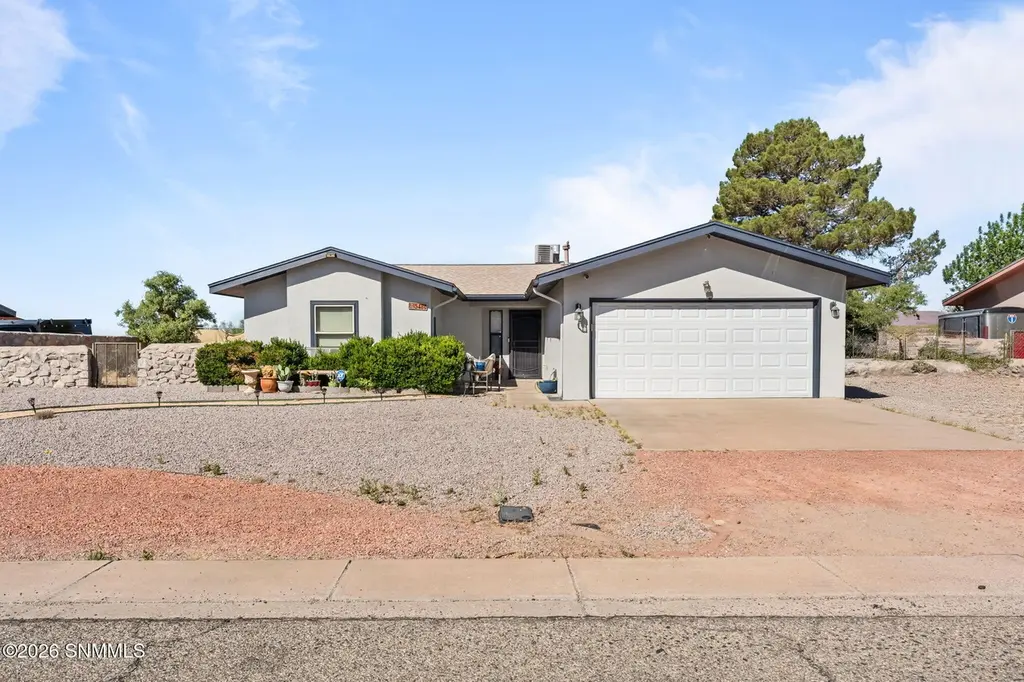
Listing remarks
Very well maintained and thoughtfully upgraded throughout, this 3 bedroom, 2 bath home offers comfort, functionality, and space to enjoy. Situated on an oversized lot with RV access and no backyard neighbors, the property provides an open backdrop and plenty of room for entertaining, relaxing with a glass of tea, or storing your RV and toys. A welcoming courtyard invites you in, while the cozy living room fireplace creates the perfect atmosphere for quiet evenings at home. The spacious layout offers flexibility for everyday living and gatherings alike. Pride of ownership is evident throughout with numerous updates and meticulous care. Whether you're looking for extra outdoor space, room for
Key facts
- Welcoming courtyard
- Rv access
- Oversized lot
Tags
Property features AI
Finance
- Other: Located in Mirasol Subdivision
Exterior
- Parking: 2-car garage with garage door opener
- Utilities: Public water; Septic tank sewer; Cable available
- Home design: Single-family residence; One level
- Construction: Frame construction; Shingle roof; Slab foundation; Built on lot sized about 0.34 acres
- Exterior features: Covered patio/porch; Cul-de-sac lot
Interior
- Kitchen: Electric range; Disposal; Microwave; Refrigerator
- Bathrooms: 2 full bathrooms
- Heating & cooling: Central air conditioning; Forced air heating; Fireplace heating
- Interior features: Open floor plan; Living room fireplace
Neighborhood map
What this means for you Summary
Snapshot
- This is a 3-bed/2.0-bath single-family listed at $255k.
Deal economics
- At list price, monthly cash flow is $49 ($584/yr) — positive.
- The deal already cash-flows at list — no discount required.
- To meet the 1% rule (rent ≥ 1% of price), the offer needs to be $200k (21.6% below list).
- Recommended offer: $200k (21.6% below list) — sets the bar for 1% rule.
Location & tenants
- Location reads 64/100 on livability (#69 in NM) — a middle-class / working-renter tenant base. Strengths: crime A+, employment A+, housing A+; Watch: amenities F, commute F, health & safety F.
- Las Cruces Public Schools (urban): math 42% / reading 68% proficiency, ranked #5 of 29 in NM (top 17%) — acceptable for families but not a draw, mixed tenant base, ~2y average lease; 62% free/reduced lunch — lower-income household profile, screen leases tightly.
- Zoned schools: Dona Ana Elementary (399 students, 100% FRL); Vista Middle (602 students, 100% FRL); Mayfield High (math 24% / reading 54%, grade F, #68 of 110 statewide, top 62%, 1,421 students, 0% FRL) — zoned schools at 67% FRL track the district average.
- Zoned-school proficiency averages 40% at this address vs 55% district-wide (-16 pts) — the specific schools serving this property underperform the Las Cruces Public Schools average; the district grade overstates school quality for this exact location.
- Market conditions: 226 active listings in the ZIP; 1 comparable units currently listed for rent nearby; 964 units permitted in Doña Ana County in 2024 (0 in 5+ unit buildings).
Forward outlook
- Local home prices are declining (-3.0%/yr); year-one equity from $2k of loan paydown is wiped out by about $8k of value loss. Plan a longer hold.
Negotiation context
- Only 1 days on market — expect competitive offers; lowballing is unlikely to land.
Risks & watch-outs
- Climate carrying-cost: extreme-heat days projected 7→25/yr by 2055 (HVAC capex compounding) — expect insurance premiums to compound above CPI over the hold.
Questions for the listing agent
- Is there a deadline driving the sale (1031 exchange, divorce, estate, relocation)? That informs how much negotiation room exists.
- Schools are F-rated, which usually means shorter tenancies and higher turnover. Who's the typical renter profile here, and what's been the actual vacancy rate?
- The area grade is low — what's the realistic commute time and amenity access for the typical tenant pool here? Any planned neighborhood developments (good or bad) we should know about?
- What's the average days-on-market for RENTAL listings here right now (not sales)? A rising rental-DOM trend means longer vacancies and softer asking-rent achievability than the comps imply.
- What's the recent tenant-quality profile in this submarket — average credit score on applications, eviction rate, late-payment / NSF rate, and stable-employment percentage? A property-management company in the area should have these aggregated.
- How much new for-sale + rental construction is in the pipeline within 1–3 miles? Heavy new supply typically softens prices + rents 12–24 months out; constrained supply supports both.
Investment metrics
- 1% rule
- 0.78% ✗
- Cap rate
- 6.52%
- Cash-on-cash
- 0.82%
- DSCR
- 1.04
- GRM
- 10.6
CMA / ARV
No comps found within radius.
Projected returns pro-forma
-3.0% appreciation · 3.0% rent growth · sell at horizon
- IRR
- -15.1%
- Equity multiple
- 0.46×
- Total profit
- $-38,332
- Equity at exit
- $38,021
- IRR
- -6.5%
- Equity multiple
- 0.58×
- Total profit
- $-29,841
- Equity at exit
- $22,048
Cash invested: $71,400 (down + closing). Projections, not guarantees.
Landlord ↔ Tenant lean methodology
- Overall (STATE)
- 55 Moderately Landlord-Leaning
- State New Mexico
- 55 Moderately Landlord-Leaning · D+3
- County
- — inherits STATE
- City
- — inherits STATE
ZIP-level market 88007
- Home prices YoY
- -26.3%
- Active inventory
- 226
- Price-to-rent
- 10.6×
Monthly cashflow live
- Estimated rent
- $2,000 medium interval (Pro) →
- Mortgage (P&I)
- −$1,337
- Tax from tax record
- −$88 /mo · $1,054/yr
- Insurance
- −$106
- HOA
- −$0
- Vacancy / Maint / Mgmt
- −$420
- Net cashflow
- $49
Break-even live
Sensitivity live
| Price | -10% $193 | -5% $121 | +0% $49 | +5% $-23 | +10% $-96 |
|---|---|---|---|---|---|
| Rent | -10% $-109 | -5% $-30 | +0% $49 | +5% $128 | +10% $207 |
| Rate | -1.0pp $177 | -0.5pp $114 | base $49 | +0.5pp $-17 | +1.0pp $-85 |
UW: 25.0% down · 7.5% · 30yr · 1.5% tax · 5.0% vac · 8.0% maint · 8.0% mgmt
Financing live
Cash to close
- Down payment
- $63,750
- Closing costs
- $7,650
- Reserves months
- —
- Total cash needed
- —
Loan-product check · same deal, 3 products live
Conventional
25% down · 7.5% · 30yr
- Down + closing
- —
- Monthly P&I
- —
- Monthly cashflow
- —
- DSCR
- —
- Eligible?
- —
Personal DTI + credit; lowest rate.
DSCR
20% down · 8.5% · 30yr
- Down + closing
- —
- Monthly P&I
- —
- Monthly cashflow
- —
- DSCR
- —
- Eligible?
- —
No personal income docs; deal must DSCR.
Hard money
10% down · 12.0% · 12mo
- Down + closing
- —
- Monthly P&I
- —
- Monthly cashflow
- —
- DSCR
- —
- Eligible?
- —
Short-term bridge; refi at stabilization.
Rent comps 1 comps
| Address | Beds | Baths | Sqft | Rent | $/sqft | DOM | Units | Dist |
|---|---|---|---|---|---|---|---|---|
| 5475 Valle Alegre Las Cruces, NM | 4.0 | 2.0 | 1464 | $2,000 | $1.37 | 45d | 1 | 0.19mi |
Listing history 3 events
-
2026-05-21status Pending
-
2026-05-20$255,000 Active
-
2001-04-02soldstatus
ⓘ Source: listings_history table (triggers on properties + properties_extension) + one-shot
backfill from property_details.listing_events for pre-trigger history.
Tax reassessment forecast NM · Resets to sale price
- Current annual tax
- $1,054 · $88/mo
- Projected year-2 tax
- $2,040 · $170/mo
- Expected delta
- +$986/yr (+$82/mo · 93.6%)
ⓘ Screening estimate from a state-policy table — verify with the county assessor before closing.
Climate risk First Street
- Flood 1/10 Low FEMA zone X (unshaded) · 0% chance over 30 yrs
- Wildfire 4/10 Moderate
- Heat 6/10 Major 7 d/yr ≥99°F today · 25 d/yr by 30 yrs out
- Wind 1/10 Low
- Air quality 1/10 Low 0 unhealthy d/yr today · 0 by 30 yrs out
Nearby sold comps map
Loading sold comps map…
Walkable amenities ~0.75 mi
Loading nearby amenities…
Taxation est. · year 1
- Rental income
- $24,000
- − Mortgage interest
- −$14,284
- − Property taxes
- −$1,054
- − Insurance
- −$1,275
- − Repairs & maintenance
- −$1,920
- − Management
- −$1,920
- − Depreciation
- −$7,418
- Taxable loss
- −$3,871
- Est. tax savings @ 24.0%
- +$929
- After-tax cash flow
- $1,513/yr
For passive investors: Depreciation is non-cash, so a rental often shows a tax loss while cash-flowing — sheltering income. Rental losses are passive: they offset passive income freely, and up to $25,000/yr can offset ordinary (W-2) income if you actively participate and your MAGI is under $100k (phasing out to $0 by $150k); unused losses carry forward. On sale, claimed depreciation is recaptured at up to 25%, and gains may owe capital-gains tax (a 1031 exchange can defer both). Figures are a year-1 estimate at your 24.0% rate — not tax advice; consult a CPA.
Schools (NCES district)
- District
- Las Cruces Public Schools
- NCES district ID
- 3501500
- Math proficiency
- 42% ▲ 24.00%
- Reading proficiency
- 68% ▲ 35.00%
- Median HH income
- $41,157
- Composite
- 45.98/100
- National rank
- #2535
- State rank
- #5 of 29 in NM
Livability — San Ysidro
- Score
- 64/100
- State rank
- #69
- US rank
- #14393
Category grades
Schools grade is shown separately in the Schools card above.
Census & demographics
- Population (ZIP)
- 25,750
Population outlook (Doña Ana County) Hauer SSP2
- Today (2025)
- 219,177 people
- By 2030
- 220,967 · +0.8%
- By 2040
- 222,775 · +1.6%
- By 2050
- 223,576 · +2.0%
- By 2075
- 228,461 · +4.2%
- By 2100
- 214,536 · -2.1%
Race, ethnicity, and origin ACS 2023
- Neighborhood character
- Majority Hispanic (61%)
- Race & ethnicity
- Hispanic / Latino 61% White 34% Two or more races 19% Native American 1% Pacific Islander 1%
- Hispanic origin (detail)
- Mexican 48%
- Common ancestry
- Italian 2% Slovak 1% Lithuanian 1%
- Foreign-born
- 10% · Canada, South Korea
- Languages at home
- 69% English-only · Spanish 30% Tagalog/Filipino 1%
Political lean MEDSL · Doña Ana
- 2024 margin
- Lean D (+9.8) · D 53.8% · R 44.0% · Other 2.2%
- 2008→2024 swing
- -7.9pp toward R · 2008: 17.6pp · 2024: 9.8pp
- All cycles
- 2024: D+9.8 2020: D+18.3 2016: D+18.0 2012: D+14.9 2008: D+17.6
Not yet ingested
- Civics
- —
Market trends
- HPI YoY
- ▼ -73.30%
- Current HPI
- 205.0841
- Rent YoY
- —
- Metro
- —
- State GDP YoY
- —
- F500 in state
- 0
Price history
3 events — show timeline
- 2026-05-21 Pending — SNMMLS as distributed by MLS GRID
- 2026-05-20 Listed $255,000 SNMMLS as distributed by MLS GRID
- 2001-04-02 Sold (Public Records) — Public Records
Property tax history
+1.9%/yrLatest (2025): $1,054 · +2.5% YoY. Source: county tax records.
Cash-flow waterfall
monthlySold comps — $/sqft
last 12 mo · ≤1 miLoading sold comps…