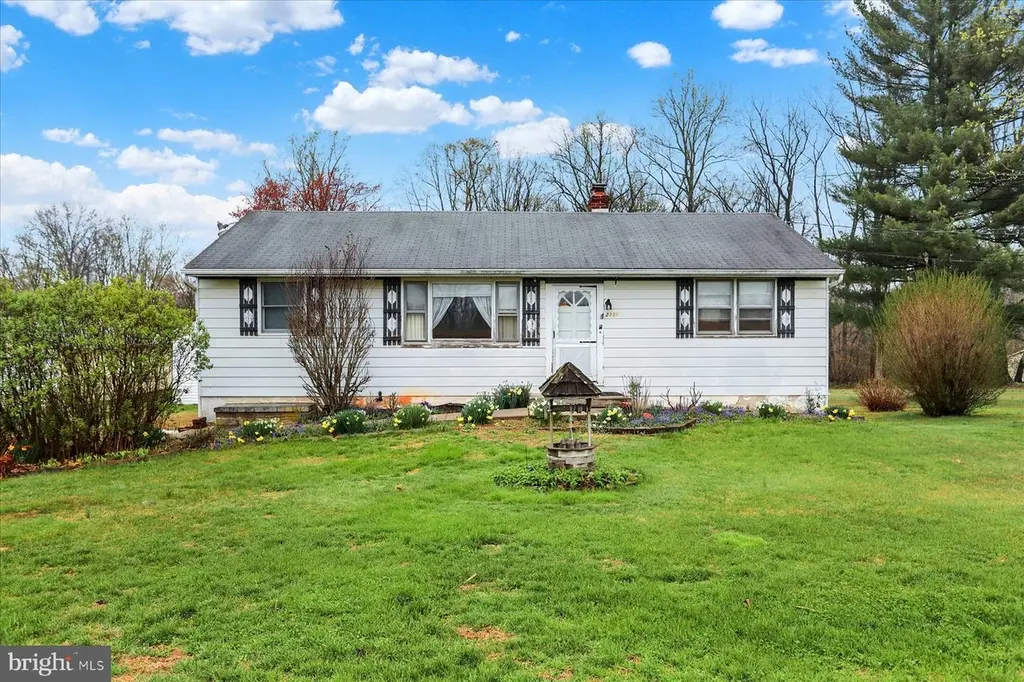
2115 White House Rd · Bel Air North, MD
Flood risk 1/10 · Minimal
- FEMA flood zone
- X (unshaded)
- Chance of flooding over 30 yrs
- 0.0%
- Est. flood insurance / yr
- $473 – $860
Fire risk 3/10 · Minor
- Est. fire insurance / yr
- $755 – $1,403
Heat risk 6/10 · Moderate
- Hot days now (above 105°F)
- 7 days/yr
- Hot days in 30 yrs
- 14 days/yr
Wind risk 5/10 · Moderate
- Chance of severe wind over 30 yrs
- 26.0%
Air-quality risk 3/10 · Minor
- Unhealthy air days now
- 3 days/yr
- Unhealthy air days in 30 yrs
- 5 days/yr
Risk factors via First Street. Map © Google.
Why this score? — see what drove the D grade
The composite is a weighted blend of 9 inputs, each scored 0–100. Each bar is that input's sub-score; the figure is the points it added to the 100-point composite (weight × sub-score).
- Cash flow +14.1/30.0
- ARV discount +9.9/15.0
- DSCR +4.3/10.0
- Livability +4.1/5.0
- Rent growth +3.6/5.0
- 1% rule +3.1/10.0
- Schools +2.9/10.0
- Condition / age +2.5/5.0
- Appreciation +0.0/10.0
$295,000
🖨 Deal sheet (PDF) 📄 Offer letter ✓ Due diligence
Listing remarks
A home with potential in a setting that’s hard to beat. This rancher-style home sits on a level . 46‑acre lot offering peaceful views and a sense of space. The main level includes 3 bedrooms and 1 full bath, a comfortable living room and a combined kitchen/dining area. The unfinished basement provides room for storage and includes washer/dryer hookups. Outside, the 22' x 28' detached garage with electric is ideal for vehicles, projects, or extra storage. The home needs a refresh but could be a great opportunity for a buyer who wants to update and customize a home rather than compete in the market for something already renovated. Enjoy country views, a usable lot, and the chance to mak
Key facts
- 0.46 acre lot
- 4 garage spots
- Built 1950
Property features AI
Exterior
- Parking: Detached garage with four spaces; Additional detached garage storage area; Garage door opener; Oversized garage with front entry; Driveway with two parking spaces; Gravel driveway; Total of six garage and parking spaces
- Utilities: Private water source; On-site septic system; Electric service for cooling and hot water
- Home design: Detached single-family structure; Level entry to main floor; Above-grade and below-grade living areas
- Construction: Aluminum siding exterior; Concrete perimeter foundation; Partial, unfinished basement with rear entrance and walkout level; Garage(s) on property
- Exterior features: Level lot with rear yard; Rural setting, not in development; Rear yard
Interior
- Kitchen: Eat-in kitchen
- Bedrooms: Three bedrooms on the main level
- Bathrooms: One full bathroom (main level)
- Heating & cooling: Forced air heating; Oil-fired heating; Central air conditioning; Electric hot water
- Interior features: Combination kitchen and dining area; Entry-level bedroom; Eat-in kitchen
- Laundry & utility: Laundry in the basement
Neighborhood map
What this means for you Summary
Snapshot
- This is a 3-bed/1.0-bath single-family listed at $295k.
Deal economics
- At list price, monthly cash flow is $43 ($515/yr) — positive.
- The deal already cash-flows at list — no discount required.
- To meet the 1% rule (rent ≥ 1% of price), the offer needs to be $240k (18.8% below list).
- Recommended offer: $240k (18.8% below list) — sets the bar for 1% rule.
- Cap rate 6.5% vs local median 4.2% in Bel Air North — top-decile yield for the area; either an underpriced asset or a hidden risk that comps aren't pricing in. Stress-test before assuming the spread holds.
Location & tenants
- Location reads 82/100 on livability (#35 in MD, #1,269 nationally) — a professional / high-income tenant draw. Strengths: employment A+, housing A+, health & safety A+; Watch: crime C-, amenities C-, cost of living F.
- Harford County Public Schools (suburban): math 22% / reading 39% proficiency, ranked #9 of 24 in MD (top 38%) — families likely to look elsewhere, expect single-tenant / working-renter base with shorter leases.
- Zoned schools: Dublin Elementary (math 17% / reading 22%, grade F, #353 of 860 statewide, top 45%, 212 students, 42% FRL); Southampton Middle (math 20% / reading 51%, grade F, #43 of 225 statewide, top 20%, 1,175 students, 21% FRL); C. Milton Wright High (math 65% / reading 63%, grade B-, #59 of 222 statewide, top 27%, 1,266 students, 23% FRL) — zoned schools at 29% FRL track the district average.
- Market conditions: Rents rising fast (+4.2%/yr); 165 active listings in the ZIP; high-income renter base; 803 units permitted in Harford County in 2024 (26 in 5+ unit buildings).
Forward outlook
- Local home prices are declining (-3.0%/yr); year-one equity from $2k of loan paydown is wiped out by about $9k of value loss. Plan a longer hold.
Negotiation context
- Only 4 days on market — expect competitive offers; lowballing is unlikely to land.
- 2 sale attempts since 29y ago with the ask held roughly flat each time — persistent listings suggest the price (not the market) is what's stuck; bring a comps-based counter.
Risks & watch-outs
- Watch-outs: built in 1950 — expect roof / HVAC / electrical / plumbing capex.
- Climate carrying-cost: moderate wind risk, 26% chance of damaging wind over 30y; extreme-heat days projected 7→14/yr by 2055 (HVAC capex compounding) — expect insurance premiums to compound above CPI over the hold.
Questions for the listing agent
- Built in 1950 — when were the roof, HVAC, electrical panel, plumbing, and water heater last replaced?
- Is there a deadline driving the sale (1031 exchange, divorce, estate, relocation)? That informs how much negotiation room exists.
- Schools are B-rated — typically a magnet for longer-tenancy family renters. What's the average tenant stay here, and is there a school-zone premium baked into asking?
- The area grade is low — what's the realistic commute time and amenity access for the typical tenant pool here? Any planned neighborhood developments (good or bad) we should know about?
- What's the average days-on-market for RENTAL listings here right now (not sales)? A rising rental-DOM trend means longer vacancies and softer asking-rent achievability than the comps imply.
- What's the recent tenant-quality profile in this submarket — average credit score on applications, eviction rate, late-payment / NSF rate, and stable-employment percentage? A property-management company in the area should have these aggregated.
- How much new for-sale + rental construction is in the pipeline within 1–3 miles? Heavy new supply typically softens prices + rents 12–24 months out; constrained supply supports both.
Investment metrics
- 1% rule
- 0.81% ✗
- Cap rate
- 6.47%
- Cash-on-cash
- 0.62%
- DSCR
- 1.03
- GRM
- 10.3
CMA / ARV
- ARV (on-the-fly)
- $311,472
- Comps found
- 3
Show comp detail 3 sales within ~0.75 mi
| Address | Dist | Beds/Ba | Sqft | Sold | Price | $/sf | Match |
|---|---|---|---|---|---|---|---|
| 2115 White House Rd | 0.00mi | 3/1.0 | 1,008 (0%) | 1mo | $311,000 | $309 | 99 |
| 2127 White House Rd | 0.10mi | 4/1.0 (+1) | 1,100 (+9%) | 14mo | $240,000 | $218 | 64 |
| 2600 Sandy Hook Rd | 0.36mi | 3/1.0 | 1,125 (+12%) | 2mo | $387,000 | $344 | 62 |
Match score weights: distance 35% · size 25% · config 20% · recency 20%. Top-matched comps best support the ARV.
Projected returns pro-forma
-3.0% appreciation · 4.23% rent growth · sell at horizon
- IRR
- -14.1%
- Equity multiple
- 0.49×
- Total profit
- $-42,151
- Equity at exit
- $43,985
- IRR
- -3.6%
- Equity multiple
- 0.75×
- Total profit
- $-20,889
- Equity at exit
- $25,506
Cash invested: $82,600 (down + closing). Projections, not guarantees.
Landlord ↔ Tenant lean methodology
- Overall (STATE)
- 27 Tenant-Leaning
- State Maryland
- 27 Tenant-Leaning · D+14
- County
- — inherits STATE
- City
- — inherits STATE
ZIP-level market 21015
- Rents YoY
- 4.2%
- Active inventory
- 165
- Price-to-rent
- 10.3×
Monthly cashflow live
- Estimated rent
- $2,395 medium interval (Pro) →
- Mortgage (P&I)
- −$1,547
- Tax from tax record
- −$179 /mo · $2,152/yr
- Insurance
- −$123
- HOA
- −$0
- Vacancy / Maint / Mgmt
- −$503
- Net cashflow
- $43
Break-even live
Sensitivity live
| Price | -10% $210 | -5% $126 | +0% $43 | +5% $-41 | +10% $-124 |
|---|---|---|---|---|---|
| Rent | -10% $-146 | -5% $-52 | +0% $43 | +5% $137 | +10% $232 |
| Rate | -1.0pp $191 | -0.5pp $118 | base $43 | +0.5pp $-34 | +1.0pp $-111 |
UW: 25.0% down · 7.5% · 30yr · 1.5% tax · 5.0% vac · 8.0% maint · 8.0% mgmt
Financing live
Cash to close
- Down payment
- $73,750
- Closing costs
- $8,850
- Reserves months
- —
- Total cash needed
- —
Loan-product check · same deal, 3 products live
Conventional
25% down · 7.5% · 30yr
- Down + closing
- —
- Monthly P&I
- —
- Monthly cashflow
- —
- DSCR
- —
- Eligible?
- —
Personal DTI + credit; lowest rate.
DSCR
20% down · 8.5% · 30yr
- Down + closing
- —
- Monthly P&I
- —
- Monthly cashflow
- —
- DSCR
- —
- Eligible?
- —
No personal income docs; deal must DSCR.
Hard money
10% down · 12.0% · 12mo
- Down + closing
- —
- Monthly P&I
- —
- Monthly cashflow
- —
- DSCR
- —
- Eligible?
- —
Short-term bridge; refi at stabilization.
Listing history 6 events
-
2026-05-19status Pending
-
2026-04-21historical Active Under Contract
-
2026-04-17$295,000 Active
-
2026-04-07historical $295,000
-
1997-10-13historical
-
1997-06-11
ⓘ Source: listings_history table (triggers on properties + properties_extension) + one-shot
backfill from property_details.listing_events for pre-trigger history.
Tax reassessment forecast MD · Partial reset (capped growth)
- Current annual tax
- $2,152 · $179/mo
- Projected year-2 tax
- $2,684 · $224/mo
- Expected delta
- +$532/yr (+$44/mo · 24.7%)
ⓘ Screening estimate from a state-policy table — verify with the county assessor before closing.
Climate risk First Street
- Flood 1/10 Low FEMA zone X (unshaded) · 0% chance over 30 yrs
- Wildfire 3/10 Moderate
- Heat 6/10 Major 7 d/yr ≥105°F today · 14 d/yr by 30 yrs out
- Wind 5/10 Major 26% chance of damaging wind over 30 yrs
- Air quality 3/10 Moderate 3 unhealthy d/yr today · 5 by 30 yrs out
Nearby sold comps map
Loading sold comps map…
Walkable amenities ~0.75 mi
Loading nearby amenities…
Taxation est. · year 1
- Rental income
- $28,741
- − Mortgage interest
- −$16,525
- − Property taxes
- −$2,152
- − Insurance
- −$1,475
- − Repairs & maintenance
- −$2,299
- − Management
- −$2,299
- − Depreciation
- −$8,582
- Taxable loss
- −$4,591
- Est. tax savings @ 24.0%
- +$1,102
- After-tax cash flow
- $1,616/yr
For passive investors: Depreciation is non-cash, so a rental often shows a tax loss while cash-flowing — sheltering income. Rental losses are passive: they offset passive income freely, and up to $25,000/yr can offset ordinary (W-2) income if you actively participate and your MAGI is under $100k (phasing out to $0 by $150k); unused losses carry forward. On sale, claimed depreciation is recaptured at up to 25%, and gains may owe capital-gains tax (a 1031 exchange can defer both). Figures are a year-1 estimate at your 24.0% rate — not tax advice; consult a CPA.
Schools (NCES district)
- District
- Harford County Public Schools
- NCES district ID
- 2400390
- Math proficiency
- 22% ▼ -23.00%
- Reading proficiency
- 39% ▼ -12.00%
- Median HH income
- $79,569
- Composite
- 29.38/100
- National rank
- #6527
- State rank
- #9 of 24 in MD
Livability — Bel Air North
- Score
- 82/100
- State rank
- #35
- US rank
- #1269
Category grades
Schools grade is shown separately in the Schools card above.
Census & demographics
- County
- Harford County · 198,512 people
- Metro
- Baltimore-Columbia-Towson, MD
- Population (ZIP)
- 30,013
- Household income
- $137,281
- Rent vs Own
- Severe rent burden
- 251.0
Population outlook (Harford County) Hauer SSP2
- Today (2025)
- 262,292 people
- By 2030
- 266,437 · +1.6%
- By 2040
- 269,954 · +2.9%
- By 2050
- 265,659 · +1.3%
- By 2075
- 252,886 · -3.6%
- By 2100
- 224,014 · -14.6%
Race, ethnicity, and origin ACS 2023
- Neighborhood character
- Predominantly White (79%)
- Race & ethnicity
- White 79% Black 7% Two or more races 6% Asian 5% Hispanic / Latino 5%
- Common ancestry
- Romanian 5% Italian 2% Lithuanian 2%
- Foreign-born
- 6% · Canada, Vietnam, China
- Languages at home
- 91% English-only · Spanish 3% Other Indo-European 2% Vietnamese 1%
Political lean MEDSL · Harford
- 2024 margin
- R (+13.8) · D 41.9% · R 55.7% · Other 2.4%
- 2008→2024 swing
- +5.0pp toward D · 2008: -18.8pp · 2024: -13.8pp
- All cycles
- 2024: R+13.8 2020: R+12.0 2016: R+24.5 2012: R+19.5 2008: R+18.8
Not yet ingested
- Civics
- —
Market trends
- HPI YoY
- ▼ -211.26%
- Current HPI
- 251.2512
- Rent YoY
- ▲ 4.23%
- Metro
- Baltimore-Columbia-Towson, MD
- State GDP YoY
- ▲ 2.97%
- F500 in state
- 12
Industry mix (Fortune 500 HQ in MD)
| Industry | F500 HQs | Revenue |
|---|---|---|
| Aerospace / Defense | 1 | $71B |
|
||
| Utilities | 1 | $25B |
|
||
| Hotels | 1 | $24B |
|
||
| Consumer Goods | 1 | $7B |
|
||
| Real Estate | 1 | $6B |
|
||
| Chemicals | 1 | $2B |
|
||
Price history
+0.0% since first listed6 events — show timeline
- 2026-05-19 Pending — BRIGHT MLS
- 2026-04-21 Contingent — BRIGHT MLS
- 2026-04-17 Listed $295,000 BRIGHT MLS
- 2026-04-07 Coming Soon $295,000 BRIGHT MLS
- 1997-10-13 Delisted — MRIS
- 1997-06-11 Listed — MRIS
Property tax history
+1.7%/yrLatest (2025): $2,152 · +34.6% YoY. Source: county tax records.
Cash-flow waterfall
monthlySold comps — $/sqft
last 12 mo · ≤1 miLoading sold comps…