 Multi-family
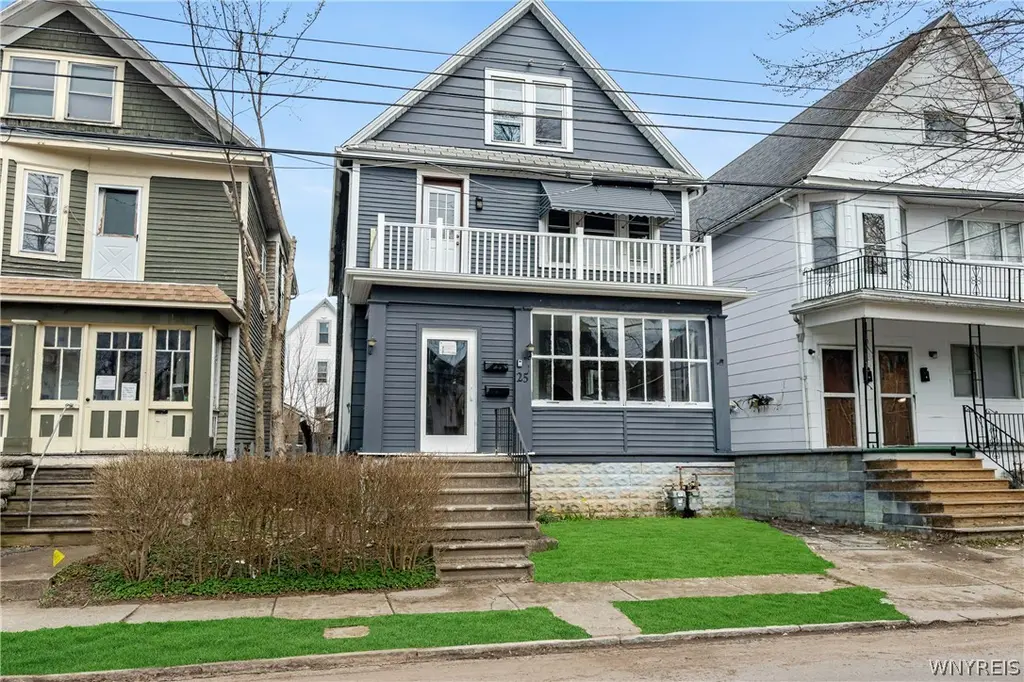
25 Hartman Pl · Buffalo, NY
Flood risk 1/10 · Minimal
- FEMA flood zone
- X (unshaded)
- Chance of flooding over 30 yrs
- 0.0%
- Est. flood insurance / yr
- $473 – $860
Fire risk 1/10 · Minimal
- Est. fire insurance / yr
- $691 – $1,283
Heat risk 3/10 · Minor
- Hot days now (above 93°F)
- 7 days/yr
- Hot days in 30 yrs
- 15 days/yr
Wind risk 1/10 · Minimal
- Chance of severe wind over 30 yrs
- —
Air-quality risk 4/10 · Minor
- Unhealthy air days now
- 4 days/yr
- Unhealthy air days in 30 yrs
- 9 days/yr
Risk factors via First Street. Map © Google.
Why this score? — see what drove the C- grade
The composite is a weighted blend of 9 inputs, each scored 0–100. Each bar is that input's sub-score; the figure is the points it added to the 100-point composite (weight × sub-score).
- Cash flow +16.4/30.0
- ARV discount +11.1/15.0
- DSCR +5.1/10.0
- 1% rule +4.5/10.0
- Rent growth +4.5/5.0
- Livability +3.9/5.0
- Schools +3.3/10.0
- Condition / age +2.5/5.0
- Appreciation +0.0/10.0
$254,900
🖨 Deal sheet 📄 Offer letter ✓ Due diligence
Multi-family units
County records classify this as Multi-Family (2-4 Unit). Listing-text estimate: 1 unit. estimate disagrees with records
Listing remarks MLS
FULLY RENOVATED! 25 Hartman Place. Completely redone from top to bottom—this is a true move-in ready home with everything BRAND NEW! New heating system, All new electrical & plumbing (fully replaced), 2 brand new kitchens, 2 fully updated bathrooms. New flooring throughout, Dry basement with new concrete floor, Fresh paint inside & outside, driveway garage available! Perfect for homeowners or investors! Vacant – Easy to show. Open Houses 4/18 1-3pm and 4/19 11am-1pm. • Offers will be received as they are submitted. Owner is a licensed real estate agent.
Key facts
- New kitchens
- New plumbing
- New electrical
Tags
Neighborhood map
What this means for you Summary
Snapshot
- This is a 4-bed/2.0-bath multifamily listed at $255k.
Deal economics
- At list price, monthly cash flow is $143 ($2k/yr) — positive.
- The deal already cash-flows at list — no discount required.
- To meet the 1% rule (rent ≥ 1% of price), the offer needs to be $241k (5.4% below list).
- Recommended offer: $240k (6.0% below list) — sets the bar for market timing.
Location & tenants
- Location reads 77/100 on livability (#195 in NY, #3,011 nationally) — a middle-class / working-renter tenant base. Strengths: commute A+, housing A+, health & safety A+; Watch: crime F, employment D-.
- Buffalo City School District (urban): math 41% / reading 40% proficiency, ranked #535 of 590 in NY (top 91%) — families likely to look elsewhere, expect single-tenant / working-renter base with shorter leases; 75% free/reduced lunch — lower-income household profile, screen leases tightly.
- Market conditions: Rents rising fast (+8.2%/yr); 197 active listings in the ZIP; 6 comparable units currently listed for rent nearby; rentals at typical pace (median 14d on market — plan ~3-4 weeks tenant-placement turnaround); lower-income renter base — watch delinquency; 1,244 units permitted in Erie County in 2024 (563 in 5+ unit buildings).
- At $2,411/mo this rent would consume 73% of the median local household income ($40k/yr) (locally 2177% of renters already pay >50% of income on rent) — very limited rent-growth headroom before tenants either downsize or default.
Forward outlook
- Local home prices are declining (-3.0%/yr); year-one equity from $2k of loan paydown is wiped out by about $8k of value loss. Plan a longer hold.
- At projected returns (-3.0% appreciation + 8.0% rent growth), your $71k cash investment doubles in ~10 years — after that, you're playing with house money.
Negotiation context
- It's been on market 61 days — a 6% lower offer ($240k) is reasonable based on typical stale-listing flexibility.
- 2 sale attempts; this cycle's ask has dropped $20k (7%) from the opening price — seller is motivated, your offer sets the floor, not the list.
- Current owner paid $95k; list at $255k implies a 168% gain — meaningful room to come down on a strong offer.
Risks & watch-outs
- Watch-outs: built in 1920 — expect roof / HVAC / electrical / plumbing capex.
Questions for the listing agent
- It's been on market 61 days. Have you received any prior offers? Is the seller open to a 6% concession, seller financing, or rate buy-down credit?
- Built in 1920 — when were the roof, HVAC, electrical panel, plumbing, and water heater last replaced?
- Why hasn't it sold? Are there any deal-killer items the seller is aware of (foundation, flood, title, zoning, code violations)?
- Is there a deadline driving the sale (1031 exchange, divorce, estate, relocation)? That informs how much negotiation room exists.
- Crime grade is F in this area — have there been break-ins, vandalism, or insurance claims at this property in the last 3 years? What carrier currently insures it and at what premium?
- What's the average days-on-market for RENTAL listings here right now (not sales)? A rising rental-DOM trend means longer vacancies and softer asking-rent achievability than the comps imply.
- What's the recent tenant-quality profile in this submarket — average credit score on applications, eviction rate, late-payment / NSF rate, and stable-employment percentage? A property-management company in the area should have these aggregated.
- How much new apartment / multifamily construction is in the pipeline within 1–3 miles? Heavy new supply (>2% of stock underway) typically softens rents 12–24 months out; light construction supports rent growth.
Investment metrics
- 1% rule
- 0.95% ✗
- Cap rate
- 6.97%
- Cash-on-cash
- 2.41%
- DSCR
- 1.11
- GRM
- 8.8
CMA / ARV
- ARV (median comp)
- $277,130
- List price
- $254,900
- Delta
- -8.02%
- Verdict
- FAIR
- Comps
- 20 within 1.0 mi
Show comp detail 12 sales within ~0.75 mi
| Address | Dist | Beds/Ba | Sqft | Sold | Price | $/sf | Match |
|---|---|---|---|---|---|---|---|
| 37 Peoria St | 0.06mi | 4/2.0 | 2,148 (+8%) | 6mo | $138,000 | $64 | 78 |
| 2112 Niagara St | 0.19mi | 5/2.0 (+1) | 2,020 (+2%) | 14mo | $163,000 | $81 | 71 |
| 181 Gorton St | 0.28mi | 4/2.0 | 1,864 (-6%) | 11mo | $109,000 | $58 | 68 |
| 29 Hunt Ave | 0.37mi | 4/2.0 | 2,026 (+2%) | 20mo | $185,000 | $91 | 62 |
| 18 Lamont Pl | 0.37mi | 5/2.0 (+1) | 1,848 (-7%) | 12mo | $220,000 | $119 | 57 |
| 14 Collaton St | 0.37mi | 4/2.0 | 1,708 (-14%) | 9mo | $105,000 | $61 | 53 |
| 227 Crowley Ave | 0.69mi | 3/2.0 (-1) | 1,909 (-4%) | 6mo | $155,000 | $81 | 52 |
| 85 Gallatin Ave | 0.44mi | 5/2.0 (+1) | 2,092 (+6%) | 16mo | $195,000 | $93 | 51 |
| 63 Mayer Ave | 0.49mi | 5/2.0 (+1) | 1,912 (-3%) | 18mo | $230,000 | $120 | 51 |
| 24 Briggs Ave | 0.51mi | 4/2.0 | 2,192 (+11%) | 13mo | $211,000 | $96 | 47 |
| 561-63 Military Rd | 0.69mi | 4/2.0 | 1,812 (-8%) | 14mo | $350,000 | $193 | 42 |
| 128 Crowley Ave | 0.73mi | 4/2.0 | 2,080 (+5%) | 20mo | $198,000 | $95 | 41 |
Match score weights: distance 35% · size 25% · config 20% · recency 20%. Top-matched comps best support the ARV.
Projected returns pro-forma
-3.0% appreciation · 8.0% rent growth · sell at horizon
- IRR
- -7.0%
- Equity multiple
- 0.73×
- Total profit
- $-19,411
- Equity at exit
- $38,006
- IRR
- 8.0%
- Equity multiple
- 1.74×
- Total profit
- $52,976
- Equity at exit
- $22,039
Cash invested: $71,372 (down + closing). Projections, not guarantees.
Landlord ↔ Tenant lean methodology
- Overall (STATE)
- 15 Strongly Tenant-Friendly
- State New York
- 15 Strongly Tenant-Friendly · D+10
- County
- — inherits STATE
- City
- — inherits STATE
ZIP-level market 14207
- Home prices YoY
- -18.9%
- Rents YoY
- 8.2%
- Active inventory
- 197
- Price-to-rent
- 17.6×
Monthly cashflow live
- Estimated rent
- $2,411 high interval (Pro) →
- Mortgage (P&I)
- −$1,337
- Tax est. 1.5%
- −$319 /mo · $3,824/yr
- Insurance
- −$106
- HOA
- −$0
- Vacancy / Maint / Mgmt
- −$506
- Net cashflow
- $143
Break-even live
2-unit breakdown (identical units grouped — click to expand)
| Units | Beds | Baths | Est. rent |
|---|---|---|---|
| 2× units | 2 | 1 | $2,410 |
| #1 | 2 | 1 | $1,205 |
| #2 | 2 | 1 | $1,205 |
| Total (2 units) | $2,411 | ||
UW: 25.0% down · 7.5% · 30yr · 1.5% tax · 5.0% vac · 8.0% maint · 8.0% mgmt
Financing live
Cash to close
- Down payment
- $63,725
- Closing costs
- $7,647
- Reserves months
- —
- Total cash needed
- —
Loan-product check · same deal, 3 products live
Conventional
25% down · 7.5% · 30yr
- Down + closing
- —
- Monthly P&I
- —
- Monthly cashflow
- —
- DSCR
- —
- Eligible?
- —
Personal DTI + credit; lowest rate.
DSCR
20% down · 8.5% · 30yr
- Down + closing
- —
- Monthly P&I
- —
- Monthly cashflow
- —
- DSCR
- —
- Eligible?
- —
No personal income docs; deal must DSCR.
Hard money
10% down · 12.0% · 12mo
- Down + closing
- —
- Monthly P&I
- —
- Monthly cashflow
- —
- DSCR
- —
- Eligible?
- —
Short-term bridge; refi at stabilization.
Rent comps 6 comps
| Address | Beds | Baths | Sqft | Rent | $/sqft | DOM | Units | Dist |
|---|---|---|---|---|---|---|---|---|
| 78 Germain St Buffalo, NY | 3.0 | 1.0 | 2030 | $1,300 | $0.64 | 14d | 1 | 0.82mi |
| 62 Germain St Buffalo, NY | 3.0 | 1.0 | 1320 | $1,250 | $0.95 | 23d | 1 | 0.84mi |
| 61 Baxter St Buffalo, NY | 3.0 | 1.0 | 2014 | $1,400 | $0.70 | 1d | 1 | 1.00mi |
| 100 Forest Ave Buffalo, NY | 2.0–4.0 | 2.0–4.0 | 1304 | $2,560 | $1.96 | 1d | 14 | 1.17mi |
| 139 Fordham Dr Buffalo, NY | 3.0 | 1.0 | 1453 | $1,700 | $1.17 | 23d | 1 | 1.38mi |
| 62 Seabrook St Buffalo, NY | 4.0 | 1.0 | 1300 | $2,000 | $1.54 | 1d | 1 | 1.41mi |
Listing history 22 events
-
2026-06-18days on market $254,900 Active 61 DOM
-
2026-06-17days on market $254,900 Active 60 DOM
-
2026-06-16pricedays on market $254,900 Active 59 DOM
-
2026-06-15days on market $264,900 Active 58 DOM
-
2026-06-13days on market $264,900 Active 56 DOM
-
2026-06-13days on market $264,900 Active 55 DOM
-
2026-06-10days on market $264,900 Active 53 DOM
-
2026-06-09days on market $264,900 Active 52 DOM
-
2026-06-08days on market $264,900 Active 51 DOM
-
2026-06-07days on market $264,900 Active 50 DOM
-
2026-06-03days on market $264,900 Active 46 DOM
-
2026-06-02days on market $264,900 Active 45 DOM
-
2026-06-01days on market $264,900 Active 44 DOM
-
2026-05-31days on market $264,900 Active 43 DOM
-
2026-04-27price $264,900 612-char remark
Show marketing remark (612 chars)
FULLY RENOVATED! 25 Hartman Place. Completely redone from top to bottom—this is a true move-in ready home with everything BRAND NEW! New heating system, All new electrical & plumbing (fully replaced), 2 brand new kitchens, 2 fully updated bathrooms. New flooring throughout, Dry basement with new concrete floor, Fresh paint inside & outside, driveway garage available! Perfect for homeowners or investors! Vacant – Easy to show. Open Houses 4/18 1-3pm and 4/19 11am-1pm. • Offers will be received as they are submitted. Owner is a licensed real estate agent.
-
2026-04-14$274,900 Active 612-char remark
Show marketing remark (612 chars)
FULLY RENOVATED! 25 Hartman Place. Completely redone from top to bottom—this is a true move-in ready home with everything BRAND NEW! New heating system, All new electrical & plumbing (fully replaced), 2 brand new kitchens, 2 fully updated bathrooms. New flooring throughout, Dry basement with new concrete floor, Fresh paint inside & outside, driveway garage available! Perfect for homeowners or investors! Vacant – Easy to show. Open Houses 4/18 1-3pm and 4/19 11am-1pm. • Offers will be received as they are submitted. Owner is a licensed real estate agent.
-
2025-08-21soldstatus $95,000
-
2025-08-19soldstatus $95,000 Closed 565-char remark
Show marketing remark (565 chars)
Investor Special Opportunity! This classic 2-family home features a 2 bed/1 bath upper and 2 bed/1 bath lower unit—perfect for rental income or live-in renovation. While the property needs updates, it already has big-ticket improvements completed: a brand-new roof with transferable warranty and a rebuilt second-floor porch. With a little vision and sweat equity, this home could shine! Enjoy the added bonus of a private driveway and detached garage. Located in a growing area with strong rental potential, this is a great chance to build equity and value.
-
2025-05-21status Pending 565-char remark
Show marketing remark (565 chars)
Investor Special Opportunity! This classic 2-family home features a 2 bed/1 bath upper and 2 bed/1 bath lower unit—perfect for rental income or live-in renovation. While the property needs updates, it already has big-ticket improvements completed: a brand-new roof with transferable warranty and a rebuilt second-floor porch. With a little vision and sweat equity, this home could shine! Enjoy the added bonus of a private driveway and detached garage. Located in a growing area with strong rental potential, this is a great chance to build equity and value.
-
2025-05-19$84,900 Active 565-char remark
Show marketing remark (565 chars)
Investor Special Opportunity! This classic 2-family home features a 2 bed/1 bath upper and 2 bed/1 bath lower unit—perfect for rental income or live-in renovation. While the property needs updates, it already has big-ticket improvements completed: a brand-new roof with transferable warranty and a rebuilt second-floor porch. With a little vision and sweat equity, this home could shine! Enjoy the added bonus of a private driveway and detached garage. Located in a growing area with strong rental potential, this is a great chance to build equity and value.
-
2022-04-13soldstatus $27,500
-
1996-09-12soldstatus $40,000
ⓘ Source: listings_history table (triggers on properties + properties_extension) + one-shot
backfill from property_details.listing_events for pre-trigger history.
Climate risk First Street
- Flood 1/10 Low FEMA zone X (unshaded) · 0% chance over 30 yrs
- Wildfire 1/10 Low
- Heat 3/10 Moderate 7 d/yr ≥93°F today · 15 d/yr by 30 yrs out
- Wind 1/10 Low
- Air quality 4/10 Moderate 4 unhealthy d/yr today · 9 by 30 yrs out
Nearby sold comps map
Loading sold comps map…
Walkable amenities ~0.75 mi
Loading nearby amenities…
Taxation est. · year 1
- Rental income
- $28,932
- − Mortgage interest
- −$14,278
- − Property taxes
- −$3,824
- − Insurance
- −$1,274
- − Repairs & maintenance
- −$2,315
- − Management
- −$2,315
- − Depreciation
- −$7,415
- Taxable loss
- −$2,489
- Est. tax savings @ 24.0%
- +$597
- After-tax cash flow
- $2,315/yr
For passive investors: Depreciation is non-cash, so a rental often shows a tax loss while cash-flowing — sheltering income. Rental losses are passive: they offset passive income freely, and up to $25,000/yr can offset ordinary (W-2) income if you actively participate and your MAGI is under $100k (phasing out to $0 by $150k); unused losses carry forward. On sale, claimed depreciation is recaptured at up to 25%, and gains may owe capital-gains tax (a 1031 exchange can defer both). Figures are a year-1 estimate at your 24.0% rate — not tax advice; consult a CPA.
Schools (NCES district)
- District
- Buffalo City School District
- NCES district ID
- 3605850
- Math proficiency
- 41% ▲ 11.00%
- Reading proficiency
- 40% ▲ 7.00%
- Median HH income
- $31,665
- Composite
- 33.17/100
- National rank
- #5544
- State rank
- #535 of 590 in NY
Livability — Buffalo
- Score
- 77/100
- State rank
- #195
- US rank
- #3011
Category grades
Schools grade is shown separately in the Schools card above.
Census & demographics
- Census place
- Buffalo, NY
- County
- Erie County · 714,559 people
- City population
- 440,021
- Metro
- Buffalo-Cheektowaga, NY
- Population (ZIP)
- 26,327
- Household income
- $39,753
- Rent vs Own
- Severe rent burden
- 2177.0
Population outlook (Erie County) Hauer SSP2
- Today (2025)
- 933,037 people
- By 2030
- 935,181 · +0.2%
- By 2040
- 928,531 · -0.5%
- By 2050
- 905,725 · -2.9%
- By 2075
- 834,037 · -10.6%
- By 2100
- 708,033 · -24.1%
Race, ethnicity, and origin ACS 2023
- Neighborhood character
- Highly diverse neighborhood (Simpson 0.74)
- Race & ethnicity
- White 40% Hispanic / Latino 23% Black 16% Asian 15% Two or more races 14%
- Hispanic origin (detail)
- Puerto Rican 18% Dominican 2%
- Common ancestry
- Romanian 8% Portuguese 1% Arab 1%
- Foreign-born
- 19% · Philippines, Canada, India
- Languages at home
- 65% English-only · Spanish 14% Other Asian/Pacific 10% Other Indo-European 5%
Political lean MEDSL · Erie
- 2024 margin
- Lean D (+9.7) · D 54.8% · R 45.2%
- 2008→2024 swing
- -7.9pp toward R · 2008: 17.5pp · 2024: 9.7pp
- All cycles
- 2024: D+9.7 2020: D+14.7 2016: D+4.8 2012: D+15.6 2008: D+17.5
Not yet ingested
- Civics
- —
Market trends
- HPI YoY
- ▼ -54.42%
- Current HPI
- 233.0902
- Rent YoY
- ▲ 8.19%
- Metro
- Buffalo-Cheektowaga, NY
- State GDP YoY
- ▲ 2.60%
- F500 in state
- 92
Industry mix (Fortune 500 HQ in NY)
| Industry | F500 HQs | Revenue |
|---|---|---|
| Financial Services | 10 | $950B |
|
||
| Consumer Goods | 9 | $162B |
|
||
| Insurance | 4 | $225B |
|
||
| Telecommunications | 2 | $144B |
|
||
| Pharmaceuticals | 2 | $112B |
|
||
| Media / Entertainment | 2 | $69B |
|
||
Price history
+562.2% since first listed8 events — show timeline
- 2026-04-27 Price Changed $264,900 WNYREIS
- 2026-04-14 Listed $274,900 WNYREIS
- 2025-08-21 Sold (Public Records) $95,000 Public Records
- 2025-08-19 Sold (MLS) $95,000 WNYREIS
- 2025-05-21 Pending — WNYREIS
- 2025-05-19 Listed $84,900 WNYREIS
- 2022-04-13 Sold (Public Records) $27,500 Public Records
- 1996-09-12 Sold (Public Records) $40,000 Public Records
Property tax history
+4.0%/yrLatest (2025): $376 · +0.0% YoY. Source: county tax records.
Cash-flow waterfall
monthlySold comps — $/sqft
last 12 mo · ≤1 miLoading sold comps…