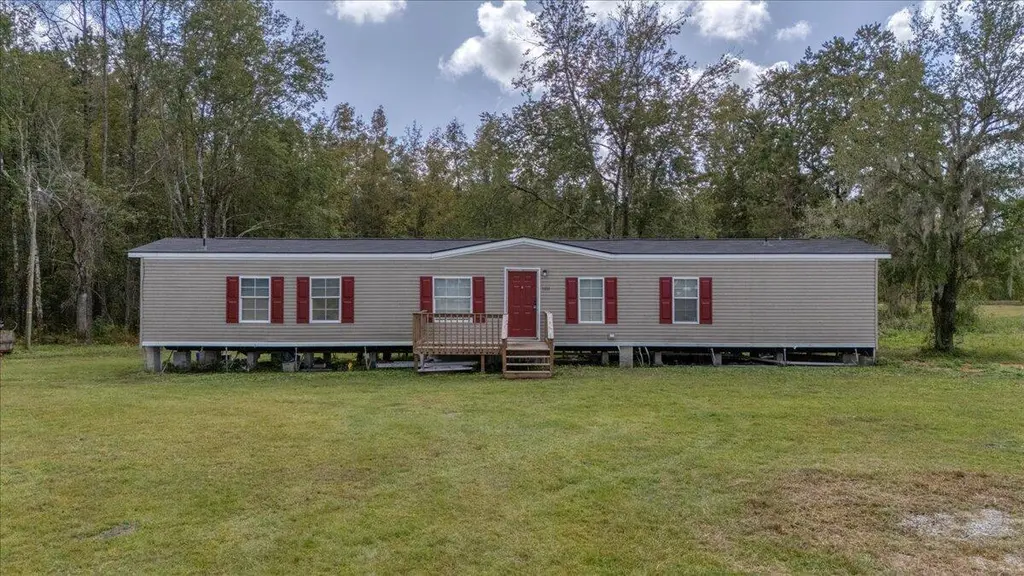
1011 Ridge Rd · Ridgeville, SC
Flood risk 1/10 · Minimal
- FEMA flood zone
- X (unshaded)
- Chance of flooding over 30 yrs
- 0.0%
- Est. flood insurance / yr
- $507 – $1,088
Fire risk 7/10 · Major
- Est. fire insurance / yr
- $783 – $1,453
Heat risk 8/10 · Major
- Hot days now (above 107°F)
- 7 days/yr
- Hot days in 30 yrs
- 17 days/yr
Wind risk 8/10 · Major
- Chance of severe wind over 30 yrs
- 80.0%
Air-quality risk 3/10 · Minor
- Unhealthy air days now
- 3 days/yr
- Unhealthy air days in 30 yrs
- 3 days/yr
Risk factors via First Street. Map © Google.
Why this score? — see what drove the D- grade
The composite is a weighted blend of 9 inputs, each scored 0–100. Each bar is that input's sub-score; the figure is the points it added to the 100-point composite (weight × sub-score).
- Cash flow +15.0/30.0
- ARV discount +7.5/15.0
- DSCR +4.6/10.0
- Livability +3.0/5.0
- 1% rule +2.8/10.0
- Rent growth +2.5/5.0
- Condition / age +2.5/5.0
- Schools +2.1/10.0
- Appreciation +0.0/10.0
$250,000
🖨 Deal sheet 📄 Offer letter ✓ Due diligence
Listing remarks
Welcome to your dream home! This completely updated home, nestled on two acres, blends the charm of nature with modern comforts. As you approach the property, you'll notice the brand-new roof that provides peace of mind for years to come. This essential upgrade ensures the home is protected, allowing you to enjoy all four seasons in comfort. The brand New HVAC system provides efficient heating and cooling throughout the year, ensuring a cozy atmosphere whether it's the heat of summer or the crisp winter season. Step into the newly remodeled kitchen and enjoy the brand new appliances such as refrigerator, stove, and new microwave. The open-concept living areas flow effortlessly, offering ple
Key facts
- New appliances
- New roof
- All-new plumbing
Tags
Property features AI
Exterior
- Utilities: Septic tank
- Home design: Manufactured/mobile home; Single-wide; One level; Residential property; Fee simple ownership; Lot approximately 1–2 acres
- Construction: No other structures
- Exterior features: Architectural roof
Interior
- Kitchen: Built-in electric oven; Microwave; Refrigerator
- Bedrooms: 3 bedrooms; Master bedroom with ceiling fan(s)
- Flooring: Laminate
- Bathrooms: 2 bathrooms
- Heating & cooling: Central heating; Central air conditioning
- Interior features: Family room; Separate dining room
- Laundry & utility: Washer hookup; Laundry room
Neighborhood map
What this means for you Summary
Snapshot
- This is a 3-bed/2.0-bath manufactured listed at $250k.
Deal economics
- At list price, monthly cash flow is $77 ($924/yr) — positive.
- The deal already cash-flows at list — no discount required.
- To meet the 1% rule (rent ≥ 1% of price), the offer needs to be $196k (21.6% below list).
- Recommended offer: $196k (21.6% below list) — sets the bar for 1% rule.
- Cap rate 6.7% vs local median 3.1% in Ridgeville — top-decile yield for the area; either an underpriced asset or a hidden risk that comps aren't pricing in. Stress-test before assuming the spread holds.
Location & tenants
- Location reads 59/100 on livability (#245 in SC) — a working-class tenant base; expect higher turnover. Strengths: cost of living A+, housing A+, crime A-; Watch: health & safety C-, employment D, amenities F.
- Dorchester 04 (rural): math 17% / reading 33% proficiency, ranked #62 of 80 in SC (top 78%) — low school quality limits family demand, transient renter base, plan for 1-2y turnover; 70% free/reduced lunch — lower-income household profile, screen leases tightly.
- Zoned schools: Clay Hill Elementary (math 17% / reading 32%, grade F, #452 of 597 statewide, top 78%, 164 students, 100% FRL); Harleyville-Ridgeville Middle (math 7% / reading 25%, grade F, #196 of 229 statewide, top 87%, 169 students, 100% FRL); Woodland High (math 5% / reading 87%, grade D-, #163 of 196 statewide, top 83%, 612 students, 100% FRL) — zoned schools average 100% FRL vs 70% district-wide (30 pts higher); higher-poverty schools than district average — tighter screening recommended.
- Market conditions: 190 active listings in the ZIP; 1,199 units permitted in Dorchester County in 2024 (0 in 5+ unit buildings).
Forward outlook
- Local home prices are declining (-3.0%/yr); year-one equity from $2k of loan paydown is wiped out by about $8k of value loss. Plan a longer hold.
- Dorchester County population projected at +43% by 2050 — long-run rental-demand tailwind backs the buy-and-hold thesis.
Negotiation context
- It's been on market 87 days — a 6% lower offer ($235k) is reasonable based on typical stale-listing flexibility.
- 3 sale attempts since 2y ago; this cycle's ask is 11% above the opening price — seller raised mid-cycle; expect resistance to lowballs.
Risks & watch-outs
- Climate carrying-cost: severe wind risk, 80% chance of damaging wind over 30y; major wildfire risk; extreme-heat days projected 7→17/yr by 2055 (HVAC capex compounding) — expect insurance premiums to compound above CPI over the hold.
Questions for the listing agent
- It's been on market 87 days. Have you received any prior offers? Is the seller open to a 22% concession, seller financing, or rate buy-down credit?
- Why hasn't it sold? Are there any deal-killer items the seller is aware of (foundation, flood, title, zoning, code violations)?
- Is there a deadline driving the sale (1031 exchange, divorce, estate, relocation)? That informs how much negotiation room exists.
- Schools are F-rated, which usually means shorter tenancies and higher turnover. Who's the typical renter profile here, and what's been the actual vacancy rate?
- The area grade is low — what's the realistic commute time and amenity access for the typical tenant pool here? Any planned neighborhood developments (good or bad) we should know about?
- What's the average days-on-market for RENTAL listings here right now (not sales)? A rising rental-DOM trend means longer vacancies and softer asking-rent achievability than the comps imply.
- What's the recent tenant-quality profile in this submarket — average credit score on applications, eviction rate, late-payment / NSF rate, and stable-employment percentage? A property-management company in the area should have these aggregated.
- How much new for-sale + rental construction is in the pipeline within 1–3 miles? Heavy new supply typically softens prices + rents 12–24 months out; constrained supply supports both.
Investment metrics
- 1% rule
- 0.78% ✗
- Cap rate
- 6.66%
- Cash-on-cash
- 1.32%
- DSCR
- 1.06
- GRM
- 10.6
CMA / ARV
No comps found within radius.
Projected returns pro-forma
-3.0% appreciation · 3.0% rent growth · sell at horizon
- IRR
- -14.3%
- Equity multiple
- 0.49×
- Total profit
- $-35,732
- Equity at exit
- $37,276
- IRR
- -5.6%
- Equity multiple
- 0.64×
- Total profit
- $-25,318
- Equity at exit
- $21,615
Cash invested: $70,000 (down + closing). Projections, not guarantees.
Landlord ↔ Tenant lean methodology
- Overall (STATE)
- 90 Strongly Landlord-Friendly
- State South Carolina
- 90 Strongly Landlord-Friendly · R+6
- County
- — inherits STATE
- City
- — inherits STATE
ZIP-level market 29472
- Home prices YoY
- -12.5%
- Active inventory
- 190
- Price-to-rent
- 10.6×
Monthly cashflow live
- Estimated rent
- $1,959 medium interval (Pro) →
- Mortgage (P&I)
- −$1,311
- Tax from tax record
- −$56 /mo · $667/yr
- Insurance
- −$104
- HOA
- −$0
- Vacancy / Maint / Mgmt
- −$411
- Net cashflow
- $77
Break-even live
UW: 25.0% down · 7.5% · 30yr · 1.5% tax · 5.0% vac · 8.0% maint · 8.0% mgmt
Financing live
Cash to close
- Down payment
- $62,500
- Closing costs
- $7,500
- Reserves months
- —
- Total cash needed
- —
Loan-product check · same deal, 3 products live
Conventional
25% down · 7.5% · 30yr
- Down + closing
- —
- Monthly P&I
- —
- Monthly cashflow
- —
- DSCR
- —
- Eligible?
- —
Personal DTI + credit; lowest rate.
DSCR
20% down · 8.5% · 30yr
- Down + closing
- —
- Monthly P&I
- —
- Monthly cashflow
- —
- DSCR
- —
- Eligible?
- —
No personal income docs; deal must DSCR.
Hard money
10% down · 12.0% · 12mo
- Down + closing
- —
- Monthly P&I
- —
- Monthly cashflow
- —
- DSCR
- —
- Eligible?
- —
Short-term bridge; refi at stabilization.
Listing history 27 events
-
2026-06-18days on market $250,000 Active 87 DOM
-
2026-06-17days on market $250,000 Active 86 DOM
-
2026-06-16days on market $250,000 Active 85 DOM
-
2026-06-15days on market $250,000 Active 84 DOM
-
2026-06-13days on market $250,000 Active 82 DOM
-
2026-06-10days on market $250,000 Active 79 DOM
-
2026-06-09days on market $250,000 Active 78 DOM
-
2026-06-08days on market $250,000 Active 77 DOM
-
2026-06-07days on market $250,000 Active 76 DOM
-
2026-06-03days on market $250,000 Active 72 DOM
-
2026-06-03days on market $250,000 Active 71 DOM
-
2026-06-01days on market $250,000 Active 70 DOM
-
2026-05-31days on market $250,000 Active 69 DOM
-
2026-04-20price $250,000
-
2026-03-23$225,000 Active
-
2026-03-23historical
-
2026-02-13price $249,500
-
2026-01-12$250,000 Active
-
2025-04-03historical
-
2025-01-10price $225,500
-
2025-01-07price $225,000
-
2025-01-01price $225,500
-
2024-12-17price $225,000
-
2024-12-13price $224,500
-
2024-12-11price $225,000
-
2024-12-05price $224,500
-
2024-11-06$225,000 Active
ⓘ Source: listings_history table (triggers on properties + properties_extension) + one-shot
backfill from property_details.listing_events for pre-trigger history.
Tax reassessment forecast SC · Resets to sale price
- Current annual tax
- $667 · $56/mo
- Projected year-2 tax
- $1,425 · $119/mo
- Expected delta
- +$758/yr (+$63/mo · 113.5%)
ⓘ Screening estimate from a state-policy table — verify with the county assessor before closing.
Climate risk First Street
- Flood 1/10 Low FEMA zone X (unshaded) · 0% chance over 30 yrs
- Wildfire 7/10 Severe
- Heat 8/10 Severe 7 d/yr ≥107°F today · 17 d/yr by 30 yrs out
- Wind 8/10 Severe 80% chance of damaging wind over 30 yrs
- Air quality 3/10 Moderate 3 unhealthy d/yr today · 3 by 30 yrs out
Nearby sold comps map
Loading sold comps map…
Walkable amenities ~0.75 mi
Loading nearby amenities…
Taxation est. · year 1
- Rental income
- $23,512
- − Mortgage interest
- −$14,004
- − Property taxes
- −$667
- − Insurance
- −$1,250
- − Repairs & maintenance
- −$1,881
- − Management
- −$1,881
- − Depreciation
- −$7,273
- Taxable loss
- −$3,444
- Est. tax savings @ 24.0%
- +$827
- After-tax cash flow
- $1,751/yr
For passive investors: Depreciation is non-cash, so a rental often shows a tax loss while cash-flowing — sheltering income. Rental losses are passive: they offset passive income freely, and up to $25,000/yr can offset ordinary (W-2) income if you actively participate and your MAGI is under $100k (phasing out to $0 by $150k); unused losses carry forward. On sale, claimed depreciation is recaptured at up to 25%, and gains may owe capital-gains tax (a 1031 exchange can defer both). Figures are a year-1 estimate at your 24.0% rate — not tax advice; consult a CPA.
Schools (NCES district)
- District
- Dorchester 04
- NCES district ID
- 4500002
- Math proficiency
- 17% ▼ -18.00%
- Reading proficiency
- 33% ▼ -8.00%
- Median HH income
- $36,082
- Composite
- 20.67/100
- National rank
- #8533
- State rank
- #62 of 80 in SC
Livability — Ridgeville
- Score
- 59/100
- State rank
- #245
- US rank
- #20104
Category grades
Schools grade is shown separately in the Schools card above.
Census & demographics
- Population (ZIP)
- 11,531
Population outlook (Dorchester County) Hauer SSP2
- Today (2025)
- 186,982 people
- By 2030
- 203,967 · +9.1%
- By 2040
- 237,160 · +26.8%
- By 2050
- 267,479 · +43.1%
- By 2075
- 333,025 · +78.1%
- By 2100
- 366,560 · +96.0%
Race, ethnicity, and origin ACS 2023
- Neighborhood character
- Diverse neighborhood (Simpson 0.56)
- Race & ethnicity
- White 60% Black 27% Two or more races 7% Hispanic / Latino 6% Native American 2%
- Hispanic origin (detail)
- Mexican 2% Puerto Rican 2%
- Common ancestry
- Russian 2% Estonian 2% Lithuanian 2%
- Foreign-born
- 5% · Canada
- Languages at home
- 94% English-only · Spanish 5%
Political lean MEDSL · Dorchester
- 2024 margin
- R (+14.6) · D 41.8% · R 56.4% · Other 1.9%
- 2008→2024 swing
- +0.9pp no change · 2008: -15.5pp · 2024: -14.6pp
- All cycles
- 2024: R+14.6 2020: R+10.5 2016: R+17.5 2012: R+16.0 2008: R+15.5
Not yet ingested
- Civics
- —
Market trends
- HPI YoY
- ▼ -40.36%
- Current HPI
- 282.1478
- Rent YoY
- —
- Metro
- —
- State GDP YoY
- ▲ 4.51%
- F500 in state
- 2
Industry mix (Fortune 500 HQ in SC)
| Industry | F500 HQs | Revenue |
|---|---|---|
| Packaging | 1 | $7B |
|
||
Price history
+11.1% since first listed14 events — show timeline
- 2026-04-20 Price Changed $250,000 Charleston Trident MLS
- 2026-03-23 Listing Removed — Charleston Trident MLS
- 2026-03-23 Listed $225,000 Charleston Trident MLS
- 2026-02-13 Price Changed $249,500 Charleston Trident MLS
- 2026-01-12 Listed $250,000 Charleston Trident MLS
- 2025-04-03 Listing Removed — Charleston Trident MLS
- 2025-01-10 Price Changed $225,500 Charleston Trident MLS
- 2025-01-07 Price Changed $225,000 Charleston Trident MLS
- 2025-01-01 Price Changed $225,500 Charleston Trident MLS
- 2024-12-17 Price Changed $225,000 Charleston Trident MLS
- 2024-12-13 Price Changed $224,500 Charleston Trident MLS
- 2024-12-11 Price Changed $225,000 Charleston Trident MLS
- 2024-12-05 Price Changed $224,500 Charleston Trident MLS
- 2024-11-06 Listed $225,000 Charleston Trident MLS
Property tax history
+14.8%/yrLatest (2022): $667 · +0.0% YoY. Source: county tax records.
Cash-flow waterfall
monthlySold comps — $/sqft
last 12 mo · ≤1 miLoading sold comps…