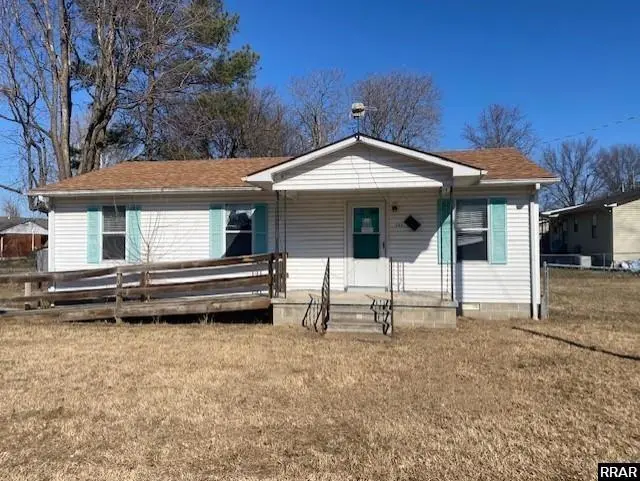
413 Church St · Ridgely, TN
Flood risk 1/10 · Minimal
- FEMA flood zone
- X
- Chance of flooding over 30 yrs
- 0.0%
- Est. flood insurance / yr
- $507 – $1,088
Fire risk 1/10 · Minimal
- Est. fire insurance / yr
- $949 – $1,763
Heat risk 6/10 · Moderate
- Hot days now (above 107°F)
- 7 days/yr
- Hot days in 30 yrs
- 21 days/yr
Wind risk 4/10 · Minor
- Chance of severe wind over 30 yrs
- 8.0%
Air-quality risk 1/10 · Minimal
- Unhealthy air days now
- 0 days/yr
- Unhealthy air days in 30 yrs
- 0 days/yr
Risk factors via First Street. Map © Google.
Why this score? — see what drove the B- grade
The composite is a weighted blend of 9 inputs, each scored 0–100. Each bar is that input's sub-score; the figure is the points it added to the 100-point composite (weight × sub-score).
- Cash flow +30.0/30.0
- 1% rule +10.0/10.0
- DSCR +10.0/10.0
- ARV discount +7.5/15.0
- Appreciation +3.4/10.0
- Livability +3.0/5.0
- Rent growth +2.5/5.0
- Condition / age +2.5/5.0
- Schools +1.0/10.0
$34,900
🖨 Deal sheet 📄 Offer letter ✓ Due diligence
Listing remarks MLS
Comfy Sized Home-Perfect Size For The First Home. Living Room Is Of Good Size, Kitchen/Dining Room “The seller does not accept blind offers or escalation clauses. ” “Cash offers require 10% EMD or $1,000 minimum, whichever is greater, and all financed offers require 1% EMD or $1,000 minimum, whichever is greater. ”
Key facts
- Fenced in backyard
- Counter space
- Built 1994
Tags
Neighborhood map
What this means for you Summary
Snapshot
- This is a 3-bed/1.0-bath single-family listed at $35k.
Deal economics
- At list price, monthly cash flow is $510 ($6k/yr) — positive.
- The deal already cash-flows at list — no discount required.
- Meets the 1% rule at list price ($959 rent vs $35k).
- Recommended offer: $31k (12.0% below list) — sets the bar for market timing.
Location & tenants
- Location reads 60/100 on livability (#272 in TN) — a middle-class / working-renter tenant base. Strengths: cost of living A+, housing A+, crime B; Watch: health & safety C-, schools F, amenities F.
- Lake County (rural): math 11% / reading 14% proficiency, ranked #135 of 139 in TN (top 97%) — low school quality limits family demand, transient renter base, plan for 1-2y turnover; 71% free/reduced lunch — lower-income household profile, screen leases tightly.
- Market conditions: 21 active listings in the ZIP; 3 units permitted in Lake County in 2024 (0 in 5+ unit buildings).
Forward outlook
- Local home prices are declining (-3.0%/yr); year-one equity from $241 of loan paydown is wiped out by about $1k of value loss. Plan a longer hold.
- Lake County population projected to shrink 8% by 2050 — rents likely to lag national; underwrite the cash flow, not the appreciation.
- At projected returns (-3.0% appreciation + 3.0% rent growth), your $10k cash investment doubles in ~2 years — after that, you're playing with house money.
Negotiation context
- It's been on market 167 days — a 12% lower offer ($31k) is reasonable based on typical stale-listing flexibility.
Risks & watch-outs
- Climate carrying-cost: extreme-heat days projected 7→21/yr by 2055 (HVAC capex compounding) — expect insurance premiums to compound above CPI over the hold.
Questions for the listing agent
- It's been on market 167 days. Have you received any prior offers? Is the seller open to a 12% concession, seller financing, or rate buy-down credit?
- Why hasn't it sold? Are there any deal-killer items the seller is aware of (foundation, flood, title, zoning, code violations)?
- Is there a deadline driving the sale (1031 exchange, divorce, estate, relocation)? That informs how much negotiation room exists.
- Schools are F-rated, which usually means shorter tenancies and higher turnover. Who's the typical renter profile here, and what's been the actual vacancy rate?
- What's the average days-on-market for RENTAL listings here right now (not sales)? A rising rental-DOM trend means longer vacancies and softer asking-rent achievability than the comps imply.
- What's the recent tenant-quality profile in this submarket — average credit score on applications, eviction rate, late-payment / NSF rate, and stable-employment percentage? A property-management company in the area should have these aggregated.
- How much new for-sale + rental construction is in the pipeline within 1–3 miles? Heavy new supply typically softens prices + rents 12–24 months out; constrained supply supports both.
Investment metrics
- 1% rule
- 2.75% ✓
- Cap rate
- 23.83%
- Cash-on-cash
- 62.64%
- DSCR
- 3.79
- GRM
- 3.0
CMA / ARV
- ARV (median comp)
- $102,329
- List price
- $34,900
- Delta
- -65.89%
- Verdict
- UNDERPRICED
- Comps
- 20 within 1.0 mi
Show comp detail 3 sales within ~0.75 mi
| Address | Dist | Beds/Ba | Sqft | Sold | Price | $/sf | Match |
|---|---|---|---|---|---|---|---|
| 217 North St | 0.08mi | 3/1.0 | 1,060 (+2%) | 1mo | $104,900 | $99 | 93 |
| 307 King St | 0.19mi | 2/1.0 (-1) | 885 (-15%) | 16mo | $80,000 | $90 | 48 |
| 423 N College St | 0.20mi | 2/1.0 (-1) | 1,196 (+15%) | 21mo | $136,000 | $114 | 44 |
Match score weights: distance 35% · size 25% · config 20% · recency 20%. Top-matched comps best support the ARV.
Projected returns pro-forma
-3.0% appreciation · 3.0% rent growth · sell at horizon
- IRR
- 61.6%
- Equity multiple
- 3.75×
- Total profit
- $26,850
- Equity at exit
- $5,204
- IRR
- 66.2%
- Equity multiple
- 7.68×
- Total profit
- $65,289
- Equity at exit
- $3,018
Cash invested: $9,772 (down + closing). Projections, not guarantees.
Landlord ↔ Tenant lean methodology
- Overall (STATE)
- 87 Strongly Landlord-Friendly
- State Tennessee
- 87 Strongly Landlord-Friendly · R+13
- County
- — inherits STATE
- City
- — inherits STATE
ZIP-level market 38080
- Home prices YoY
- -1.7%
- Active inventory
- 21
- Price-to-rent
- 3.0×
Monthly cashflow live
- Estimated rent
- $959 medium interval (Pro) →
- Mortgage (P&I)
- −$183
- Tax from tax record
- −$50 /mo · $602/yr
- Insurance
- −$15
- HOA
- −$0
- Vacancy / Maint / Mgmt
- −$201
- Net cashflow
- $510
Break-even live
UW: 25.0% down · 7.5% · 30yr · 1.5% tax · 5.0% vac · 8.0% maint · 8.0% mgmt
Financing live
Cash to close
- Down payment
- $8,725
- Closing costs
- $1,047
- Reserves months
- —
- Total cash needed
- —
Loan-product check · same deal, 3 products live
Conventional
25% down · 7.5% · 30yr
- Down + closing
- —
- Monthly P&I
- —
- Monthly cashflow
- —
- DSCR
- —
- Eligible?
- —
Personal DTI + credit; lowest rate.
DSCR
20% down · 8.5% · 30yr
- Down + closing
- —
- Monthly P&I
- —
- Monthly cashflow
- —
- DSCR
- —
- Eligible?
- —
No personal income docs; deal must DSCR.
Hard money
10% down · 12.0% · 12mo
- Down + closing
- —
- Monthly P&I
- —
- Monthly cashflow
- —
- DSCR
- —
- Eligible?
- —
Short-term bridge; refi at stabilization.
Listing history 11 events
-
2026-06-04remarks 349-char remark
-
2026-06-04status $34,900 Pending 167 DOM
-
2026-06-03days on market $34,900 Active 167 DOM
-
2026-06-02days on market $34,900 Active 166 DOM
-
2026-06-01days on market $34,900 Active 165 DOM
-
2026-05-31days on market $34,900 Active 164 DOM
-
2026-04-24price $39,600 350-char remark
Show marketing remark (350 chars)
Comfy Sized Home-Perfect Size For The First Home. Living Room Is Of Good Size, Kitchen/Dining Room “The seller does not accept blind offers or escalation clauses. ” “Cash offers require 10% EMD or $1,000 minimum, whichever is greater, and all financed offers require 1% EMD or $1,000 minimum, whichever is greater. ”
-
2026-04-10price $44,000 350-char remark
Show marketing remark (350 chars)
Comfy Sized Home-Perfect Size For The First Home. Living Room Is Of Good Size, Kitchen/Dining Room “The seller does not accept blind offers or escalation clauses. ” “Cash offers require 10% EMD or $1,000 minimum, whichever is greater, and all financed offers require 1% EMD or $1,000 minimum, whichever is greater. ”
-
2026-03-19price $52,200 350-char remark
Show marketing remark (350 chars)
Comfy Sized Home-Perfect Size For The First Home. Living Room Is Of Good Size, Kitchen/Dining Room “The seller does not accept blind offers or escalation clauses. ” “Cash offers require 10% EMD or $1,000 minimum, whichever is greater, and all financed offers require 1% EMD or $1,000 minimum, whichever is greater. ”
-
2026-01-23price $55,100 350-char remark
Show marketing remark (350 chars)
Comfy Sized Home-Perfect Size For The First Home. Living Room Is Of Good Size, Kitchen/Dining Room “The seller does not accept blind offers or escalation clauses. ” “Cash offers require 10% EMD or $1,000 minimum, whichever is greater, and all financed offers require 1% EMD or $1,000 minimum, whichever is greater. ”
-
2025-12-19$58,000 Active 350-char remark
Show marketing remark (350 chars)
Comfy Sized Home-Perfect Size For The First Home. Living Room Is Of Good Size, Kitchen/Dining Room “The seller does not accept blind offers or escalation clauses. ” “Cash offers require 10% EMD or $1,000 minimum, whichever is greater, and all financed offers require 1% EMD or $1,000 minimum, whichever is greater. ”
ⓘ Source: listings_history table (triggers on properties + properties_extension) + one-shot
backfill from property_details.listing_events for pre-trigger history.
Tax reassessment forecast TN · Resets to sale price
- Current annual tax
- $602 · $50/mo
- Projected year-2 tax
- $602 · $50/mo
- Expected delta
- $0/yr ($0/mo · 0.0%)
ⓘ Screening estimate from a state-policy table — verify with the county assessor before closing.
Climate risk First Street
- Flood 1/10 Low FEMA zone X · 0% chance over 30 yrs
- Wildfire 1/10 Low
- Heat 6/10 Major 7 d/yr ≥107°F today · 21 d/yr by 30 yrs out
- Wind 4/10 Moderate 8% chance of damaging wind over 30 yrs
- Air quality 1/10 Low 0 unhealthy d/yr today · 0 by 30 yrs out
Nearby sold comps map
Loading sold comps map…
Walkable amenities ~0.75 mi
Loading nearby amenities…
Taxation est. · year 1
- Rental income
- $11,511
- − Mortgage interest
- −$1,955
- − Property taxes
- −$602
- − Insurance
- −$174
- − Repairs & maintenance
- −$921
- − Management
- −$921
- − Depreciation
- −$1,015
- Taxable income
- $5,923
- Est. tax owed @ 24.0%
- −$1,421
- After-tax cash flow
- $4,700/yr
For passive investors: Depreciation is non-cash, so a rental often shows a tax loss while cash-flowing — sheltering income. Rental losses are passive: they offset passive income freely, and up to $25,000/yr can offset ordinary (W-2) income if you actively participate and your MAGI is under $100k (phasing out to $0 by $150k); unused losses carry forward. On sale, claimed depreciation is recaptured at up to 25%, and gains may owe capital-gains tax (a 1031 exchange can defer both). Figures are a year-1 estimate at your 24.0% rate — not tax advice; consult a CPA.
Schools (NCES district)
- District
- Lake County
- NCES district ID
- 4702280
- Math proficiency
- 11% ▼ -9.00%
- Reading proficiency
- 14% ▼ -9.00%
- Median HH income
- $29,058
- Composite
- 9.69/100
- National rank
- #9833
- State rank
- #135 of 139 in TN
Livability — Ridgely
- Score
- 60/100
- State rank
- #272
- US rank
- #19162
Category grades
Schools grade is shown separately in the Schools card above.
Census & demographics
- Census place
- Ridgely, TN
- Population (ZIP)
- 2,492
Population outlook (Lake County) Hauer SSP2
- Today (2025)
- 7,234 people
- By 2030
- 7,045 · -2.6%
- By 2040
- 6,848 · -5.3%
- By 2050
- 6,681 · -7.6%
- By 2075
- 5,629 · -22.2%
- By 2100
- 4,211 · -41.8%
Race, ethnicity, and origin ACS 2023
- Neighborhood character
- Predominantly White (71%)
- Race & ethnicity
- White 71% Black 17% Two or more races 11% Hispanic / Latino 5%
- Common ancestry
- Italian 1%
- Foreign-born
- 2% · Canada
- Languages at home
- 98% English-only · Spanish 2% French/Haitian/Cajun 1%
Political lean MEDSL · Lake
- 2024 margin
- Solid R (+54.9) · D 22.1% · R 77.0%
- 2008→2024 swing
- -48.1pp toward R · 2008: -6.7pp · 2024: -54.9pp
- All cycles
- 2024: R+54.9 2020: R+47.5 2016: R+39.6 2012: R+13.4 2008: R+6.7
Not yet ingested
- Civics
- —
Market trends
- HPI YoY
- ▼ -3.11%
- Current HPI
- 178.0147
- Rent YoY
- —
- Metro
- —
- State GDP YoY
- ▲ 2.78%
- F500 in state
- 22
Industry mix (Fortune 500 HQ in TN)
| Industry | F500 HQs | Revenue |
|---|---|---|
| Healthcare | 3 | $91B |
|
||
| Retail | 3 | $72B |
|
||
| Transportation / Logistics | 1 | $88B |
|
||
| Paper / Packaging | 1 | $19B |
|
||
| Insurance | 1 | $13B |
|
||
| Energy | 1 | $12B |
|
||
Price history
-31.7% since first listed5 events — show timeline
- 2026-04-24 Price Changed $39,600 RRAR as distributed by MLS GRID
- 2026-04-10 Price Changed $44,000 RRAR as distributed by MLS GRID
- 2026-03-19 Price Changed $52,200 RRAR as distributed by MLS GRID
- 2026-01-23 Price Changed $55,100 RRAR as distributed by MLS GRID
- 2025-12-19 Listed $58,000 RRAR as distributed by MLS GRID
Property tax history
+1.8%/yrLatest (2025): $602 · +0.0% YoY. Source: county tax records.
Cash-flow waterfall
monthlySold comps — $/sqft
last 12 mo · ≤1 miLoading sold comps…